![]()
![]()
![]()
Food expenditure outside the home
In 2002, food expenditure outside the home accounted for 25.4 percent of total food expenditure by AE. Relative to 1989, this expenditure had increased across all regions, locations and income quintiles. However, it was more than twice as large in the highest income quintile than in the lowest (Table 10).
TABLE 9
Mean daily consumption per AE and percentages of
total expenditure on soda, alcohol and tobacco, by national total and extreme
income quintiles, 1989 to 2002
|
Food group |
Year* |
National (total) |
Income quintile per AE |
|||||||||||||
|
I
|
V
|
|||||||||||||||
|
%1 |
%2 |
g/d3 |
(RC) 4 |
Per capita (g/d)5 |
%1 |
%2 |
g/d3 |
(RC) 4 |
Per capita (g/d)5 |
%1 |
%2 |
g/d3 |
(RC)4 |
Per capita (g/d)5 |
||
|
Soda (ml) |
1989 |
49.5 |
5 |
203 |
(1.00) |
100 |
29 |
7 |
102 |
(1.00) |
30 |
58 |
4 |
276 |
(1.00) |
159 |
| |
1992 |
51.8 |
6 |
211 |
(1.04) |
109 |
27 |
8 |
104 |
(1.03) |
28 |
60 |
6 |
296 |
(1.07) |
179 |
| |
1994 |
53.3 |
5 |
228 |
(1.12) |
121 |
33 |
4 |
104 |
(1.02) |
35 |
60 |
4 |
319 |
(1.15) |
193 |
| |
1996 |
51.4 |
7 |
200 |
(0.98) |
103 |
31 |
7 |
91 |
(0.89) |
28 |
61 |
6 |
283 |
(1.02) |
171 |
| |
1998 |
58.2 |
8 |
232 |
(1.14) |
135 |
33 |
10 |
128 |
(1.26) |
43 |
66 |
8 |
317 |
(1.15) |
210 |
| |
2000 |
60.7 |
8 |
256 |
(1.26) |
155 |
40 |
8 |
129 |
(1.26) |
51 |
67 |
7 |
354 |
(1.28) |
238 |
| |
2002 |
61.5 |
8 |
242 |
(1.19) |
149 |
39 |
9 |
122 |
(1.20) |
48 |
69 |
8 |
335 |
(1.21) |
232 |
|
Alcohol (ml) |
1989 |
5.8 |
10 |
168 |
(1.00) |
10 |
5 |
7 |
89 |
(1.00) |
4 |
9 |
9 |
207 |
(1.00) |
19 |
| |
1992 |
5.2 |
9 |
201 |
(1.20) |
10 |
4 |
9 |
167 |
(1.87) |
7 |
9 |
11 |
249 |
(1.21) |
22 |
| |
1994 |
6.9 |
10 |
189 |
(1.13) |
13 |
6 |
12 |
86 |
(0.96) |
5 |
10 |
10 |
282 |
(1.37) |
28 |
| |
1996 |
5.4 |
9 |
187 |
(1.12) |
10 |
5 |
11 |
196 |
(2.20) |
9 |
9 |
9 |
230 |
(1.11) |
21 |
| |
1998 |
6.6 |
9 |
187 |
(1.12) |
12 |
5 |
13 |
271 |
(3.04) |
14 |
10 |
10 |
208 |
(1.00) |
20 |
| |
2000 |
6.9 |
11 |
172 |
(1.02) |
12 |
4 |
11 |
153 |
(1.72) |
6 |
11 |
13 |
213 |
(1.03) |
24 |
| |
2002 |
4.3 |
12 |
252 |
(1.51) |
11 |
2 |
11 |
196 |
(2.20) |
5 |
7 |
12 |
350 |
(1.70) |
25 |
|
Tobacco (g) |
1989 |
15.7 |
5 |
3.4 |
(1.00) |
0.54 |
11 |
5 |
1.6 |
(1.00) |
0.18 |
19 |
5 |
4.3 |
(1.00) |
0.83 |
| |
1992 |
21.1 |
6 |
2.8 |
(0.82) |
0.60 |
14 |
6 |
1.6 |
(1.01) |
0.23 |
26 |
6 |
4.1 |
(0.94) |
1.06 |
| |
1994 |
11.3 |
7 |
3.4 |
(1.00) |
0.39 |
7 |
9 |
2.1 |
(1.30) |
0.14 |
15 |
7 |
5.2 |
(1.19) |
0.76 |
| |
1996 |
9.2 |
5 |
3.3 |
(0.95) |
0.30 |
6 |
6 |
1.6 |
(1.00) |
0.10 |
12 |
5 |
4.8 |
(1.11) |
0.58 |
| |
1998 |
8.7 |
5 |
3.8 |
(1.10) |
0.33 |
5 |
6 |
1.5 |
(0.97) |
0.08 |
11 |
5 |
5.9 |
(1.37) |
0.63 |
| |
2000 |
9.1 |
6 |
3.7 |
(1.06) |
0.33 |
5 |
6 |
1.7 |
(1.04) |
0.08 |
11 |
5 |
5.5 |
(1.26) |
0.62 |
| |
2002 |
7.1 |
6 |
4.9 |
(1.44) |
0.35 |
2 |
8 |
3.0 |
(1.87) |
0.07 |
11 |
6 |
6.8 |
(1.58) |
0.77 |
TABLE 10
Median daily food expenditure outside the home
as percentage of total food expenditure, 1989 to 2002.
|
Year* |
National (total) |
Income quintile per AE |
||||
|
I |
V |
|||||
|
%1 |
(RC)2 |
%1 |
(RC)2 |
%1 |
(RC)2 |
|
|
1989 |
23 |
(1.00) |
13 |
(1.00) |
34 |
(1.00) |
|
1992 |
24 |
(1.04) |
19 |
(1.46) |
29 |
(0.85) |
|
1994 |
26 |
(1.13) |
15 |
(1.15) |
39 |
(1.15) |
|
1996 |
22 |
(0.96) |
16 |
(1.23) |
31 |
(0.91) |
|
1998 |
22 |
(0.96) |
15 |
(1.15) |
32 |
(0.94) |
|
2000 |
24 |
(1.04) |
13 |
(1.00) |
35 |
(1.03) |
|
2002 |
25 |
(1.09) |
15 |
(1.15) |
37 |
(1.09) |
Data weighted by the expansion factors.
Sample sizes: 1989, 11 531 (expanded cases, 15 947 773); 1992, 10 508 (expanded
cases, 17 798 635); 1994, 12 815, (expanded cases, 19 440 278); 1996, 14 042
(expanded cases, 20 467 038); 1998, 10 952 (expanded cases, 22 163 568); 2000,
10 089 (expanded cases, 23 452 319); 2002, 17167 (expanded cases, 24 650 169).
1 Percentage of total food expenditure.
2 Relative change.
Source: MHIES, 1989 to 2002.
Breastfeeding patterns in Mexico
In Mexico, the average duration of breastfeeding is nine months, but only 25.7 percent of mothers reported exclusive breastfeeding for four months, and 20.3 percent for six months. Among the socio-demographic factors associated with shorter periods of exclusive breastfeeding are living in urban locations, being a non-indigenous family, and having a BMI above the mean (Table 11).
TABLE 11
Breastfeeding by socio-economic, demographic
and anthropometric characteristics, 1999
| |
Duration of breastfeeding (months, median) |
Ever breastfed (%) |
Exclusive breastfeeding1 (%) |
|
|
4 months |
6 months |
|||
|
N |
|
|
502 |
750 |
|
National |
9 |
92.3 |
25.7 |
20.3 |
|
Region |
|
|
|
|
|
North |
6 |
91.8 |
16.5 |
10.5 |
|
Central |
8 |
91.6 |
25.0 |
19.1 |
|
Mexico City |
7 |
92.0 |
11.6 |
12.3 |
|
South |
15 |
93.5 |
36.54 |
30.54 |
|
Location |
|
|
|
|
|
Urban |
7 |
92.3 |
20.9 |
15.0 |
|
Rural |
14 |
92.2 |
36.14 |
33.24 |
|
Ethnicity2 |
|
|
|
|
|
Indigenous |
>24 |
93.5 |
48.2 |
48.4 |
|
Non-indigenous |
8 |
92.3 |
23.24 |
17.84 |
|
Socio-economic status3 |
|
|
|
|
|
Low |
15 |
92.3 |
39.8 |
33.8 |
|
Middle |
8 |
91.6 |
17.3 |
14.2 |
|
High |
6 |
93.1 |
20.74 |
14.34 |
|
Number of children |
|
|
|
|
|
1 |
7 |
94.1 |
22.8 |
16.6 |
|
2 |
8 |
91.6 |
26.1 |
19.9 |
|
³ 3 |
12 |
91.5 |
27.8 |
23.6 |
|
Maternal age |
|
|
|
|
|
> 19 years |
12 |
92.2 |
27.6 |
23.1 |
|
19 to < 25 years |
10 |
93.5 |
24.5 |
21.6 |
|
25 to < 35 years |
8 |
92.2 |
25.9 |
18.3 |
|
³ 35 years |
9 |
89.9 |
26.5 |
20.8 |
|
BMI (kg/m2) |
|
|
|
|
|
< mean (25.7) |
10 |
93.6 |
33.2 |
25.7 |
1 Exclusive breastfeeding = receiving only breastmilk (consumption
of pharmaceutical products - medicines or vitamin/mineral preparations - was
not explored).
2 Indigenous = mother speaks a native language.
3 Calculated through principal components analysis.
4 p < 0.05.
Source: Gonzalez-Cossio et al., 2003.
Nutritional status of children under five years of age
Table 12 presents the prevalence of low HAZ, WAZ and WHZ in 1988 and 1999. In 1988, almost one-quarter of children under five years of age in Mexico were stunted (HAZ < -2.0 SD of the NCHS reference population) and 6.3 percent were wasted (WHZ < -2.0 SD of the NCHS reference population). Eleven years later, in 1999, wasting was no longer a public health concern in Mexico, with only 2.1 percent of children being wasted, but a substantial percentage remained stunted - almost 18 percent. The low prevalence of wasting in Mexico runs parallel to an equally low prevalence of this condition in almost all Latin American countries, which have an average prevalence of less than 3 percent (de Onis and Blössner, 2003). In contrast, stunting continues to be a public health problem in several Latin American countries (ACC/SCN, 2000). Relative to countries with similar per capita GNP (Chile, Brazil and Argentina), Mexico had a higher prevalence of stunting in 1999. Moreover, the reduction of 5.1 percentage points in the 11 years between surveys (from 22.9 percent in 1988 to 17.8 percent in 1999) is below the reduction rate experienced by several other Latin American countries during the same period (Hernandez et al., 2003). Wasting declined to less than 2.5 percent in all regions, in urban and rural areas and in all socio-economic quintiles. The largest drop was observed in the North[9] and Central regions. As mentioned earlier, this condition is no longer a public health problem in Mexico.
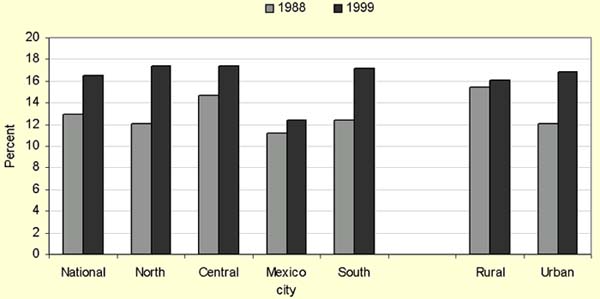
On the other hand, stunting rates in 1999 were not only high at the national level but also heterogeneous in the different regions, in urban and rural locations and across socio-economic categories. Stunting rates in the lowest socio-economic quintile were six times those of the highest; rates were almost three times as high in rural as in urban areas and in the South (the poorest region) than in Mexico City and the North (the wealthiest regions). The decline in stunting rates between 1988 and 1999 was almost totally accounted for by the changes observed in the lowest socio-economic group, and was more pronounced in the Central region and in urban areas (Table 12). It should be noted that localities that were classified as rural in 1988 might have become urban by 1999 owing to population growth; changes in stunting rates between the two data points may therefore be partially explained by the urbanization process. Similarly, geographic regions that were regarded as being within the metropolitan area of Mexico City in 1999 were considered part of the Central region in 1988. This may partially explain the increase in stunting rates in Mexico City - which has incorporated more poor populations into its surrounding metropolitan area - and the sharp decline in stunting in the Central region. Parallel to the sharp drop in wasting and the slow decline in stunting, overweight (WAZ > +2 SD of the NCHS reference population) in children under five years of age has increased slightly at the national level and in all regions, with the highest increases in the South and Mexico City, a smaller increase in the North and a decline in the Central region. Despite the lower increase in overweight rates, the North has the highest prevalence (Figure 2).
TABLE 12
Prevalence of low HAZ, WAZ and WHZ in children
(0 to four years) by region, urban or rural location and socio-economic
quintile, 1988 and 1999
| |
HAZ |
WAZ |
WHZ |
|||||||||
| |
< -2 SD |
< -3 SD |
< -2 SD |
< -3 SD |
< -2 SD |
< -3 SD |
||||||
| |
1988 |
1999 |
1988 |
1999 |
1988 |
1999 |
1988 |
1999 |
1988 |
1999 |
1988 |
1999 |
|
National |
22.9 |
17.8 |
9.3 |
5.7 |
13.9 |
7.6 |
2.9 |
1.2 |
6.3 |
2.1 |
1.6 |
0.6 |
|
Region |
|
|
|
|
|
|
|
|
|
|
|
|
|
North1 |
11.0 |
7.1 |
3.9 |
1.7 |
10.5 |
3.3 |
1.4 |
0.8 |
10.1 |
2.2 |
2.9 |
0.6 |
|
Central2 |
25.1 |
14.5 |
9.6 |
4.4 |
13.8 |
6.1 |
3.0 |
1.3 |
7.1 |
2.3 |
1.5 |
1.0 |
|
Mexico city3 |
9.8 |
13.1 |
2.6 |
3.7 |
6.1 |
6.8 |
0.6 |
0.3 |
3.6 |
2.3 |
1.0 |
0.2 |
|
South4 |
34.1 |
29.2 |
15.6 |
10.2 |
20.5 |
12.0 |
4.7 |
1.8 |
5.3 |
1.7 |
1.4 |
0.4 |
|
Location |
|
|
|
|
|
|
|
|
|
|
|
|
|
Rural5 |
34.7 |
32.2 |
17.1 |
10.9 |
19.6 |
12.3 |
4.5 |
2.2 |
5.9 |
2.1 |
1.7 |
0.6 |
|
Urban6 |
18.8 |
11.7 |
14.2 |
3.5 |
12.3 |
5.7 |
2.4 |
0.8 |
6.4 |
2.0 |
1.6 |
0.6 |
|
Socio-economic status |
|
|
|
|
|
|
|
|
|
|
|
|
|
Low7 |
42.0 |
35.3 |
20.4 |
13.3 |
24.0 |
15.6 |
6.0 |
2.5 |
5.7 |
2.6 |
1.4 |
0.8 |
|
Medium8 |
16.9 |
15.0 |
5.0 |
3.8 |
11.1 |
6.5 |
1.5 |
1.0 |
6.8 |
2.4 |
1.5 |
0.8 |
|
High9 |
6.2 |
6.0 |
2.8 |
1.2 |
5.7 |
2.8 |
1.4 |
0.4 |
6.1 |
1.4 |
2.0 |
0.4 |
Sample sizes: 1988, 5904 (weight, 7 101 607); 1999, 8 011
(weight, 10 612 397).
1 Sample sizes: 1988, 1 430 (weight, 1 097
654); 1999, 2 317 (weight, 1 984 629).
2Sample sizes: 1988, 1 411
(weight: 2 235 041); 1999, 2 533 (weight, 3 648 563).
3 Sample
sizes: 1988, 1 478 (weight, 1 422 801); 1999, 571 (weight, 1 492 824).
4
Sample sizes: 1988, 1 585 (weight, 2 346 111); 1999, 2 590 (weight, 3 486
381).
5 Sample sizes: 1988, 1 022 (weight, 5 526 366); 1999, 3 312
(weight, 3 161 671).
6 Sample sizes: 1988, 4 882 (weight, 1 575
241); 1999, 4 699 (weight, 7 450 726).
7Sample sizes: 1988, 1 531
(weight, 2 229 853); 1999, 2 414 (weight, 2 882 015.
8Sample
sizes: 1988, 2 862 (weight, 3 267 560); 1999, 2 804 (weight, 3 454
492).
9 Sample sizes: 1988, 1 511 (weight, 1 604 194); 1999, 2 572
(weight, 4 025 820).
Sources: MNS-1, 1988; MNS-2, 1999.
FIGURE 2
Prevalence of overweight in children aged 0
to 4.9 years, national total, by region and by residence, 1988 and
1999
|
|
Sources: MNS, 1988; 1999.
Prevalence of overweight in school-age children
The prevalence of overweight in children aged five to 11 years was analysed from MNS-2 in 1999. No data were available on the anthropometry of school-age children from MNS-1 in 1988. Approximately one-quarter of children were overweight according to the reference proposed by Must, Dallal and Dietz (1991), while according to the Cole et al. (2000) classification, the prevalence was almost 20 percent. Prevalence was substantially higher in the wealthier North and Mexico City relative to the South and Central regions; it was twice as high in urban as in rural areas, higher in females and in the children of more educated women, and lower in indigenous populations (Table 13).
TABLE 13
Prevalence of overweight in school-age children
(five to 11 years) by region, residence, gender, maternal education level and
ethnicity
|
Variable |
|
n |
Cole |
Must |
|
% |
% |
|||
|
National |
|
10 901 |
19.5 |
27.3 |
|
Region |
North |
3 188 |
25.6 |
34.9 |
| |
Central |
3 292 |
18.0 |
25.6 |
| |
Mexico City |
855 |
26.6 |
33.4 |
| |
South |
3 566 |
14.3 |
22.2 |
|
Location |
Urban |
6 142 |
22.9 |
30.6 |
| |
Rural |
4 759 |
11.7 |
19.9 |
|
Sex |
Female |
5 505 |
21.2 |
28.7 |
| |
Male |
5 396 |
17.7 |
25.9 |
|
Maternal education |
No education |
2 415 |
12.0 |
19.8 |
| |
Elementary school |
5 087 |
17.6 |
25.1 |
| |
Middle school |
1 839 |
25.6 |
34.1 |
| |
High school or more |
1 560 |
25.6 |
33.3 |
|
Indigenous ethnicity |
No |
9 750 |
20.4 |
19.8 |
| |
Yes |
1 151 |
12.1 |
11.5 |
Sources: Cole et al., 2000; Must, Dallal and Dietz, 1999; MNS-1, 1988; MNS-2, 1999.
Prevalence of adult overweight, obesity and non-communicable chronic diseases
The changes in prevalence of overweight and obesity in Mexican adults were studied by comparing the results of MNS-1 (1988) and MNS-2 (1999), which included only women, and the results of MCDS (1994) and MHS (2000), which included both men and women.
Between 1988 and 1999, the prevalence of overweight and obesity increased in women by almost 70 percent (from 35 to 59 percent) (Table 14): overweight (BMI of 25 to 29.9) by almost 50 percent (from 24 to 35 percent), and obesity (BMI ³ 30) by 150 percent (from 9 to 24 percent). These dramatic increases were observed in all regions, in both urban and rural areas and in all socio-economic groups. The prevalence of BMI < 18.5, indicating low weight in adults, was less than 2 percent in women in 1999, indicating that undernutrition in women is no longer a public health concern in Mexico.
Adult underweight is not a public health problem among males either, as observed in MHS, which recorded prevalence of about 2 percent in both men and women. The prevalence of adequate weight in men and women decreased from 21.9 percent in 1994 to 21.2 percent in 2000. Stratifying by age, only 22 percent of adults aged 40 to 59 years had adequate weight in 2000. This age group also had the highest prevalence of obesity (35.4 percent) in 2000, representing a relative increase of 2.6 percentage points (about 8 percent) since 1994. However, the highest relative increases in obesity were observed in the youngest age group (20 to 39 years), where it increased by 6.9 percentage points (47 percent) over the study period, followed by the oldest group (60 to 75 years), which showed a 7.6 percentage point increase (36 percent). As expected, urban locations and the North region had the highest prevalence of overweight and obesity. Obesity increased more in the North and Central regions (by about 8 percentage points during the six-year period), followed by the South (about 6 percentage points) and Mexico City (3 percentage points) (Table 15).
Diabetes mellitus and hypertension have increased dramatically in Mexico. According to the case study analysis, between 1994 and 2000, diabetes mellitus increased by 3.3 percentage points in males and by 4.6 in females. Hypertension did not show relevant increases by sex, but substantial increases were observed in the 40 to 59 years age group, in urban locations and in the North region. High cholesterol and triglyceride concentrations were more prevalent in men than in women. The prevalence of these increased between 1994 and 2000 in males and females, all age groups, urban and rural locations, and all regions (Table 16). Awareness of these conditions is an issue. Prior to the survey, only 41 percent of the people with hypertension and 77 percent of those with diabetes were aware of their condition (NHS, 2000; Olaiz, Rojas and Barquera, 2003).
TABLE 14
BMI trends in women aged 20 to 49 years, by
residence and socio-economic status, 1988 and 2000
| |
BMI |
||||||||
| |
Underweight |
Normal |
Overweight |
Obese |
|||||
| |
(< 18.5 kg/m2) |
(18.5-24.9 kg/m2) |
(> 25 kg/m2) |
(> 30 kg/m2) |
|||||
| |
1988 |
2000 |
1988 |
2000 |
1988 |
2000 |
1988 |
2000 |
|
|
National |
|
7.7 |
1.8 |
55.7 |
33.4 |
36.6 |
64.7 |
9.4 |
29.0 |
|
Location1 |
Urban |
7.5 |
1.8 |
55.7 |
32.0 |
36.7 |
66.2 |
9.6 |
30.7 |
| |
Rural |
8.7 |
1.8 |
55.4 |
34.9 |
35.9 |
63.2 |
9.1 |
27.2 |
|
Socio-economic status |
Low |
9.3 |
2.4 |
55.8 |
37.7 |
34.9 |
59.9 |
9.7 |
25.1 |
| |
Medium |
7.0 |
1.5 |
51.7 |
30.2 |
41.3 |
68.3 |
10.6 |
32.8 |
| |
High |
6.8 |
1.6 |
59.2 |
32.1 |
34.0 |
66.4 |
8.4 |
29.3 |
Sample sizes: 1988, 10 746; 2000, 21 481.
1
Location: rural = < 15 000 inhabitants; urban = > 15 000
inhabitants.
Sources: MNS-1, 1988; MHS, 2000.
TABLE 15
BMI trends in adults aged 20 years and over, by
gender, age, residence and region, 1994 and 2000
|
BMI
|
|||||||||
| |
|
Underweight |
Normal |
Overweight |
Obese |
||||
| |
|
(< 18.5 kg/m2) |
(18.5-24.9 kg/m2) |
(25-29.9 kg/m2) |
(> 30 kg/m2) |
||||
| |
|
1994 |
2000 |
1994 |
2000 |
1994 |
2000 |
1994 |
2000 |
|
National |
|
1.7 |
1.8 |
42.2 |
32.5 |
35.9 |
37.5 |
20.2 |
28.3 |
|
Sex |
Male |
1.9 |
1.8 |
46.0 |
36.1 |
36.1 |
40.5 |
15.9 |
21.6 |
| |
Female |
1.5 |
1.7 |
39.4 |
30.8 |
35.8 |
36.1 |
23.4 |
31.3 |
|
Age (years) |
20-39 |
2.2 |
2.1 |
49.4 |
38.5 |
33.6 |
37.7 |
14.8 |
21.7 |
| |
40-59 |
0.4 |
1.0 |
24.4 |
22.1 |
42.4 |
41.5 |
32.8 |
35.4 |
| |
60-75 |
1.8 |
1.9 |
33.0 |
28.3 |
43.8 |
40.8 |
21.4 |
29.0 |
|
Location1 |
Urban |
1.6 |
1.6 |
40.9 |
29.4 |
37.7 |
40.3 |
19.8 |
28.7 |
| |
Rural |
- |
1.9 |
- |
35.5 |
- |
38.4 |
- |
24.2 |
|
Region |
North |
0.9 |
1.7 |
38.8 |
28.0 |
36.7 |
39.1 |
23.6 |
31.2 |
| |
Central |
2.4 |
1.8 |
45.6 |
31.6 |
33.8 |
40.1 |
18.2 |
26.5 |
| |
Mexico City |
1.5 |
1.3 |
44.1 |
32.3 |
33.9 |
42.9 |
20.5 |
23.5 |
| |
South |
1.9 |
1.7 |
38.2 |
36.2 |
42.6 |
38.5 |
17.3 |
23.6 |
Sample sizes: 1994, 2 125; 2000, 45 294.
1 Location: rural = < 15 000 inhabitants; urban = > 15 000
inhabitants. The 1994 survey did not include rural areas.
Sources: MCDS, 1994; MHS, 2000.
TABLE 16
Prevalence of diabetes mellitus, hypertension,
high blood cholesterol and high triglycerides in adults, by gender, age group,
residence and region, 1994 and 2000
| |
Diabetes mellitus1 |
Hypertension2 |
High cholesterol |
High triglycerides |
|||||
|
(> 200 mg/dl) |
(> 150 mg/dl) |
||||||||
|
1994 |
2000 |
1994 |
2000 |
1994 |
2000 |
1994 |
2000 |
||
|
Sex |
Male |
4.3 |
7.6 |
39.3 |
39.2 |
29.1 |
48.2 |
47.4 |
53.5 |
| |
Female |
3.7 |
8.3 |
27.8 |
30.9 |
23.5 |
42.2 |
34.1 |
45.0 |
|
Age (years) |
20-39 |
1.9 |
2.0 |
18.6 |
20.9 |
19.8 |
33.3 |
33.5 |
42.5 |
| |
40-59 |
7.2 |
12.5 |
38.3 |
45.2 |
38.4 |
69.2 |
53.6 |
63.5 |
| |
60-75 |
14.0 |
21.1 |
53.1 |
53.5 |
43.8 |
65.0 |
50.9 |
67.0 |
|
Location3 |
Urban |
4.0 |
8.8 |
26.1 |
34.2 |
26.0 |
42.2 |
39.7 |
45.6 |
| |
Rural |
- |
7.2 |
- |
33.0 |
- |
43.0 |
- |
53.1 |
|
Region |
North |
3.4 |
9.8 |
25.4 |
38.4 |
21.7 |
39.5 |
36.3 |
39.9 |
| |
Central |
5.0 |
7.6 |
30.0 |
33.7 |
28.2 |
48.2 |
32.2 |
53.5 |
| |
Mexico City |
1.7 |
8.9 |
23.7 |
27.9 |
29.8 |
53.5 |
46.7 |
30.0 |
| |
South |
5.2 |
7.3 |
23.6 |
30.4 |
23.7 |
33.4 |
47.7 |
45.2 |
Sample sizes: 1994, 2 125; 2000, 2 422.
1 Diabetes mellitus = fasting glucose > 126 mg/dl, or post-prandial
glucose > 200 mg/dl (WHO), or previous medical diagnosis of diabetes mellitus.
2 Hypertension = systolic blood pressure ³ 140 mm/Hg, and/or diastolic blood pressure ³ 90 mm/Hg in adults < 60 years, and systolic blood
pressure ³160 mm/Hg, and/or diastolic blood pressure
³ 90 mm/Hg in adults ³ 60 years.
3 Location: rural = < 15 000 inhabitants; urban = > 15 000
inhabitants.
Sources: MCDS, 1994; MHS, 2000.
|
[9] The apparent prevalence of
wasting in the North region in 1988 has been questioned because it was too high
for the level of development of the northern states of Mexico at that
time. |
![]()
![]()
![]()