![]()
![]()
![]()
Trends in food consumption
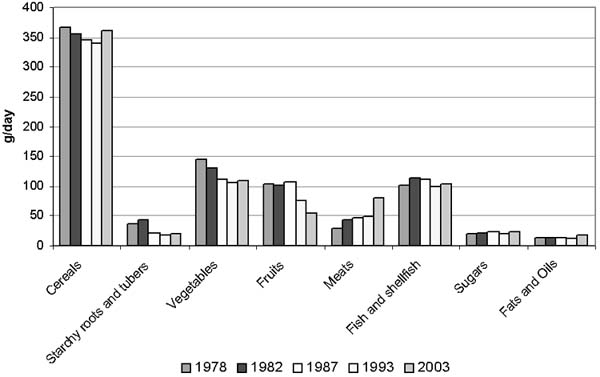
Food consumption in Philippine households has been analysed in two forms: as per capita intake in grams, and converted into kilocalories (kcal) of dietary energy. Food consumption recorded as raw as-purchased (AP) weight in grams has not changed significantly over the last 25 years. However, when converted into dietary energy, the mean daily per capita energy intake increased from 1 804 kcal in 1978 to 1 905 kcal in 2003 (Figure 3). Thus, while food intake has not increased in terms of weight, the energy density of diets is increasing. Figure 3 also demonstrates fluctuations in intake as measured both in grams and in kcal. The decreasing food intakes from 1982 to 1987 and from 1987 to 1993 may be related to the negative growth of the Philippine economy up to 1986 and from 1988 to 1991, the modest progress in reducing poverty, and lingering income inequality. The positive growth from 1991 to 1996 and from 1998 to 2003, on the other hand, reflects the increasing food intake from 1993 to 2003.
FIGURE 3
Trends in mean per capita food intake (g/day
and kcal/day) in Philippine households, 1978 to 2003
|
|
Sample sizes: 1978, 2 800; 1982, 2 280; 1987, 3 200; 1993, 4
050; 2003, 5 514.
Sources: NNS, 1978; 1982; 1987; 1993;
2003.
Trends in per capita food consumption (in grams) by food group
Generally, the overall dietary pattern in Philippine households remains that of rice, vegetables and fish (Table 4), which contributed 34, 13 and 12 percent, respectively, of food weight in 2003. The proportional contributions of rice and fish have remained similar over the past 25 years, while the proportion of vegetables has declined slightly.
TABLE 4
Trends in mean daily per capita food
consumption, by food group, 1978 to 2003
|
Food group/sub-group |
Consumption (g/day, raw, AP) |
||||
| |
1978 |
1982 |
1987 |
1993 |
2003 |
|
Cereals and cereal products |
367 |
356 |
345 |
340 |
364 |
|
Rice and products |
308 |
304 |
303 |
282 |
303 |
|
Maize and products |
38 |
34 |
24 |
36 |
31 |
|
Other cereals and products |
21 |
18 |
18 |
22 |
30 |
|
Starchy roots and tubers |
37 |
42 |
22 |
17 |
19 |
|
Sugars and syrups1 |
19 |
22 |
24 |
19 |
24 |
|
Fats and oils2 |
13 |
14 |
14 |
12 |
18 |
|
Fish, meat and poultry |
133 |
154 |
157 |
147 |
185 |
|
Fish and products |
102 |
113 |
111 |
99 |
104 |
|
Meat and products |
23 |
32 |
37 |
34 |
61 |
|
Poultry |
7 |
10 |
9 |
14 |
20 |
|
Eggs |
8 |
9 |
10 |
12 |
13 |
|
Milk and milk products |
42 |
44 |
43 |
44 |
49 |
|
Whole milk |
|
|
|
35 |
35 |
|
Milk products |
|
|
|
9 |
14 |
|
Dried beans, nuts and seeds3 |
8 |
10 |
10 |
10 |
10 |
|
Vegetables |
145 |
130 |
111 |
106 |
111 |
|
Green leafy, yellow vegetables |
34 |
37 |
29 |
30 |
31 |
|
Other vegetables |
111 |
93 |
82 |
76 |
80 |
|
Fruits |
104 |
102 |
107 |
77 |
54 |
|
Vitamin C-rich foods |
30 |
18 |
24 |
21 |
12 |
|
Other fruits |
74 |
84 |
83 |
56 |
42 |
|
Miscellaneous |
21 |
32 |
26 |
19 |
39 |
|
Beverages4 |
|
|
|
|
26 |
|
Condiments |
|
|
|
|
13 |
|
Total (g/day) |
897 |
915 |
869 |
803 |
886 |
Sample sizes: 1978, 2 800; 1982, 2 280; 1987, 3 200; 1993, 4
050; 2003, 5 514.
1 Includes soft drinks (sugar content), sherbet
and similar preparations.
2 Includes grated coconut and coconut
milk (fat).
3 Includes mung beans, soybeans, peanuts and other
dried beans, nuts.
4 Includes coffee, tuba (local wine), alcoholic
beverages and others.
Numbers may not add up to totals owing to rounding
off.
Sources: NNS, 1978; 1982; 1987; 1993; 2003.
Among the cereals, the intake of rice and its products has generally not changed; the mean per capita intake fluctuated from 282 g in 1993 - the lowest recorded intake in the 25-year period - to between 303 and 308 g during the other survey years, including 2003. The consumption of maize, which is more common as a staple in combination with rice in Central and Southern Philippines, particularly in rural areas, generally declined, except in 1993. The intake of starchy roots and tubers was half as much in 2003 (19 g/day) as in 1978 (37 g/day), reflecting the diminishing consumption of traditional and ethnic foods, such as snacks made from locally available yams and tubers.
FIGURE 4
Trends in per capita food intake (grams) by
food group, 1978 to 2003
|
|
Sample sizes: 1978, 2 800; 1982, 2 280; 1987, 3 200; 1993, 4
050; 2003, 5 514.
Sources: NNS, 1978; 1982; 1987; 1993;
2003.
The consumption of other cereals and cereal products, which include breads and bakery products, noodles and snack foods made from wheat flour, peaked at 30 g in 2003 - an increase of 36 percent on the 22 g of 1993. The intake of sugars and syrups, including soft drinks, increased. The consumption of soft drinks increased by 150 percent, from 2 g in 1993 to 5 g in 2003.
Other food groups for which major increases in mean per capita intake between 1993 and 2003 were recorded include fats and oils (50 percent higher in 2003), meat and meat products (79 percent higher), poultry (43 percent higher), milk and milk products (11 percent higher) and miscellaneous food items (105 percent higher). With regard to meat and meat products, in 2003 the intake of pork (32 g) - whether fresh meat or popular processed meat products (e.g., hotdogs, meatloaf, sausages) and cooked foods - was greater than that of fresh beef (5 g) or organ meats (6 g). In 2003, processed meat products represented nearly 30 percent of meat intake. Among the miscellaneous food items, 33 percent (13 g) of the per capita daily intake in 2003 comprised alcoholic beverages. It will be important to track the trends in consumption of these foods and beverages over time, as excessive consumption of processed meat products (which contain more sodium and preservatives than fresh products) and alcoholic beverages may contribute to the incidence of hypertension and related NCDs.
TABLE 5
Comparison of fresh and processed meat intakes
(g/day), 2003
|
Food group/sub-group |
g/day |
|
Fresh meat |
38 |
|
Pork |
32 |
|
Beef |
5 |
|
Carabeef |
N |
|
Other fresh meat |
1 |
|
Organ meat |
6 |
|
Pig |
2 |
|
Cow |
1 |
|
Carabao |
N |
|
Chicken and other poultry |
1 |
|
Other organ meats |
N |
|
Organ meat recipes |
2 |
|
Liver spread |
N |
|
Processed meat |
18 |
|
Popular processed meat |
15 |
|
Canned |
1 |
|
Cooked mixed recipes |
2 |
Consumption of vegetables and fruits declined, as did their percentage contribution to total food intake. The intake of fruits, both vitamin C-rich and other, hit a low of 54 g in 2003, a decrease of 50 g since 1978 after a steady 30 percent reduction during the periods 1987 to 1993 and 1993 to 2003. Among vegetables, the intake of green leafy and yellow vegetables has remained the same since 1987, while that of other vegetables has increased - albeit by only 4 g - in the past decade.
Trends in per capita food consumption (in kilocalories) by food group
Rice and rice products continue to be the major source of dietary energy, but their contribution to total per capita dietary energy intake has declined, particularly in the last 13 years (Table 6). Between 1978 and 1987, this group provided 1 050 to 1 022 kcal per capita/day (58 to 56 percent of total per capita dietary energy intake), decreasing to 1 006 kcal (53 percent of total intake) in 2003. The contribution of other traditional staples such as maize and starchy roots and tubers also declined between 1978 and 2003: maize from 137 to 98 kcal per capita/day, and starchy roots and tubers from 40 to 23 kcal. These two food groups fell from providing 10 percent of total dietary energy in 1978 to providing 6 percent in 2003. Other cereals and cereal products, meat and meat products, poultry, fats and oils, sugars and syrups, and miscellaneous food items, including beverages, have been increasing. The contribution of other cereals and cereal products to dietary energy increased from 4 to 10 percent (or 3 to 6 kcal/g), while that of fish, meats and poultry rose from 8 to 12 percent (or 1.00 to 1.24 kcal/g).
In 1978, the energy intake from milk and milk products (94 kcal) was more than three times that of later surveys, even though the quantity of milk and milk products remained very similar (Table 4). Sweetened condensed milk was more frequently consumed in 1978 than in succeeding periods. The energy value of sweetened condensed milk is 321 kcal/100 g compared with 60 kcal/100 g for whole milk and 35 kcal/100 g for skim milk (USDA, no date).
TABLE 6
Trends in per capita dietary energy intake
(kcal) by food group and sub-group, 1978 to 2003
| |
Consumption (kcal) |
||||
|
Food group/sub-group |
1978 |
1982 |
1987 |
1993 |
2003 |
|
Cereals and cereal products |
|
1 262 |
1 213 |
1 196 |
1 286 |
|
Rice and products |
1 050 |
1 032 |
1 022 |
950 |
1 006 |
|
Maize and products |
137 |
130 |
82 |
114 |
99 |
|
Other cereals and products |
70 |
99 |
109 |
131 |
181 |
|
Starchy roots and tubers |
40 |
42 |
23 |
17 |
23 |
|
Sugars and syrups1 |
67 |
81 |
84 |
71 |
84 |
|
Fats and oils2 |
88 |
112 |
110 |
99 |
112 |
|
Fish, meat and poultry |
135 |
155 |
166 |
160 |
229 |
|
Fish and products |
68 |
65 |
70 |
62 |
65 |
|
Meat and products |
58 |
78 |
86 |
82 |
141 |
|
Poultry |
9 |
11 |
11 |
17 |
23 |
|
Eggs |
11 |
13 |
14 |
17 |
19 |
|
Milk and milk products |
94 |
27 |
23 |
24 |
27 |
|
Whole milk |
|
|
|
22 |
23 |
|
Milk products |
|
|
|
2 |
4 |
|
Dried beans, nuts and seeds3 |
20 |
24 |
23 |
22 |
21 |
|
Vegetables |
34 |
29 |
|
25 |
32 |
|
Green leafy, yellow vegetables |
9 |
9 |
7 |
7 |
10 |
|
Other vegetables |
25 |
20 |
60a |
18 |
23 |
|
Fruits |
45 |
42 |
|
35 |
30 |
|
Vitamin C-rich foods |
14 |
11 |
12 |
8 |
4 |
|
Other fruits |
31 |
31 |
|
29 |
27 |
|
Miscellaneous |
11 |
18 |
18 |
18 |
42 |
|
Beverages4 |
|
|
|
|
30 |
|
Condiments |
|
|
|
|
8 |
|
Others |
|
|
|
|
4 |
|
Total (kcal) |
1 804 |
1 808 |
1 753 |
1 684 |
1 905 |
Sample sizes: 1978, 2 800; 1982, 2 280; 1987, 3 200; 1993, 4 050; 2003, 5 514.
1 Includes soft drinks (sugar content), sherbet and similar preparations.
2 Includes grated coconut and coconut milk (fat).
3 Includes mung beans, soybeans, peanuts and other dried beans, nuts.
4 Includes coffee, tuba (local wine), alcoholic beverages and others.
a Includes other fruits and other vegetables
Numbers may not add up to totals owing to rounding off.
Sources: NNS, 1978; 1982; 1987; 1993; 2003.
Trends in nutrient adequacy
Based on absolute intakes, the mean per capita intakes of energy, protein, vitamin A, calcium, thiamine, riboflavin and niacin increased in 2003 from the levels in 1993 and earlier years. Intakes for most other nutrients, however, remained inadequate, particularly those for iron, calcium, riboflavin and vitamin C, all of which were less than 80 percent of the recommended levels - an indication that these nutrients are probably inadequately provided for by the average food consumption pattern in Philippine households (see reference RENIs for 2002 in Annex 3).
TABLE 7
Trends in per capita energy and nutrient intakes
and percentage adequacy based on Philippine RDAs and RENIs, 1978 to
2003
|
Nutrients |
19781 |
19821 |
19871 |
19932 |
20033 |
|
Energy |
|
|
|
|
|
|
Intake (kcal) |
1 804 |
1 808 |
1 753 |
1 684 |
1 905 |
|
% adequacy |
88.6 |
89.0 |
87.1 |
87.8 |
98.3 |
|
Protein |
|
|
|
|
|
|
Intake (g) |
53.0 |
50.6 |
49.7 |
49.9 |
56.2 |
|
% adequacy |
102.9 |
99.6 |
98.2 |
106.2 |
99.2 |
|
Iron |
|
|
|
|
|
|
Intake (mg) |
11.0 |
10.8 |
10.7 |
10.1 |
10.1 |
|
% adequacy |
91.7 |
91.5 |
91.5 |
64.7 |
60.1 |
|
Vitamin A |
|
|
|
|
|
|
Intake (ug RE) |
- |
- |
389.7 |
391.9 |
455.2 |
|
% adequacy |
- |
- |
75.9 |
88.1 |
91.4 |
|
Calcium |
|
|
|
|
|
|
Intake (g) |
0.44 |
0.45 |
0.42 |
0.39 |
0.44 |
|
% adequacy |
|
80.4 |
75.0 |
67.0 |
57.1 |
|
Thiamine |
|
|
|
|
|
|
Intake (mg) |
0.73 |
0.74 |
0.68 |
0.67 |
0.88 |
|
% adequacy |
|
71.8 |
66.7 |
68.4 |
86.3 |
|
Riboflavin |
|
|
|
|
|
|
Intake (mg) |
0.53 |
0.58 |
0.56 |
0.56 |
0.73 |
|
% adequacy |
|
56.3 |
54.4 |
57.1 |
68.0 |
|
Niacin |
|
|
|
|
|
|
Intake (mg) |
15.3 |
16.4 |
16.3 |
16.1 |
20.6 |
|
% adequacy |
|
119.7 |
119.9 |
68.0 |
156.4 |
|
Ascorbic acid |
|
|
|
|
|
|
Intake (mg) |
66.8 |
61.6 |
53.6 |
46.7 |
46.5 |
|
% adequacy |
|
91.1 |
80.0 |
73.2 |
75.0 |
|
Fats |
|
|
|
|
|
|
Intake (g) |
|
30 |
30 |
29 |
38 |
|
Carbohydrates |
|
|
|
|
|
|
Intake (g) |
|
327 |
313 |
310 |
333 |
Sample sizes: 1978, 2 800; 1982, 2 280; 1987, 3 200; 1993, 4
050; 2003, 5 514.
1 1976 RDA for Philippines (Annex 1).
2
1989 RDA for Philippines (Annex 2).
3 2002 RENI for
Philippines (Annex 3).
Sources: NNS, 1978; 1982; 1987; 1993;
2003.
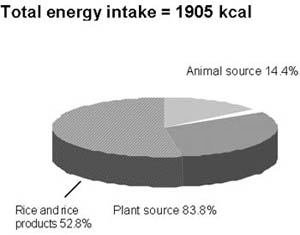
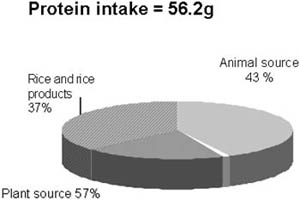
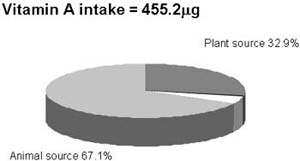
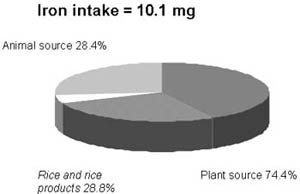
The contributions of animal and plant food sources to total energy, protein, vitamin A and iron intakes are shown in Figure 5. Plant foods, particularly cereals such as rice and rice products, continue to be the major contributors of energy, protein and iron in Philippine diets. Rice and rice products alone contributed 53, 37 and 29 percent, respectively, of total energy, protein and iron intakes in Philippine households.
FIGURE 5
Percentage contributions of animal and plant
foods to total energy, protein, vitamin A and iron intakes, 2003
|
|
|
|
|
|
Sample size: 5 514.
Source: NNS, 2003.
The declining intake of vitamin C over the years may be explained by the generally declining intake of vitamin C-rich fruits. There was also no increase in iron intake in 2003, in spite of the reported increased intake of meat, because most of this increase was in the form of pork, which in general has lower iron content (0.8 mg/100 g) than beef (2.8 mg/100 g). In addition, the revised iron values in the updated Philippine FCT - particularly those affecting about 30 food items, many of which were fresh and processed fish - were generally lower, as reflected in the lower iron contribution from fish in spite of an increased intake in 2003 (Annexes 6 and 7).
The remarkable drop in iron adequacy since 1987, from 91.5 to < 65 percent in 1993 and 2003 in spite of absolute intakes that remained nearly the same throughout the same period, is attributed to the revisions in recommended nutrient intakes already noted. Specifically for iron, differences in estimating the basal or obligatory losses and the requirements for growth among children resulted in higher requirements in the 1989 RDAs and 2002 RENIs compared with those of 1976. There were also notable changes in the niacin and calcium requirements. For niacin, the requirement in the 1976 RDAs and 2002 RENIs was based only on preformed niacin, and therefore lower than that in the 1989 RDA, which included the contribution of tryptophan. This explains the drop in mean per capita niacin adequacy in 1993, even though the absolute intake was virtually the same as in preceding years. With regard to calcium, the requirement was increased in the 2002 RENIs, primarily because of a shift in the paradigm for setting calcium requirements, i.e., a change in objective from that of attaining calcium balance to that of preventing osteoporosis. This also explains the drop in calcium adequacy in 2003, in spite of an increase in calcium intake.
Achievement of population nutrient intake goals
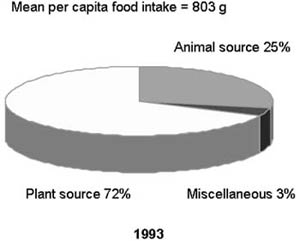
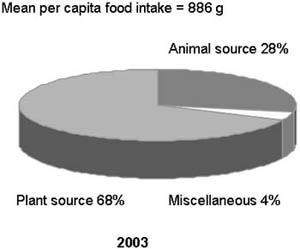
The increased intakes of fats and oils, fish, meats and poultry, and milk and milk products are consistent with the Nutritional Guidelines for the Philippines (Annex 4), which has called for specific improvements to the quality of Philippine diets by including more animal foods (Guideline no. 4), fats and oils (Guideline no. 6) and milk and milk products (Guideline no. 7). Overall, the proportion of animal foods in total food intake has increased - from 20 percent in 1978, to 25 percent in 1993 and to 28 percent in 2003 (Figure 6). These increases may also be attributed to the increasing trend in consumption of fast foods and could signal a detrimental increase in saturated fat and cholesterol, which will be discussed in the following sections.
FIGURE 6
Mean per capita food intake by source, 1993
and 2003.
|
|
|
Sample sizes: 1993, 4 050; 2003, 5 514.
Sources:
NNS, 1993; 2003.
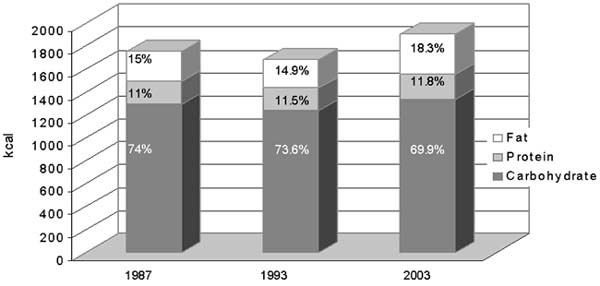
The average contribution of fat to total dietary energy intake increased from 15 to 18 percent, and that of carbohydrate decreased from 74 to 70 percent. The proportion of households with per capita fat consumption or contribution within the WHO/FAO (2003) recommendations of 15 to 30 percent of energy intake increased from 38 percent in 1993 to 46 percent in 2003. The proportion of households with per capita carbohydrate consumption of between 55 and 75 percent of energy intake increased from 53 to 58 percent over the same period.
FIGURE 7
Percentage distribution of per capita dietary
energy from fat, protein and carbohydrates, 1987, 1993 and 2003
|
|
The continuing pattern of decreasing fruit and vegetable consumption is reflected in the declining proportion of households that consume ³ 400 g fruits and vegetables per capita per day, particularly in the last ten years. In 1993, 11.5 percent of Philippine households had a per capita intake of ³ 400 g fruits and vegetables a day; this figure had declined to 8.2 percent in 2003 - a drop of about one-third (Table 8).
TABLE 8
Trends in achievement of population nutrient
intake goals, 1993 and 2003
|
Year |
% of population with 15-30% energy intake from fat |
% of population with < 10% energy intake from free sugars |
% of population with 55-75% energy intake from carbohydrate |
% of population consuming ³ 400 g/day fruits and vegetables |
|
1993 |
37.6 |
94.3 |
53.0 |
11.5 |
|
2003 |
46.2 |
92.1 |
57.9 |
8.2 |
Sample sizes: 1993, 4 050; 2003, 5 514.
Sources:
NNS, 1993; 2003.
The proportion of households with less than 100 percent of mean per capita energy adequacy was 57 percent in 2003, an improvement from 1993’s figure of 74 percent. The Millennium Development Goal (MDG) for hunger calls for halving the proportion of population below the minimum level of dietary energy consumption. Data collected by FAO to measure the proportion of undernourished people show a declining trend in the proportion of the population considered undernourished (FAO, 2003).
Trends in food and nutrient intakes in urban and rural areas
The 1987 and 1993 NNS show urban and rural differences in food (Table 9) and energy and nutrient intakes (Table 10). Generally, in both years, the intakes of cereals and cereal products, particularly rice and maize products, starchy roots and tubers, fish, and vegetables, including green leafy and yellow and other vegetables were higher in rural than in urban areas. Urban households, on the other hand, had higher per capita intakes of other cereals and cereal products (which include breads and bakery products, noodles and snack foods made from wheat flour), sugars and syrups, fats and oils, meat and poultry, eggs, milk and milk products, dried beans, nuts and seeds, and vitamin C-rich fruits. Between 1987 and 1993, the consumption of milk and milk products, in particular, increased in urban areas but decreased in rural ones.
TABLE 9
Trends in per capita food consumption (grams) by
urban and rural residence, 1987 and 1993
|
Food group/sub-group |
Rural |
Urban |
||
| |
1987 |
1993 |
1987 |
1993 |
|
Cereals and cereal products |
361 |
350 |
318 |
318 |
|
Rice and products |
317 |
289 |
281 |
273 |
|
Maize and products |
31 |
55 |
11 |
17 |
|
Other cereals and products |
13 |
16 |
26 |
28 |
|
Starchy roots and tubers |
25 |
21 |
17 |
13 |
|
Sugars and syrups1 |
22 |
17 |
26 |
20 |
|
Fats and oils2 |
12 |
11 |
15 |
14 |
|
Fish, meat and poultry |
145 |
133 |
174 |
161 |
|
Fish and products |
109 |
99 |
112 |
97 |
|
Meat and products |
28 |
23 |
52 |
44 |
|
Poultry |
8 |
9 |
11 |
19 |
|
Eggs |
8 |
9 |
13 |
15 |
|
Milk and milk products |
34 |
24 |
56 |
64 |
|
Whole milk |
30 |
22 |
45 |
48 |
|
Milk products |
4 |
2 |
11 |
16 |
|
Dried beans, nuts and seeds3 |
9 |
8 |
11 |
11 |
|
Vegetables |
104 |
102 |
91 |
86 |
|
Green leafy, yellow vegetables |
32 |
34 |
25 |
25 |
|
Other vegetables |
72 |
68 |
66 |
61 |
|
Fruits |
115 |
84 |
123 |
93 |
|
Vitamin C-rich foods |
31 |
26 |
44 |
39 |
|
Other fruits |
84 |
58 |
79 |
54 |
|
Miscellaneous |
27 |
16 |
24 |
23 |
|
Beverages4 |
13 |
6 |
10 |
11 |
|
Condiments |
11 |
9 |
11 |
9 |
|
Others |
3 |
1 |
3 |
2 |
|
Total (g) |
863 |
786 |
869 |
819 |
Sample sizes: 1987, 3 200; 1993, 4 050.
1
Includes soft drinks (sugar content), sherbet and similar
preparations.
2 Includes grated coconut and coconut milk
(fat).
3 Includes mung beans, soybeans, peanuts and other dried
beans, nuts.
4 Includes coffee, tuba (local wine), alcoholic
beverages and others.
Numbers may not add up to totals owing to rounding
off.
Sources: NNS, 1987; 1993.
The food intake in rural areas has followed the same trend as that in urban areas. As in urban areas, the consumption of rice and rice products, starchy roots and tubers, and fruits decreased in rural areas between 1987 and 1993, while that of other cereals and cereal products increased. Urban patterns of food consumption are reflected significantly in the diets of the rural population for various reasons, including the influence of urban migrants on the families they leave behind, improved transport and communications between urban and rural areas, and the increasing availability of processed foods in rural markets. It should be noted that reduced intakes were reported for nearly all of the food groups in terms of weight and total dietary energy intake, in both urban and rural areas between 1987 and 1993; this is shown in the national data in Table 4.
In terms of adequacy of energy and nutrients in the diet, urban and rural households did not differ. In 1993, both had inadequate intakes of energy and nutrients, except protein in urban and rural areas and vitamin A in urban areas only. Per capita vitamin A intake was more than 100 percent adequate in urban households, but only 74 percent in rural ones.
TABLE 10
Trends in per capita nutrient intakes and
percentage adequacy, by urban and rural residence, 1987 and 1993
|
Nutrients |
Rural |
Urban |
||
| |
19871 |
19932 |
19871 |
19932 |
|
Energy |
|
|
|
|
|
Intake (kcal) |
1 748 |
1 696 |
1 761 |
1 673 |
|
% adequacy |
87.2 |
88.6 |
86.9 |
87.0 |
|
Protein |
|
|
|
|
|
Intake (g) |
49.1 |
49.1 |
50.7 |
50.8 |
|
% adequacy |
97.6 |
104.9 |
99.0 |
107.6 |
|
Iron |
|
|
|
|
|
Intake (mg) |
10.5 |
9.9 |
10.9 |
10.2 |
|
% adequacy |
91.3 |
64.3 |
91.6 |
64.6 |
|
Vitamin A |
|
|
|
|
|
Intake (ug RE) |
357.5 |
327.9 |
440.4 |
457.0 |
|
% adequacy |
70.3 |
73.8 |
84.9 |
102.7 |
|
Calcium |
|
|
|
|
|
Intake (g) |
0.43 |
0.39 |
0.42 |
0.39 |
|
% adequacy |
76.8 |
66.1 |
76.4 |
67.2 |
|
Thiamine |
|
|
|
|
|
Intake (mg) |
0.65 |
0.65 |
0.73 |
0.70 |
|
% adequacy |
63.7 |
66.3 |
70.9 |
71.4 |
|
Riboflavin |
|
|
|
|
|
Intake (mg) |
0.52 |
0.51 |
0.62 |
0.61 |
|
% adequacy |
51.0 |
52.0 |
60.2 |
61.6 |
|
Niacin |
|
|
|
|
|
Intake (mg) |
16.1 |
15.8 |
16.6 |
16.5 |
|
% adequacy |
118.4 |
86.3 |
121.2 |
89.7 |
|
Ascorbic acid |
|
|
|
|
|
Intake (mg) |
54.7 |
48.7 |
51.8 |
44.6 |
|
% adequacy |
82.0 |
76.6 |
76.5 |
69.7 |
Sample sizes: 1987, 3 200; 1993, 4 050.
1 1976
RDA for Philippines (Annex 1).
2 1989 RDA for Philippines (Annex
2).
Sources: NNS, 1987; 1993.
Urban and rural differences are also noted with regard to the contributions of fat, protein and carbohydrate to total dietary energy supply (Table 11). Generally, the contribution of fats to total dietary energy has been higher in urban (about 18 percent in 1987 and 1993) than in rural (13 percent) households, while the latter consume more carbohydrates (75 to 76 percent versus 70 percent of dietary energy).
TABLE 11
Trends in percentage proportions of per capita
dietary energy from fat, protein and carbohydrates, by urban and rural
residence, 1987 and 1993
| |
Total dietary energy intake (kcal) |
% dietary energy from fat |
% dietary energy from protein |
% dietary energy from carbohydrates |
||||
| |
1987 |
1993 |
1987 |
1993 |
1987 |
1993 |
1987 |
1993 |
|
Urban |
1 761 |
1 673 |
18.4 |
18 |
11.3 |
12.3 |
70.2 |
69.7 |
|
Rural |
1 748 |
1 696 |
13.0 |
12.9 |
10.8 |
11.7 |
76.2 |
75.4 |
Sample sizes: 1987, 3 200; 1993, 4 050.
Sources:
NNS, 1987; 1993.
The urban-rural disaggregation of the 2003 NNS data is not yet available, but regionally disaggregated data on food intake (Annex 8) support the urban-rural differences in diet patterns that were noted from the earlier surveys. In very urban areas such as Metro Manila, the consumption of other cereals and cereal products, fats and oils, meats and meat products, and milk and milk products continues to be higher, while that of vegetables is lower than in other regions with varying extents of urbanization. Apart from Metro Manila, the regions with the highest proportion of urban population (specifically, Central Luzon and Calabarzon, which are at least 60 percent urban) have higher consumption of other cereals and cereal products, meats and meat products, eggs, and milk and milk products than the least urbanized regions (Cagayan Valley and Eastern Visayas, which are only 19 to 22 percent urban). Central Luzon and Calabarzon have lower intakes of starchy roots and tubers and vegetables than most of the other less urbanized regions.
Dietary changes in the Philippines in the past 25 years have followed much the same pattern as those described in the nutrition transition literature of, for example, Shetty and Gopalan (1998) and Popkin (1994). The Philippine diet has become more energy-dense, with a greater proportion of energy from fat. Important changes in the types of food in the diet include:
increasing intake of other cereals and cereal products, including breads and other bakery products and different forms of noodles and pasta;
increasing intakes of sugars and syrups, fats and oils, and animal food sources such as meat, poultry, eggs and dairy products;
decreasing intakes of fruit, vegetables, and starchy roots and tubers.
There are noticeable differences between the consumption patterns of urban and rural groups. In particular, urban residents are showing a strong trend towards consumption of non-traditional staples and animal source foods, accompanied by a declining intake of fruits and vegetables.
In general, the overall adequacy of the Philippine diet has improved, as illustrated by the increasing adequacy of energy and most micronutrients. There are, however, some declining trends in adequate intakes of iron and vitamin C. The latter is most probably associated with a steep drop in consumption of vitamin C-rich fruits, while the decline in iron intake is more difficult to understand, but most likely involves a combination of increasing requirements from the updated Philippine RENIs and decreasing amounts of iron considered to be bioavailable.
Food and nutrient intake of preschool-age children
Infant and young child feeding practices in the Philippines have been shown to be inadequate. The prevalence of breastfeeding was 87 to 89 percent between 1993 and 2003 (Philippines National Demographic and Health Survey, 2003; NNS, 2003), but the mean duration of breastfeeding in 2003 was only 5.6 months (NNS, 2003). In the same year, the prevalence of exclusive breastfeeding was only 41.7 percent among infants under two months of age, and 33.4 percent among those aged two to three months; at four to five months of age, only 11.5 percent of infants were still exclusively breastfed (NNS, 2003).
There is a dearth of published national data on the food intake of Philippine preschool children. Unpublished reports on the food intake of non-breastfeeding preschool-age children from the 1978, 1982, 1993 and 2003 NNS imply that the food intake of preschool children in general has been inadequate in energy and the essential nutrients, except protein. Although, rice, milk and milk products, fish, meat and poultry, and fruits have been the major contributors to preschool children’s dietary patterns, intakes have apparently been inadequate to meet those recommended for several essential nutrients, particularly iron, vitamin A and calcium. The consequences of inadequate food and nutrient intakes among children are reflected in their poor nutritional status, which is described in the following sections.
TABLE 12
Trends in mean per capita food consumption
(grams) in preschool-age children, 1978 to 2003
|
Food group/sub-group |
1978a |
1982a |
1993 b |
2003c |
|
|
Cereals and cereal products |
- |
- |
163 |
166 |
|
|
Rice and products |
88 |
101 |
121 |
122 |
|
|
Maize and products |
- |
- |
15 |
17 |
|
|
Other cereals and products |
- |
- |
27 |
27 |
|
|
Fats and oils1 |
n |
5 |
2 |
6 |
|
|
Fish, meat and poultry |
71 |
82 |
85 |
95 |
|
|
Eggs |
7 |
8 |
8 |
8 |
|
|
Milk and milk products |
88 |
109 |
111 |
179 |
|
|
Vegetables |
28 |
29 |
22 |
23 |
|
|
Fruits |
77 |
72 |
70 |
31 |
|
|
Other food groups |
1035 |
905 |
|
|
|
| |
Starchy roots and tubers |
- |
- |
11 |
8 |
| |
Dried beans, nuts and seeds2 |
- |
- |
6 |
4 |
| |
Sugars and syrups3 |
- |
- |
12 |
15 |
| |
Miscellaneous4 |
- |
- |
10 |
27 |
|
Total intake (g) |
462 |
496 |
500 |
506 |
|
Sample sizes: 1978, 2 800; 1982, 2 280; 1993, 4 050.
1 Includes grated coconut and coconut milk (fat).
2 Includes mung beans, soybeans, peanuts and other dried beans, nuts.
3 Includes soft drinks (sugar content), sherbet and similar preparations.
4 Includes beverages, condiments and others.
5 Includes maize and maize products, other cereals, starchy roots
and tubers, dried beans, nuts and seeds, sugars, and miscellaneous (beverages,
condiments and others).
a Six months to four years of age.
b Three to 59 months of age (unpublished).
c Six months to five years of age.
- = less than 0.5 g.
Numbers may not add up to totals owing to rounding off.
Sources: NNS, 1978; 1982; 1993.
TABLE 13
Trends in mean per capita energy and nutrient
intakes and percentage adequacy in preschool-age children, 1978 to
1993
|
Nutrient |
19781a |
19821a |
19932b |
20033c |
|
Energy |
|
|
|
|
|
Intake (kcal) |
742 |
873 |
887 |
980 |
|
% adequacy |
53.8 |
63.3 |
68.0 |
83.0 |
|
Protein |
|
|
|
|
|
Intake (g) |
23.8 |
27.3 |
28.8 |
31.5 |
|
% adequacy |
87.2 |
100 |
105.9 |
102.8 |
|
Iron |
|
|
|
|
|
Intake (mg) |
4.5 |
5.4 |
6.0 |
6.2 |
|
% adequacy |
67.2 |
80.6 |
63.6 |
72.7 |
|
Vitamin A |
|
|
|
|
|
Intake (ug RE) |
- |
- |
234.3 |
315.9 |
|
% adequacy |
- |
- |
66.3 |
79.0 |
|
Calcium |
|
|
|
|
|
Intake (g) |
0.28 |
0.29 |
0.27 |
0.37 |
|
% adequacy |
|
58.0 |
47.6 |
73.4 |
|
Thiamine |
|
|
|
|
|
Intake (mg) |
0.43 |
0.47 |
0.43 |
0.65 |
|
% adequacy |
|
65.3 |
63.0 |
123.2 |
|
Riboflavin |
|
|
|
|
|
Intake (mg) |
0.41 |
0.44 |
0.41 |
0.74 |
|
% adequacy |
|
61.1 |
61.8 |
142.3 |
|
Niacin |
|
|
|
|
|
Intake (mg) |
6.4 |
8.2 |
8.6 |
10.4 |
|
% adequacy |
|
87.2 |
66.6 |
163.8 |
|
Ascorbic acid |
|
|
|
|
|
Intake (mg) |
29.4 |
28.9 |
25.0 |
31.7 |
|
% adequacy |
|
77.1 |
68.5 |
105.5 |
Sample sizes: 1978, 2 800; 1982, 2 280; 1993, 4 050; 2003, 5
514.
1 1976 RDA for Philippines (Annex 1).
2 1989
RDA for Philippines (Annex 2).
3 2002 RENI for Philippines (Annex
3).
a Six months to four years of age,
non-breastfeeding.
b Three to 59 months of age,
non-breastfeeding.
c Six months to five years of age,
non-breastfeeding.
Sources: NNS, 1978; 1982; 1993; 2003.
Data on the nutritional status of the Philippine population come from the NNS rounds in 1993, 1998 and 2003 and the Regional Updating of the Nutritional Status of Children in 1989/1990, 1992, 1996 and 2001.
Trends in the nutritional status of children aged 0 to ten years
Undernutrition among children continues to be a public health problem. In 2003, underweight and stunting still affected three out of every ten children aged 0 to 5.9 years (Figure 8) and six to 10.9 years (Figure 9). According to 2003 population projections based on 2000 census data from the National Statistics Office, there are 3.2 million underweight children aged 0 to 5.9 years, and 2.4 million aged six to 10.9 years; for stunting the respective figures are 3.4 million and 3.3 million.
However, there was declining prevalence of undernutrition - underweight and stunting - in both age groups between 1989/1990 and 2003. Within this period, the proportion of underweight children aged 0 to five years declined by 7.6 percentage points, from 34.5 to 26.9 percent (an average reduction of 0.58 percentage points a year); among six- to ten-year-old children, the prevalence of underweight dropped by 8.6 percentage points, from 34.2 to 25.6 percent (an average 0.66 percentage points a year). Stunting among 0- to five- and six- to ten-year-old children also declined by 10.0 (0.77 a year) and 9.0 (0.69 a year) percentage points, respectively. Meanwhile, the prevalence of acute malnutrition (wasting) among children aged 0 to five years has not improved, and increased from 5.0 percent in 1989/1990 to 5.3 percent in 2003.
FIGURE 8
Trends in the prevalence of malnutrition
among children aged 0 to 5.9 years, 1989/1990 to 2003
|
|
Sample sizes: 1989/1990, 8 008; 1992, 7 243; 1993, 24 000 household members; 1996, 10 385; 1998, 28 698; 2001, 10 634; 2003, 4 110.
References: International Reference Standard/NCHS Growth Reference: underweight = weight-for-age < -2SD; wasting = weight-for-height < -2SD; stunting = height-for-age < -2SD; overweight-for-age = weight-for-age > 2SD.
Sources: NNS, 1993; 1998; 2003; Regional Updating of the Nutritional Status of Children, 1989/1990; 1992; 1996; 2001.
FIGURE 9
Trends in the prevalence of malnutrition
among children aged six to 10.9 years, 1989/1990 to 2003
|
|
Sample sizes: 1989/1990, 4 306; 1993, 5 636; 1993, 24 000 household members; 1996, 15 530; 1998, 3 040; 2001, 1 791; 2003, 3 436.
References: International Reference Standard/NCHS Growth Reference: underweight = weight-for-age < -2SD; wasting = weight-for-height < -2SD; stunting = height-for-age < -2SD; overweight-for-age = weight-for-age > 2SD.
Sources: NNS, 1993; 1998; 2003; Regional Updating of the Nutritional Status of Children, 1989/1990; 1992; 1996; 2001.
The average annual percentage reduction of 0.58 percent is not sufficient to meet the MDG target of reducing the proportion of underweight-for-age children under five years of age to 17.25 percent by 2015. There are geographical (regional) disparities in the nutritional status of children, and measures to reduce the prevalence of undernutrition will have to be strengthened in the regions where the problem is greatest. The proportions of underweight-for-age children are higher in the Administrative Region of Muslim Mindanao (34 percent) - one of the poorest in the country - and Mimaropa region (34.2 percent) in Southern Luzon than in Metro Manila (17.8 percent), Central Luzon (21.7 percent) and the Cordillera Administrative Region (16.3 percent).
Meanwhile, although overweight-for-age affects smaller proportions of children (1.4 and 1.3 percent, respectively, in the 0 to 5.9 years and the six to 10.9 years age groups), it has increased significantly between 1998 and 2003. The prevalence of overweight among both age groups in 1989/1990 and 1998 was unchanged, but in 2003 it had increased nearly threefold among children aged 0 to 5.9 years and more than tenfold among those aged six to 10.9 years compared with 1998 levels.
Trends in the nutritional status of 11- to 19-year-olds
In 2003, the proportion of underweight among adolescents aged 11 to 12 years was nearly the same as that among children up to ten years of age - about three out of ten (25.9 percent). Underweight among those aged 11 to 19 years decreased between 1993 and 2003 for both males and females, but the decrease among females was twice that among males, particularly after 1998. On the other hand, overweight increased, affecting 4.2 percent of 11- to 12-year-olds, and 3.4 percent of 13- to 19-year-olds in the same year. The prevalence of overweight among these groups has increased steadily, with larger percentage increases among females than males.
TABLE 14
Trends in the prevalence of underweight and
overweight among 11- to 19-year-olds
|
Gender/age group |
Underweight |
Overweight |
||||
| |
1993 |
1998 |
2003 |
1993 |
1998 |
2003 |
| |
% prevalence |
|||||
|
Male |
|
|
|
|
|
|
|
11-12 years |
32.1 |
37.3 |
31.0 |
2.6 |
1.8 |
4.9 |
|
13-19 years |
28.8 |
31.8 |
17.0 |
2.5 |
1.0 |
2.9 |
|
All males |
29.8 |
33.1 |
20.5 |
2.6 |
1.2 |
3.4 |
|
Female |
|
|
|
|
|
|
|
11-12 years |
36.3 |
36.5 |
20.6 |
1.5 |
3.2 |
3.4 |
|
13-19 years |
29.7 |
32.0 |
6.4 |
2.5 |
5.2 |
3.9 |
|
All females |
30.7 |
33.1 |
10.1 |
2.2 |
4.7 |
3.8 |
|
Male and female |
|
|
|
|
|
|
|
11-12 years |
34.0 |
37.0 |
25.9 |
2.2 |
2.5 |
4.2 |
|
13-19 years |
28.7 |
31.9 |
12.0 |
2.5 |
3.1 |
3.4 |
|
All adolescents |
30.2 |
33.1 |
15.5 |
2.4 |
2.9 |
3.6 |
Sample sizes: 1993, 24 000 household members; 1998, 6 079; 2003, 4 860.
References (Must, Dallal and Dietz, 1991): underweight = < 5 percentile of
BMI-for-age; overweight = > 85 percentile of BMI-for-age.
Sources: NNS, 1993; 1998; 2003.
Trends in the nutritional status of adults
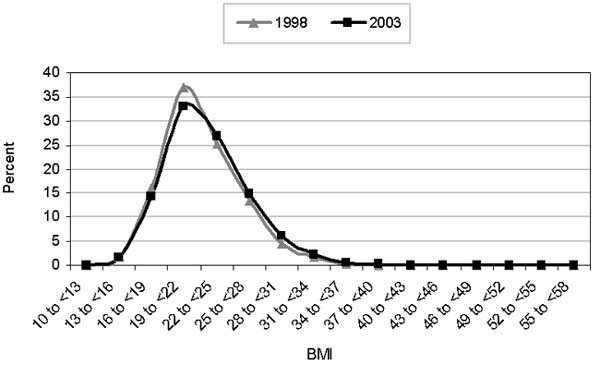
In 2003, 12.3 percent of adults were affected by undernutrition (BMI < 18.5). Based on the WHO cut-off for a healthy adult population in which only 3 to 5 percent have BMI below 18.5 (WHO, 1995), adult undernutrition in the Philippines is a problem that needs to be addressed. On the other hand, 24 percent of adults are overweight or obese, with more females (27.3 percent) than males (20.9 percent) affected (overweight = BMI of 25 to < 30; obese = BMI ³ 30). Although progress in reducing underweight has been slow (about 10 percent over ten years), prevalence of BMI > 25 has been increasing steadily by 20 percent in each five-year interval from 1993 to 2003. The BMI distribution of the population has shifted slightly to the right over the past five years (Figure 10).
TABLE 15
Prevalence of underweight and overweight among
adults, 1993 to 2003
| |
Underweight |
Overweight/obese |
||||
|
Gender/age group |
1993 |
1998 |
2003 |
1993 |
1998 |
2003 |
| |
% Prevalence |
|||||
|
Male |
11.5 |
11.1 |
10.6 |
14.4 |
17.0 |
20.9 |
|
Female |
16.1 |
15.4 |
14.2 |
18.6 |
23.3 |
27.3 |
|
Male and female |
|
|
|
|
|
|
|
20-39 years |
11.0 |
11.2 |
10.6 |
14.4 |
18.5 |
20.6 |
|
40-59 years |
14.5 |
12.0 |
10.4 |
23.2 |
25.3 |
30.8 |
|
60 years and over |
29.1 |
25.4 |
23.4 |
11.4 |
14.6 |
19.1 |
|
All |
13.9 |
13.2 |
12.3 |
16.6 |
20.2 |
24.0 |
Sample sizes: 1993, 24 000 household members; 1998, 9 299; 2003, 11 696.
References: Underweight/chronic energy deficiency (CED) = BMI < 18.5; overweight/obese
= BMI ³ 25.
Sources: NNS, 1993; 1998; 2003.
FIGURE 10
Changes in distribution of adult BMI, 1998
to 2003
|
|
Using the BMI cut-off points recommended by the WHO expert consultation to determine public health and clinical action in relation to cardiovascular disease (CVD) (i.e., BMI 23 to 27.4 = moderate risk; BMI ³ 27.5 = high to very high risk), the proportion of Philippine adults with moderate to very high risk of co-morbidities related to CVD reaches even more significant proportions than even the overweight or obesity figures imply (Table 16).
TABLE 16
Distribution of adults by cut-off points for
determining risk of co-morbidities of CVD based on BMI
|
Age group (years) |
CED (< 18.5) |
Low risk (18.5 to < 23.0) |
Moderate risk (23.0 to £ 27.4) |
High risk (³ 27.5) |
|
20-39 |
10.6 |
53.0 |
27.4 |
9.0 |
|
40-59 |
10.4 |
40.6 |
34.8 |
14.1 |
|
60 and over |
23.6 |
43.7 |
24.2 |
8.5 |
|
All |
12.4 |
47.4 |
29.5 |
10.7 |
Sample size: 2003, 11 696.
Reference (WHO Expert Consultation, 2004): CED = BMI < 18.5; low risk = BMI 18.5 to < 23.0; moderate risk = BMI 23.0 to £ 27.4; high risk = BMI ³ 27.5.
Source: NNS, 2003.
The problem of overnutrition among adults is further highlighted when waist-to-hip ratio (WHR) and waist circumference (WC) are used. WC reflects intra-abdominal fat mass, while WHR is an index of abdominal fat distribution. Both are indicators of android obesity, which is a risk factor for CVD. The 2003 statistics reflect an overnutrition problem of public health concern, especially among female adults (Tables 17 and 18). Using WHR, android obesity affects one in every two women (54.8 percent) 20 years of age and over; this figure is 38.7 percent higher than the 1998 level. Using WC, android obesity in women increased even more rapidly, by 70 percent (from 10.7 to 18.3 percent) between 1998 and 2003.
TABLE 17
Trends in prevalence of high WHR among adults,
1998 and 2003
|
Gender |
Age group (years) |
1998 |
2003 |
|
% prevalence
|
|||
|
Male |
20-29 |
3.0 |
6.0 |
| |
30-39 |
|
11.7 |
| |
40-49 |
12.8 |
15.1 |
| |
50-59 |
|
18.8 |
| |
60-69 |
6.8 |
20.8 |
| |
70 + |
|
13.7 |
| |
All |
7.9 |
12.1 |
|
Female |
20-29 |
36.3 |
38.7 |
| |
30-39 |
|
49.6 |
| |
40-49 |
45.8 |
66.2 |
| |
50-59 |
|
70.0 |
| |
60-69 |
38.6 |
64.4 |
| |
70 + |
|
62.0 |
| |
All |
39.5 |
54.8 |
Sample sizes: 1998, 9 299; 2003, 4 753.
Reference: male,
WHR ³ 1.0; female, WHR ³ 0.85.
Sources: NNS, 1998; 2003.
TABLE 18
Trends in the prevalence of high WC
among adults, 1998 and 2003
|
Gender |
Age group (years) |
1998 |
2003 |
|
% prevalence
|
|||
|
Male |
20-29 |
1.7 |
2.1 |
| |
30-39 |
|
2.7 |
| |
40-49 |
5.1 |
4.5 |
| |
50-59 |
|
4.9 |
| |
60-69 |
1.8 |
3.3 |
| |
70 + |
|
1.0 |
| |
All |
2.7 |
3.1 |
|
Female |
20-29 |
10.0 |
10.2 |
| |
30-39 |
|
10.7 |
| |
40-49 |
11.7 |
23.8 |
| |
50-59 |
|
34.8 |
| |
60-69 |
11.5 |
22.9 |
| |
70 + |
|
21.5 |
| |
All |
10.7 |
18.3 |
Sample sizes: 1998, 9 299; 2003, 4 753.
Reference: male, WC
³ 102 cm; female, WC ³ 88 cm.
Sources: NNS, 1998; 2003.
Micronutrient status of population groups
Trends in iron deficiency
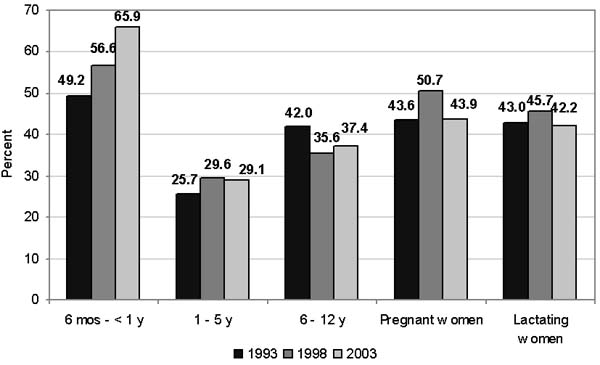
Anaemia among infants aged six months to less than one year increased alarmingly from 49.2 percent in 1993 to 66 percent in 2003. Although anaemia was not of public health magnitude among children aged one to five years when aggregated as a group, 53 percent of children aged 12 to 23 months were found to be anaemic in 2003. Pregnant women and lactating mothers also had anaemia prevalence that was higher than the public health cut-off of 40 percent, a situation that did not change in the ten years from 1993 to 2003.
The unabated problem of anaemia among young children and pregnant and lactating women is partly attributed to continuing inadequate iron intakes. Low birth weight also contributes to the risk of anaemia during early childhood, because low-birth-weight infants are born with low iron stores, which consequently become depleted early. Philippine data in the State of the world’s children (UNICEF, 2003) placed the prevalence of low birth weight over the period 1998 to 2003 at 20 percent. Among pregnant and lactating women, dietary iron intakes are very low - 28.8 and 33.4 percent, respectively, of those recommended (NNS, 2003). The government is addressing iron deficiency anaemia (IDA) through an iron supplementation programme for pregnant women. However, as the trends show (Figure 11), this supplementation has not been successful because the iron supplements need to be taken daily and their distribution - when supplies are available - depends on pregnant women making regular visits to health centres.
FIGURE 11
Prevalence of anaemia by age/physiologic
group, 1993 to 2003
|
|
Sample sizes: 6 months to < 1 year - 1993, 400; 1998, 2 790; 2003, 329; 1 to 5 years - 1993, 3 859, 1998, 12 089; 2003, 3 291; 6 to 12 years - 1993, 2 135; 1998, 3 069; 2003, 4 647; pregnant - 1993, 782; 1998, 3 103; 2003, 586; lactating - 1993, 1 043; 1998, 3 260; 2003, 1 190.
Reference (WHO): children 6 months to 6 years, 11.0g/dl; children 6.1 to 14 years, 12.0g/dl; pregnant women, 11.0 g/dl; lactating women, 12.0g/dl.
Sources: NNS, 1993; 1998; 2003.
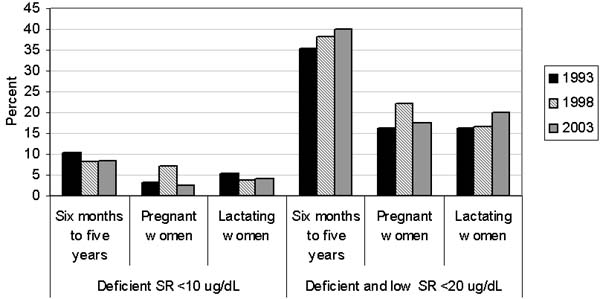
Trends in vitamin A deficiency
As with anaemia, vitamin A deficiency (VAD) - defined as serum retinol (SR) < 20 mg/dl - is a lingering public health problem that has been affecting more than the public health cut-off of 15 percent of children aged six to 59 months and pregnant and lactating women over the last ten years. The data on VAD from the 2003 NNS reveal that the prevalence among children aged six to 59 months increased from 35 percent in 1993 and 38 percent in 1998 to 40.1 percent. The proportion of children with severe VAD (SR < 10 mg/dl) was 8.5 percent, which is not significantly different from the 8.2 percent of 1998. The prevalence of VAD among lactating women increased from 16.5 percent in 1998 to 20.1 percent in 2003. Referring back to dietary data presented in the previous section, it is clear that the vitamin A intake of preschool children (Table 13) was inadequate. The poor micronutrient status of pregnant and lactating women also explains in part why the prevalence of VAD in young children remains high, in spite of an ongoing national programme of twice-yearly vitamin A supplementation, which was started in 1993.
FIGURE 12
Prevalence of VAD by age/physiologic group,
1993 to 1998
|
|
Sample sizes: 6 months to 5 years - 1993, 5 073; 1998, 14 291; pregnant - 1993,
765; 1998, 2 963; lactating - 1993, 1 051; 1999, 3 165.
Reference: deficient = SR < 10 ug/dl; deficient and low = SR < 20 ug/dl.
Sources: NNS, 1993, 1998.
Trends in iodine deficiency
In 1998, iodine deficiency was recognized as a mildly severe public health problem based on International Council for Control of Iodine Deficiency Disorders (ICCIDD) epidemiological criteria (i.e., median urinary iodine excretion [UIE] of between 50 to 99 mg/l among children aged six to 12 years). In that year, the median UIE level among Philippine children aged six to 12 years was 71 mg/L, and 36 percent of them had levels of less than 50 mg/l. In 2003, a significant improvement in the iodine status was noted. The median UIE among six- to 12-year-old children had increased to 201 mg/l, and the proportion of children with UIE levels less than 50 mg/l was down to 11 percent.
TABLE 19
Iodine status of selected population groups,
1998 and 2003
|
Group |
Median UIE (µg/l) |
Prevalence (%) of iodine deficiency (UIE < 50 µg/l) |
|||
|
1998 |
2003 |
1998 |
2003 |
||
| |
6-12 years |
71 |
201 |
35.8 |
11.0 |
| |
Pregnant |
|
142 |
|
18.0 |
| |
Lactating |
|
111 |
|
23.7 |
Sample sizes: 6 months to 12 years - 1998, 10 616; 2003, 4 665; pregnant -
2003, 583; lactating - 2003, 1 184.
Reference: UIE < 50 µg/l.
Sources: NNS, 1998; 2003.
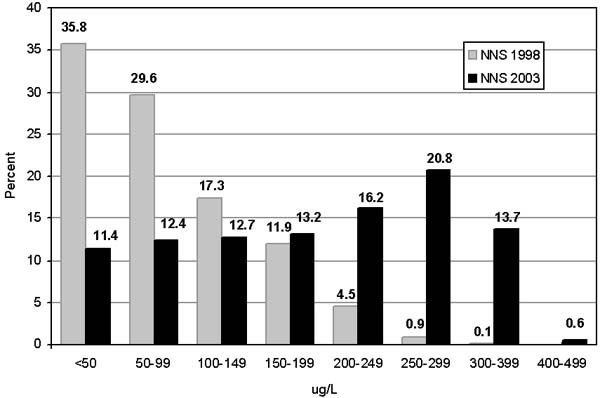
Much of the dramatic improvement in iodine status has been attributed to the Salt Iodization Programme, and the increasing availability and consumption of processed foods among this age group of children in particular. These foods include processed foods and instant noodles that use iodized salt as mandated by the Salt Iodization Programme (described later in this case study). From the distribution of UIE values among six- to 12-year-old children shown in Figure 13 it can be noted that a high proportion (34.3 percent) of the children have UIE values ³ 250 µg/l, and 14.3 percent have UIE ³ 300 µg/l. These values correspond to more than adequate and possible excess in iodine intake, respectively (WHO/UNICEF/ICCIDD, 2001), which makes it even more important that compliance with recommended iodine levels in salt is ensured at production and retail sites.
FIGURE 13
Frequency distribution of UIE values of
children aged six to 12 years, 1998 and 2003
|
|
A high proportion of lactating women (23.7 percent) continue to have low UIE (< 50 mg/l), and the challenge of eliminating iodine deficiency in this population group remains. Differences in diet provide a plausible explanation for why this group is generally more iodine deficient than children, even when they come from the same households; processed foods, including instant noodles, snack foods and processed meats, are more commonly consumed by children than lactating women.
![]()
![]()
![]()