![]()
![]()
![]()
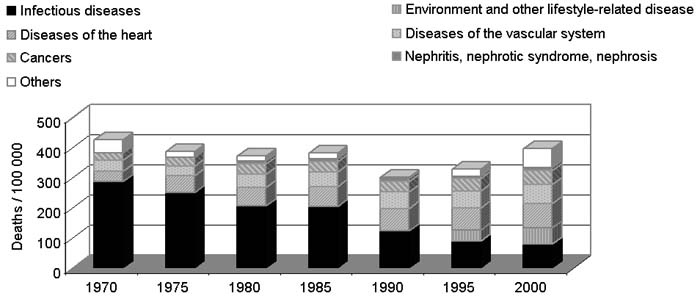
Over the last 30 years, mortality from infections (including pneumonias, tuberculosis and bronchitis), other infectious diseases (such as gastroenteritis and colitis, diarrhoea and measles), tetanus, avitaminosis and other nutritional deficiencies has been declining significantly. In 1970, the reported deaths from pneumonia were 118 per 100 000 population, which dropped to 42.7 per 100 000 in 2000. Pneumonia was the leading cause of death in the Philippines in 1970 and until about 1985. Tuberculosis and other infectious diseases were the second and third leading causes of death, with 80 and 63 deaths per 100 000, respectively, in 1970; deaths due to all forms of tuberculosis were down to 36 per 100 000 by 2000. Meanwhile, the pattern regarding deaths from NCDs, such as diseases of the heart (including coronary artery disease and heart failure), diseases of the vascular system (e.g. strokes) and various cancers, has exhibited a significantly increasing trend in the last 30 years. This trend may be associated with changes in food consumption over the past 25 years, including increasing energy density with greater proportions of fat in total energy, and declining intakes of fruits, vegetables and traditional foods. It is also associated with the high prevalence of smoking. NNS 2003 revealed that 35 percent of Philippine adults were current, and 10 percent former, smokers. Diseases of the heart overtook other infectious diseases to become the third leading cause of death by 1975; they overtook tuberculosis as the second leading cause of death by 1980, and pneumonia as the number one cause of death by 1990. In 2000, diseases of the heart (at 79 deaths per 100 000 population), diseases of the vascular system (63 deaths) and various cancers (48 deaths) ranked first, second and fourth, respectively, as leading causes of deaths in the Philippines. Environment and other lifestyle-related diseases (including chronic obstructive pulmonary diseases, other respiratory diseases and diabetes) have emerged as a leading cause of mortality since 1995, and ranked as the third leading cause of death in 2000.
FIGURE 14
Mortality trends by cause of death, 1970 to
2000
|
|
Sources: PHS, 1970; 1975; 1980; 1985; 1990; 1995; 2000.
The Philippines’ nutrition policies, strategies and programmes are reflected in the Medium-Term Philippine Plan of Action for Nutrition (MTPPAN), which is formulated every five to six years by the National Nutrition Council (NNC), whose members include representations from various government agencies (e.g., the Departments of Health, Agriculture, Education, Social Welfare, Science and Technology, Interior and Local Government, and Budget and Management) and non-governmental organizations (NGOs). The MTPPAN is the government’s blueprint for action to address the nutrition problems identified from NNS. The MTPPAN for 2005 to 2010 specifically aims to reduce underweight among children aged 0 to five years to levels based on the MDG target of 17.2 percent by 2015. This calls for accelerating the reduction rate of child undernutrition from the 0.58 percentage points a year (ppy) of 1998 to 2003, to no less than 0.81 ppy for 2005 to 2010 (NNC, 2005). The 2005 to 2010 MTPPAN also aims to reduce stunting and micronutrient deficiencies, particularly nutritional anaemia and VAD, among this group of children. Its other aims include reducing the following: underweight and stunting among children aged six to ten years; low birth weight; chronic energy deficiency among pregnant women; and micronutrient deficiencies among children aged six to 12 years and pregnant women. Targets are based on the reduction rates that were achieved in previous periods, or on the minimum prevalence for public health significance (e.g., 15 percent for VAD and 20 percent for iodine deficiency).
With regard to NCDs, the 2005 to 2010 MTPPAN will contribute to the achievement of targets that were identified by the National Coalition on the Prevention and Control of Non-Communicable Diseases, including reducing by 30 percent the prevalence of smoking, physical inactivity, hypertension, high FBG, obesity and total cholesterol among adults, and increasing the per capita intake of vegetables (NNC, 2005).
Table 23
MTPPAN targets for 2005 to 2010
| |
2005 |
2010 |
Estimated % reduction1 |
|
Prevalence of underweight among children 0-5 years old |
25.88 |
21.58 |
16.62 |
|
Prevalence of underweight among children 6-10 years old |
25.54 |
22.64 |
11.4 |
|
Prevalence of stunting among children 0-5 years old |
28.96 |
25.36 |
12.4 |
|
Prevalence of stunting among children 6-10 years old |
34.78 |
30.48 |
12.4 |
|
Prevalence of chronic energy deficiency among pregnant women |
24.96 |
20.86 |
16.4 |
|
Prevalence of IDA among infants |
59.20 |
41.70 |
29.6 |
|
Prevalence of IDA among children 1-5 years old |
25.10 |
15.10 |
39.8 |
|
Prevalence of IDA among children 6-12 years old |
34.00 |
25.50 |
25.0 |
|
Prevalence of IDA among pregnant women |
43.30 |
42.10 |
2.8 |
|
Prevalence of VAD among children 6 months to 5 years old |
32.90 |
15.00 |
54.7 |
|
Prevalence of VAD among pregnant women |
15.62 |
10.92 |
30.1 |
|
Prevalence of VAD among lactating women |
18.64 |
15.00 |
19.5 |
|
Prevalence of iodine deficiency among lactating women |
22.64 |
20.00 |
11.7 |
|
Prevalence of current smoking among adult males |
49.5 |
34.7 |
30% |
|
Prevalence of current smoking among adolescent females |
10.6 |
7.5 |
30% |
|
Per capita total vegetable intake (g/day) |
123.2 |
160.2 |
|
|
Prevalence of hypertension among adult males |
19.8 |
13.9 |
30% |
|
Prevalence of adults with high FBG |
3.0 |
2.1 |
30% |
|
Prevalence of central obesity (WHR) among females |
48.2 |
33.8 |
30% |
|
Prevalence of high total serum cholesterol among adult males |
7.5 |
5.2 |
30% |
1 Computed by subtracting the 2010 target from the 2005 estimated baseline, and dividing by the 2005 estimated baseline.
In spite of its apparently uneven targets for under- and overnutrition, the 2005 to 2010 MTPPAN clearly recognizes and addresses undernutrition as a public health problem among children, and pregnant and lactating women; it also recognizes and addresses nutritional factors associated with overnutrition and risks of ncds among adults. This can be inferred from the plan’s adoption of the life cycle approach, which recognizes that intergenerational consequences of undernutrition start from poor nutrition during pre-pregnancy and adolescence, and include the contribution of foetal undernutrition to adult chronic diseases (Aggett and Schofield, 2000).
The MTPPAN promotes the programmes described in the following paragraphs. Each of these programmes has the potential to address the double burden or coexistence of under- and overnutrition in households and communities, whether implicitly as in the case of micronutrient supplementation and food fortification, or explicitly as with home and community food production and nutrition education.
Home, school and community food production
This programme involves kitchen gardens and small animal raising activities to increase the supply of inexpensive, nutrient-rich sources of energy, protein, vitamin a and iron, as well as dietary fibre, in households. It has the potential to increase home and community production of fresh fruits and vegetables, which can improve the quality of diets for both under- and overweight individuals, while increasing intakes of essential micronutrients (Hawkes et al., 2005). The MTPPAN document makes explicit reference to the role of home and community gardens in increasing the intakes of essential micronutrients and dietary fibre, thereby addressing both undernutrition and the nutrition-related risk factors for CVD, hypercholesterolaemia, elevated LDL-cholesterol levels and certain cancers.
Nutrition education
This programme aims to promote desirable food, health and nutrition practices and lifestyle behaviours to ensure nutritional well-being, and addresses both under- and overnutrition. The intervention uses the Nutritional Guidelines for the Philippines (see Annex 4) as its framework, and follows the life cycle approach by targeting preschool children, schoolchildren, pre-adolescents, teenagers, pregnant and lactating women, and mothers and care providers. Promotion of the Nutritional Guidelines for the Philippines aims to address undernutrition by emphasizing the importance of exclusive breastfeeding, appropriate complementary feeding, consumption of a variety of foods, growth monitoring, and positive health-seeking behaviours. It also aims to address overweight and obesity and other diet and lifestyle factors associated with NCDs by, for example, limiting the consumption of fatty and salty foods, sugars and alcoholic beverages, increasing physical activity and avoiding smoking.
In addition, there are ongoing efforts to incorporate modules into the curricula of public and private schools; these are designed to increase physical activity and healthy lifestyles among schoolchildren. The National Coalition on the Prevention and Control of Non-Communicable Diseases and the Department of Health are carrying out other initiatives, including campaigns for healthy lifestyle in the workplace, communities and restaurants.
Food fortification
To address the persistent problem of micronutrient deficiencies, the Philippines has enacted two laws on food fortification to ensure adequate intakes of vitamin A, iron and iodine among all sectors of the population. These laws include the mandatory fortification of staples such as rice with iron, sugar and cooking oil with vitamin A, and wheat flour with iron and vitamin A, which were introduced in 2000, and the iodization of salt, which was introduced in 1995. The programme also promotes voluntary micronutrient fortification of other processed foods. Under this scheme, the Department of Health awards a Sangkap Pinoy Seal of approval, which the manufacturer puts on to the food label indicating that the food contains the recommended amount and type of fortification. Currently, 142 processed foods on the market carry the Sangkap Pinoy Seal.
However, there has been resistance to the law on mandatory fortification of rice, sugar and cooking oil on the part of manufacturers who object to having to bear the additional costs involved. Legislative consultations with various interest groups, including manufacturers and the public, are being carried out to identify how best to address the concerns of both groups.
Micronutrient supplementation
Similar to food fortification, the micronutrient supplementation programme aims to reduce micronutrient deficiencies. This programme includes universal vitamin A supplementation for all children six months to six years of age and for lactating women, and targeted supplementation to selected populations, particularly iron for infants and young children, pregnant and lactating women and adolescent females, and iodine for schoolchildren and women of child-bearing age in high-risk areas.
Between 1999 and 2003, the vitamin A supplementation programme reached 23 726 215 children, or 92.8 percent of those in the target 12 to 83 months age group, and 3 503 315 or 73.9 percent of nursing women. Over the same period, iron supplementation was provided to 12 979 689 (85.7 percent) pregnant and lactating women, 3 097 116 (80.3 percent) preschool-age children, 1 577 618 (73.3 percent) infants and 3 367 795 (83.2 percent) schoolchildren through the local health system (NNC, 2005). The outreach for iodine supplementation has been far lower, covering 56.2 percent of targeted women and 74.4 percent of targeted schoolchildren.
Clearly, the country’s nutrient supplementation and food fortification programmes, except perhaps salt iodization, have not yet had the desired impact on the micronutrient status of target population groups. The iron supplementation programme has been beset with funding problems and inadequate supplies of iron supplements. The current six-monthly dosing schedule for the universal vitamin A supplementation programme, which started in 1993, may be inadequate for areas with high prevalence of VAD (Pedro et al., 2005; Perlas et al., 1996). It is not clear how the target 55 percent reduction of VAD in children can be achieved through universal six-monthly vitamin A supplementation alone.
Food assistance
This programme serves as a short-term, stop-gap measure to rehabilitate undernourished populations, particularly preschool children, immediately and to prevent undernutrition in areas affected by calamities or emergency situations during the critical periods of complementary feeding for children aged six to 24 months and among women in the second trimester of pregnancy. Food assistance also includes the provision of basic food commodities at subsidized prices to poor households in nutritionally and economically depressed communities, as a contribution to the government’s poverty alleviation programme. Also being tested are food-for-work and food-for-school schemes, which entail the provision of basic nutritional food commodities to poor households (NNC, 2005).
Other programmes in the 2005 to 2010 MTPPAN are livelihood assistance; the integration of nutrition concerns into mother-and-child health programmes, including newborn screening, infant and young child feeding, integrated management of childhood illnesses, adolescent health and early childhood care and development; and the provision of safe and potable water supply and environmental sanitation (NNC, 2005).
The dietary changes that have occurred in Philippine households in the last 25 years are reflections of the increasing urbanization of the country. Urbanization increased from 37 percent in 1980 to 60 percent in 2000. Urban diets have been associated with increasingly Westernized food habits, such as high-fat diets, processed foods and refined carbohydrates. Data from the Philippines exhibit a pattern of increasing intakes of fats and oils, sugars and syrups, meats and processed meat products, and other cereals and cereal products (including breads and bakery products, noodles, and snack foods made from wheat flour), and declining fruit and vegetable consumption. It is likely that these trends will continue given the escalating urbanization of the Philippine population (the urban proportion is expected to reach 68 percent by 2015), coupled with the effects of increasing globalization such as trade liberalization, which has increased the availability and variety of processed and fast foods, the frequency of eating outside the home, the use of computers and computer games, and the influence of mass media.
Based on national data, the food intake in Philippine households in 2003 represents general improvements in quality and quantity, except with regard to declining fruit and vegetable consumption. The improvements have been in the direction of dietary goals and Philippine nutritional guidelines, including increasing the intakes of animal foods ("to increase good quality proteins and absorbable iron to satisfy nutritional requirements") and fats and oils ("as a remedy to caloric deficiency and to help lower the risk of vitamin A deficiency by facilitating its absorption and utilization"). In terms of the Philippines’ progress in achieving the MDGs, in 2003 fewer households had less than 100 percent per capita energy adequacy than in 1993. However, the improvement falls short of the rate necessary to meet the target. In spite of increased consumption of the food sources of iron, calcium and riboflavin, as demonstrated by increasing intake of animal source foods - including meats and dairy - these nutrients remain inadequate.
While the increased intake of animal foods and fats and oils was generally an improvement, there may be a trade-off in terms of increased cholesterol and saturated fats in diets, and increased overweight in children, adolescents and adults when coupled with sedentary lifestyles. Although the data show no evidence of increasing prevalence of low HDL-cholesterol and elevated triglycerides, the trend towards increasing obesity, hypercholesterolaemia and elevated LDL-cholesterol, which are known risk factors for CVD, is alarming. There has been increasing mortality from diseases of the heart and vascular system, which in the last ten years have become the top two leading causes of death in the country. While consumption of animal foods and fats and oils, prevalence of obesity, hypercholesterolaemia and elevated LDL-cholesterol, and mortality from CVD and other NCDs are moving in the same direction, the consumption of fruits and vegetables and other traditional staples such as maize and root crops has steadily declined over time. Among the reasons cited for the low intake of fruits and vegetables are cost or affordability and the declining production of fruits and vegetables, including indigenous produce, for local markets. This trend has been associated with policies on trade liberalization and globalization. It should not be discounted that other lifestyle-related factors, particularly physical inactivity and lack of exercise, stress, smoking and alcohol consumption - which are also known risk factors for obesity, hypertension, CVD and other chronic degenerative diseases - have contributed significantly to the increasing incidence of these lifestyle diseases.
"Unhealthy" or "faulty" diets, i.e., those characterized by high fat, refined carbohydrates and meat, are more likely to occur in certain sectors of the population than others: more among urban than rural dwellers, and more among higher-income than lower-income groups, even within urban areas. "Unhealthy" diets at the other end of the spectrum (i.e., those that are inadequate in energy, protein and many essential nutrients) are more common among lower-income groups. The available data on food consumption and nutritional status show national or regional estimates, and should therefore be disaggregated to ascertain disparities in the dietary patterns and malnutrition across income groups (although these are probably decreasing considering the declining income inequality as measured by the Gini ratio), as well as across age groups.
Although there has been progress in addressing undernutrition in the Philippines, it is still a problem of far greater magnitude than overnutrition is, especially among children. Out of every 100 children aged 0 to five years, 27 are underweight-for-age, 30 are stunted, more than 30 are anaemic, 40 are vitamin-A deficient, and only one is overweight. Out of every 100 children aged six to ten years, 27 are underweight, 37 are stunted, 37 are anaemic, 11 are iodine deficient, and again only one is overweight. The burden of undernutrition is also greater among 11- to 12-year-olds and 13- to 19-year-olds, with six underweight to every one overweight in the former, and four underweight to every one overweight in the latter age group. Among adults, on the other hand, there are twice as many cases of overweight as underweight.
There are indications that the country is facing a double burden of malnutrition, as evidenced by the coexistence at the population level of undernutrition among children and the elderly with overnutrition among adults. The malnutrition double burden within households, e.g., an underweight child and an overweight mother, is also reported to be emerging, with prevalence of 8.2 percent in one poor urban community, rising to about 20 percent in a high-income urban community (Agdeppa, Laña and Barba, 2003). There is increasing scientific evidence to support Barker’s hypothesis that chronic diseases such as CVD, type-2 diabetes and hypertension in later life may have their origins in foetal cardiovascular, metabolic and endocrine adaptation to intrauterine growth retardation (Aggett and Schofield, 2000). The prevalence of low birth weight was estimated to be about 9 to 11 percent in the 1990 to 1997 period, rising to about 18 percent in 1995 to 2000 (UNICEF 2000; 2002; de Onis, Blössner and Villar, 1998). Based on this hypothesis, the increasing prevalence of non-communicable or chronic degenerative diseases may be associated with maternal and foetal undernutrition, rather than dietary and lifestyle changes alone. Thus, addressing undernutrition from early life, including pre-pregnancy and maternal undernutrition, will contribute to reducing NCDs in the Philippines. Overnutrition increases with age, so programmes aimed at preventing overweight/obesity and NCDs in later life should start with children, particularly by increasing physical activity and exercise.
The life cycle approach calls for integrated, rather than distinct, intervention programmes that address under- and overnutrition in both communities and households by, for example, increasing fruit and vegetable production and consumption, encouraging the consumption of dried beans, nuts and seeds, marine products and lean meats, and promoting increased physical activity and exercise in children and adults.
Agdeppa, I.A., Laña, R.D. & Barba, C.V.C. 2003. A case study on dual forms of malnutrition among selected households in District 1, Tondo, Manila. Asia Pacific J. Clin. Nutr., 12(4): 438-446.
Aggett, P.J. & Schofield, L. 2000. Early nutrition and adult health: how strong are the links? Mal. J. Nutr., 6(2): 181-187.
Cerdeña, C.M., Laña, R.D., Molano, W.L., Chavez, M.C. & Nones, C.A. 2002. Philippine Nutrition Facts and Figures Supplement 1: 2002 Update of the Nutritional Status of 0-10-year-old Filipino Children. Manila, FNRI-DOST.
Cheong Revelita, Madriaga, J.R., Perlas, L.A., Desnacido, J.A., Marcos, J.M. & Cabrera, M.I.Z. 2001. Prevalence of anemia among Filipinos. Philippine Journal of Nutrition, 48(1-2): 45-57.
De Onis, M., Blössner, M. & Villar, J. 1998. Levels and patterns of intrauterine growth retardation in developing countries. European J. of Clinical Nutrition, 52(S1): S5-S15.
Department of Health. No date. Field Health Service Information System (FHSIS).
Department of Health. No date. Health statistics. Available at www.doh.gov.ph.
Duante, C.A., Velandra, F.V., Orense, C.L. & Tangco, J.B.M. 2001. Correlates of hypertension and android obesity among Filipino adults. Philippine Journal of Nutrition, 48(1-2): 81-102.
FAO. 2003. The state of world food insecurity. Rome.
Florentino, R.F., Pedro, M.R.A. & Molano, W.L. 1996.The changing dietary intake and food consumption patterns in the Philippines. In Changing dietary intake and food consumption in Asia and the Pacific. Tokyo, Asian Productivity Organization.
FNRI-DOST. 1976. Recommended dietary allowance (RDA) for Philippines. Manila.
FNRI-DOST. 1989. Recommended dietary allowance (RDA) for Philippines. Manila.
FNRI-DOST. 2000. Nutritional guidelines for Philippines. Manila.
FNRI-DOST. 2001. Philippine nutrition facts and figures. Manila.
FNRI-DOST. 2002a. Baseline survey and data generation on nutritional status, psychosocial development and care of 0-6 year-old children in ECD provinces (final report). Manila.
FNRI-DOST. 2002b. Recommended energy and nutrient intakes (RENI). Manila.
Hawkes, C., Eckhardt, C., Ruel, M. & Minot, N. 2005. Diet quality, poverty and food policy: A new research agenda for obesity prevention in developing countries. SCN News, 29: 20-22.
Kuizon, M.D., Perlas, L.A., Madriaga, J.R., Cheong, R.L., Desnacido, J.A., Marcos, J.M., Fuertes, R.T. & Valdez, D.H. 1993. Fourth National Nutrition Survey: Philippines, 1993. Part D. Biochemical Nutrition Survey. Manila, FNRI-DOST.
Madriaga, J.R., Cheong Revelita, Desnacido, J.A., Marcos, J.M., Cabrera, M.I.Z. & Perlas, L.A. 2001. Prevalence of vitamin A deficiency among specific Filipino population groups. Philippine Journal of Nutrition, 48(1-2): 29-43.
Madriaga, J.R., Cheong Revelita, Desnacido, J.A., Marcos, J.M., Loyola, A.S., Sison, C.C. & Cabrera, M.I.Z. 2001. Prevalence of iodine deficiency in the Philippines. Philippine Journal of Nutrition, 48(1-2): 59-68.
Magbitang, J.A., Tangco, J.B.M., Dela Cruz, E.O., Flores, E.G. & Guanlao, F.E. 1988. Weight for height as measure of nutritional status in Filipino pregnant women. Public Health Asia Pacific Journal, 2(2): 96-104.
Must, A., Dallal, G.E. & Dietz, W.H. 1991. Reference data for obesity: 85th and 96th percentiles of body mass index (wt/ht2) - a correction. American Journal of Clinical Nutrition, 53: 839-846.
National Statistical Coordination Board. No date. Poverty statistics. Available at: www.nscb.gov.ph.
National Statistics Office. 2003. Philippine National Demographic and Health Survey. Manila.
NEDA. 2005. Medium Term Philippines Development Plan 2005-2010 (draft). Manila, National Economic Development Authority (NEDA).
NNC. The Medium-Term Philippine Plan of Action for Nutrition 2005 to 2010. Manila. (draft)
Pedro, M.R.A., Barba, C.V.C. & Candelaria, L.V. No date. Globalization, food consumption, health and nutrition in urban areas. Manila, FNRI-DOST.
Pedro, M.R.A., Madriaga, J.R., Barba, C.V.C., Habito, R.F.C., Gana, A.E., Deitchler, M. & Mason, J.B. 2004. The national vitamin A supplementation and sub-clinical vitamin A deficiency among preschool children in the Philippines. Food and Nutrition Bulletin, 25(4): 319-329.
Pedro, M.R.A., Cerdeña, C.M., Constantino, M.A.S., Patalen, M.L.P., Palafox, E.F., Delos Reyes, C.M., Castillo, E.V., De Leon, J.Y. & Barba, C.V.C. 2005. Sixth National Nutrition Survey: Philippines, 2003. National Food Consumption Survey: Household Level. Manila, FNRI-DOST.
Pedro, M.R.A., Cerdeña, C.M., Patalen, M.L.P., Nones, C.A., Vargas, M.B., Laña, R.D., Castillo, E.V. & Barba, C.V.C. 2005. Sixth National Nutrition Survey: Philippines, 2003. Update on the Nutritional Status of Filipinos. Manila, FNRI-DOST.
Perlas, L.A., Florentino, R.F., Fuertes, R.T., Cheong Revelita, Madriaga, J.R., Desnacido, J.A., Marcos, J.M. & Cabrera, M.I.Z. 1996. Vitamin A status of Filipino preschool children given a massive oral dose. Southeast Asian Journal of Tropical Medicine, 27(4): 785-791.
Perlas, L.A., Madriaga JR, Cheong Revelita, Marcos, J.M., Desnacido, J.A., Perez, E.S., Ulanday, J.R.C., Sumayao Jr., R.E., Cabrera, M.I.Z. & Barba, C.V.C. 2005. Sixth National Nutrition Survey: Philippines, 2003. Biochemical Phase. Manila, FNRI-DOST.
Popkin, B. 1994. The nutrition transition in low-income countries: an emerging crisis. Nutrition Reviews, 52(9).
Population Commission. 2002. APPC Country Report, pp. 27-32. Available at www.popcom.gov.ph.
Reyes, C.M. 2003. Country development programming framework for the Philippines: assessment of the social sector. (unpublished paper)
Shetty, P. & Gopalan, C., eds. 1998. Diet, nutrition and chronic disease: an Asian perspective. London, Smith-Gordon and Co.
Templo, O.M. 2003. Country development programming framework for the Philippines: Philippine development context and challenges. (unpublished paper)
UNDP. 2004. Human development report 2004. New York.
UNICEF. 2000. The state of the world’s children 2000. New York.
UNICEF. 2002. Official summary: The state of the world’s children 2002. New York.
UNICEF. 2003. The state of the world’s children 2003. New York.
UN Population Division. 2004. World population prospects: The 2004 revision and world urbanization prospects. New York, Department of Economic and Social Affairs of the United Nations Secretariat.
USDA. No date. Nutrient Data Laboratory. Available at: www.nal.usda.gov/fnic/foodcomp/search.
Velandria, F.V., Duante, C.A., Mendoza, T.S., Mendoza, S.M. & Dela Cruz, E.O. 2001. Prevalence of android obesity among Filipino adults, 20 years and over. Philippine Journal of Nutrition, 48(1-2): 69-80.
Villavieja, G.M., Valerio, T.E., Abaya, H.S.P., Angelo, T.N., Cerdeña, C.M. & Domdom, A.C. 1981. First Nationwide Nutrition Survey: Philippines, 1978. Part A - Food Consumption Survey, 2nd revision. Manila, FNRI, National Science Development Board.
Villavieja, G.M., Valerio, T.E., Abaya, H.S.P., Cerdeña, C.M. & Domdom, A.C. 1984. Second Nationwide Nutrition Survey: Philippines, 1982. Part A - Food Consumption Survey. Manila, FNRI, National Science and Technology Authority.
Villavieja, G.M., Cerdeña, C.M. & Chavez, M.C. 1985. Dietary assessment of infants and toddlers in the Philippines. Manila, FNRI, National Science and Technology Authority.
Villavieja, G.M., Valerio, T.E., Cerdeña, C.M., Abaya, H.S.P., Feliciano, E.A., Boquecosa, J.P., Red, E.R., Nones, C.A. & Constantino, A.S. 1989. Third National Nutrition Survey: Philippines, 1987. Part A - Food Consumption Survey. Manila, FNRI-DOST.
Villavieja, G.M., Cerdeña, C.M., Molano, W.L., Laña, R.D., Boquecosa, J.P., Raymundo, B.E., Nones, C.A., Abaya, H.S.P., Palafox, E.F., Chavez, M.C., Burayag, G.A., Pine, C.R., Recuenco, J.R.D., Saturno, D.S. & Delos Reyes, C.M. 1997. Fourth National Nutrition Survey: Philippines, 1993. Part A- Food Consumption Survey. Manila, FNRI-DOST.
Villavieja, G.M., Molano, W.L., Cerdeña, C.M., Laña, R.D., Constantino, A.S., Tarrayo, M.E.R., Concepcion, D.S., Juguan, J.A. & Sario, I.S. 1997. Fourth National Nutrition Survey, Philippines, 1993. Part B Anthropometric Survey. Philippine Journal of Nutrition, 44(1-2): 34-48.
Villavieja, G.M., Laña, R.D., Cerdeña, C.M., Constantino, A.S., Boquecosa, J.P., Chavez, M.C., Palafox, E.F., Nones, C.A., Concepcion, D.S., Tarrayo, M.E.R. & Casio, M.B. 1998. Updating of Nutritional Status of Filipino Children at the Provincial Level. Philippine Journal of Nutrition,48(1-2): 1-14.
Villavieja, G.M., Constantino, A.S., Laña, R.D., Nones, C.A., Nueva España, M.B. & Pine, C.R. 2001. Anthropometric assessment of adolescents, adults, pregnant and lactating women: Philippines, 1998. Philippine Journal of Nutrition, 48(1-2): 15-28.
WHO. 1995. Physical status: the use and interpretation of anthropometry. Report of a WHO Expert Committee. WHO Technical Report Series No. 854. Geneva.
WHO/FAO. 2003. Diet, nutrition and the prevention of chronic diseases. Report of a Joint WHO/FAO Expert Consultation. WHO Technical Report Series No. 916. Geneva.
WHO/UNICEF/ICCIDD. 2001. Assessment of iodine deficiency disorders and monitoring their elimination. Geneva. (WHO/NHD/01.1)
![]()
![]()
![]()