![]()
![]()
![]()
Cécile Brugère
Fisheries and Aquaculture Department
FAO, Rome, Italy
Brugère, C. 2006. Economics of integrated irrigation-aquaculture. In M. Halwart & A.A. van Dam, eds. Integrated irrigation and aquaculture in West Africa: concepts, practices and potential, pp. 135–150. Rome, FAO. 181 pp.
Abstract
The paper highlights the importance of economic analysis in technological development. Principles and methods of “first-aid economics” are presented to allow non-economists to monitor economic performance of integrated irrigation and aquaculture systems. Emphasis is placed on the distinction between farmer’s and economist’s perspectives, with the relevance and calculation of economic indicators explained. Methods of data collection and analysis are also presented and a case study of rice-fish farming which provides an illustrative example of applied economic assessment is presented in an appendix.
Introduction
Economic analysis is an important part of farm activities. It allows farm managers to evaluate the performance of the farm and project managers to assess impacts of development programmes or interventions on food production, household food security and the economy. With few exceptions, past experiences of aquaculture development in Africa, including integrated irrigation-aquaculture (IIA), have not reached their full potential. While reasons for failure may be complex and attributed to a combination of factors, giving full consideration to the assessment of economic performance of aquaculture with the joint participation of both farmers and project managers can ensure the long-term adoption of the activity. As aquaculture is the activity to integrate in existing systems, measuring its economic performance can assist in answering questions related to its chances to be economically viable and attractive as a livelihood strategy. The paper should be viewed as a “first-aid economics” guide aiming to present an overview of simple approaches that can be used by non-economists to address these questions. Readers are encouraged to consult the literature references for more in-depth information and illustrative examples of methods presented. The first section describes the main tools and indicators used in economic analysis. A second section specifies methods of data collection and analysis, making reference to the example of rice-fish culture in Madagascar (detailed in Appendix 1). In a third section the conclusions are summarized.
Types of economic analysis and performance indicators
While the term “economic” is commonly used, financial and economic analyses need to be differentiated. Financial analysis addresses the profitability of an activity, based on its technical characteristics, costs and returns. This type of analysis is of direct concern to the farmer. On the other hand, an economic analysis deals with flows of real resources and assesses the viability and impact of a programme on the local economy or the wider society. It is more precise and of direct concern to project managers and economists. Both rely on financial data, collection of which is the subject of a later section.
Table 1. Economic indicators of farm performance, from a farmer's and an economist's perspective.
| Item | Definition and interpretation | |
| FARM MANAGEMENT (FARMER'S PERSPECTIVE) | Basic economics | |
| I. Gross revenue (GR) | = Quantity harvested x price received (market price). | |
| II. Variable costs (VC), also called operating costs | = Sum of costs of all inputs necessary to production.
E.g.: - fingerlings / seeds - fish feed, crop fertilizers etc. - paid labour1 - (opportunity cost of variable costs)2 | |
| III. Gross margin (GM), also called income above variable costs or operating profit. | = Gross revenue net of variable
costs = GR - VC | |
| IV. Fixed costs (FC) | = Sum of expenses incurred regardless of output levels.
E.g.: - Depreciation of equipment and infrastructures (pond, cages etc.) - Interest on borrowed capital (opportunity cost of capital) - etc. | |
| Vi. Net returns to land, labour and management (NRLLM) | = Returns net of fixed and variable costs: GR - (FC + VC) | |
| FARM PERFORMANCE (ECONOMIST'S PERSPECTIVE) | Additional data required: | - opportunity cost of land = X1 - opportunity cost of unpaid labour = X2 - opportunity cost of unpaid management = X3 - interest rates - opportunity costs of variable costs2 (if not already included in variable costs). |
| Vii. Total costs | = Sum of all costs and opportunity
costs = FC + VC + X1 + X2 + X3 | |
| Viii1. Net returns to land and management (NRLM) | = NRLLM - X2 | |
| Viii2. Net returns to management (NRM) | = NRLM - X1 | |
| Viii3. Net returns (NR) | = NRLM - X3 OR = NRLLM - (X1 + X2 + X3) | |
| VI. Ordinary Benefit/Cost ratio (B/C)4 | Ratio giving the relative proportion of benefits in relation to
costs. = NR/(VC+FC) [with imputed opportunity costs] or = NRLLM/(VC+FC) [without imputed opportunity costs] The greater the ratio, the greater the profitability. | |
| VII. Pay-back period3 | The time (in years or production cycles) it takes for an activity or project to recover its initial cost, calculated as the ratio of initial investment cost to annual cash flows, before depreciation. It is equal to:
 | |
| Advanced economics | ||
| VIII. Net present value (NPV) | Reflects the fact that an investment has a higher value in the present than in the future because of risk and uncertainty regarding future
earnings. Its formula is:  with V0 = present value, VN = future value, r = interest rate (discount rate), N = number of periods, or years of operation. If V0 > 0, the investment will be profitable. If V0 < 0, the investment will not be profitable. If V0 = 0, the investment will not bring any returns (break-even situation). | |
| IX. Internal rate of return (IRR) | The interest rate (or discount rate), r, at which NPV equals zero. It represents the average earning power of the money used in a project over its whole life. It is obtained by solving the equation, on a trial-and-error basis:
where AN = net benefits over individual period N (difference between total benefit or revenue and total costs), r = interest rate (discount rate). If IRR is greater than the appropriate opportunity cost of capital, the investment is feasible and worthwhile. | |
| X. Discounted Benefit / Cost ratio | = Discounted NR / (FC + discounted VC). Opportunity costs of land, labour and capital are imputed. | |
1 Marketing time, if appropriate, should be included.
2 This inclusion of this type of cost in variable costs may not be amongst farmers' concerns. It is important however from an economist's perspective and should be included in further analysis.
3 This indicator is of relevance to commercial-scale operations but is of little use in the context of small-scale, subsistence-based operations.
4 As a dimensionless ratio, C/B can be calculated too [(VC+FC)/NR]. In this case, the smaller the ratio, the greater the profitability.
Table 2: Essential data collection for basis assessment of performance of an IIA system.
| COSTS | |
| Fixed costs | Pond excavation Cage construction Rice field design to accommodate fish production Irrigation charges (if fixed regardless of quantity of water used) |
| Variable costs(linked to quantities used) | Stocking of fish
seed/fingerlings Feed Fertilizers Harvest |
| Labour costs | Paid labour (production and post-harvest) Unpaid household labour1 |
| INCOME | |
| Margins | Production quantities (sold and home
consumed) Farm-gate or market price of commodity sold |
Types of economic analysis
Defining the time scale as well as the scale of operation (subsistence-extensive, smallscale commercial-semi-intensive, commercial or industrial-intensive), is of prime importance to deciding which type of analysis to carry out. Micro-economic approaches to farm management are of higher relevance to IIA development, in particular at subsistence and small-scale commercial levels.
Denomination and definition of approaches and methods can sometimes overlap and vary from one source to the other. To overcome possible confusion, it may be easier to consider the problem of farm economics from two perspectives: the farmer's and economist’s (or project manager's).
From the farmer’s perspective, farm management based on the keeping of farm budgets allows him/her to analyze inputs and outputs from farm operations. It excludes variables such as labour costs and opportunity costs of resources and tends to underestimate the importance of amortisation.
From an economist’s perspective, farm management can be broadened to include production economics (economics of transformation of resources, their allocation and productivity at the farm level) and household economics (impact of farm activities on household economies). Other approaches with a wider scope are macro-economics, which deals with flows of resources at regional, national or global levels; and environmental economics, which looks at the valuation of impacts created by an activity on the environment and on the communities who depend on it. Cost-Benefit Analysis (CBA) is a method used to operationalize these two approaches. To accurately reflect reality, such analyses include information related to the opportunity costs of resources (labour, land, capital etc.), and take into account market distortions.
The following section provides details on the calculation of indicators used to measure the economic efficiency of farms, both from the farmer’s and the economist’s points of view. Indicators are presented as they would be in the context of a ‘real-life’analysis.
Indicators and ratios
For the evaluation of the performance of IIA activities on a pilot scale, a farm management approach may be initially sufficient to assess the immediate profitability of the enterprise. However, to forecast the long-term viability of the operation additional indicators, based on a number of assumptions, are necessary. Table 1 describes the information needed for the calculation of relevant indicators and ratios used in economic analysis, and their interpretation. It also illustrates the progress from farm management to more complex economic analysis.
The calculation of the net present value (NPV) is necessary to compare costs and revenues while correcting for the time that elapses between the date of initial investments and the date of first revenues. It involves a process called discounting. Discounted values (or present values) are obtained by dividing the future estimated revenues in year N by (1+r)N, which is the interest that would be generated over period N (r is the interest or discount rate).
Table 3: Example of economic prices and corresponding financial prices, assuming market efficiency, in the case of aquaculture.
| Economic prices | Financial prices (used as proxies) | |
| Cost of labour (valuation of household labour) | → | Marginal value product of agricultural labour |
| Cost of land | → | Market price of land |
| Cost of machinery | → | Market price of hiring a machine |
| Cost of construction materials | → | Market price of these materials |
| Cost of seed-fry-fingerlings | → | Market price of seed-fry-fingerlings |
| Cost of feed and fertilizer (pond) | → | Market price in the next best alternative use (feed for cattle or poultry, fertilizer for crops etc.) |
| Cost of fish at harvest | → | Market price of fish |
| Opportunity cost of unpaid labour | → | Government minimum wage or reservation wage or estimated value of labour paid in kind1 |
| Opportunity cost of capital | → | Basic interest rate on savings (paid by banks) |
| Opportunity cost of land | → | Net return (per unit of land) from the next alternative use of land. |
Using discounting over ordinary methods limits inflating revenues and future costs and allows for better comparison of various projects or scenarios envisaged over different time spans (Hishamunda and Manning,2002).
Data collection and analysis
Data requirements
While all the above indicators are important for accurate analysis and monitoring, resources are often limiting and prevent the collection of detailed data.
Essential (minimum) data to collect to obtain an overview of the performance of an IIA system is presented in Table 2. Additional data : for an economic perspective on farm performance, assumptions are often needed regarding the value of resources that are not directly marketed. Table 3 suggests suitable ‘proxies’, drawn from the market prices of goods and resources in alternative uses. To be valid, they rely on the critical assumption that market prices are efficient (competitive economy).
In addition to the above, information on prevailing interest rates, expected economic life-time, depreciation, as well as salvage values will be valuable in economic viability assessments. Analysis of opportunity costs of resources consumed by aquaculture and trade-offs at the household level requires collection of in-depth information related to household activities, decision-making and resource use. Because data to collect is wide-ranging and context-specific it has not been listed here. Suitable approaches to the collection of such data are suggested in the next section.
Data collection
Data collection can be a lengthy process bearing heavy demands on the time of all stakeholders. To avoid wasting resources, it is therefore important to plan ahead; to decide what has priority in data collection and how the data will be analysed;and then stick with the plan. Keeping in mind a checklist based on WHAT, WHERE, WHEN, WHO, and HOW, questions can help avoid data omissions. Examples are provided in Table 4.
Table 4: Planning data collection - example of a checklist.
| WHAT | - Type of operation (scale) under
investigation - Sample size (very important - stratified, random etc.) and its justification - What we need to know / what we want to know / what needs to be shown - What will be done with the collected data (i.e. planning the analysis) |
| WHERE | - Demarcation of area of survey |
| WHEN | Time scale of survey: - if over time: frequency and overall length of data collection - if snap-shot: period of recollection of data (back in time), period of year (can influence results, in particular in areas with strong seasonal variations) |
| WHO | - Groups under investigation. - Data collection (farmers, extensionists, consultants etc.). - Data analysis. |
| HOW | - Methods of data collection (structured questionnaire, participatory
appraisal). - Methods of analysis and reporting. |
Structured questionnaires are often used for the collection of economic data as they allow the systematic collection of information and are useful in the case of large samples. However, they have limitations in terms of quality of data obtained from farmers. Preparatory studies, careful preparation and field-testing prior to implementation, and training of enumerators or farmers involved in collection are of prime importance to ensure quality and limit bias. For example, with respect to labour information, it is often easier for respondents to estimate the quantity of labour used if management activities are disaggregated, but only questionnaire pre-testing can reveal such weaknesses in the collection process. On an ad-hoc basis, in-depth semi-structured, face-to-face interviews are then useful for quality checks. In addition, the qualitative information gained from participatory appraisals can be useful in gaining a broad understanding of a situation prior to its quantitative appraisal, as well as provide an insight in intra-household issues, including gender relationships, decisions and responsibilities. This type of information, whilst not substituting quantitative data, can shed valuable light on the results obtained.
Data analysis
No complex software is needed for data analysis: an MS Excel spreadsheet is sufficient and includes pre-programmed ratio calculations.
As underlined above, the inclusion or exclusion of household labour is critical in the interpretation of results. Two analyses are generally carried out in parallel: one excluding household labour from calculations, and one including estimates of non-monetary cost to the pursuit of an activity.
In planning the development of a new activity or estimating its potential, running sensitivity analyses with varying figures (for example interest rates, prices of inputs), can show the thresholds beyond which an activity may not be economically viable. Similarly, a cost structure analysis, whereby each variable cost is estimated as percentage of total variable costs and total costs, can suggest where cost reductions can be made and estimate the impacts of modified resource allocation on other activities.
Case study - Madagascar
For an illustrative case study of the methods of data collection and analysis described above, readers are encouraged to refer to the “comparative economic analysis of rice, fish and rice-fish culture in Madagascar” (Appendix 1). In this study, reference is made to farm management from the farmer’s perspective: ratios are presented and their interpretation allows for the determination of comparative advantages and disadvantages of each type of activity.
Conclusion
The paper has highlighted what can be achieved with basic economic analysis applied to aquaculture and IIA activities and has shown that a few strategically chosen indicators can go a long way in assessing the performance and long-term viability of such operations. At the farmer’s level, simple and regular assessments can allow for difficulties to be spotted early in the development of a new activity, and allow for its redirection or readjustment. An economist’s approach can, in addition, enable to consider the longer-term viability of a project and anticipate its potential for adoption and impacts on poverty alleviation and livelihood diversification. The two perspectives however diverge mainly over their estimation of unpaid household labour: it is rarely accounted for by farmers but should be adequately valued and included in analysis, in addition to all other non-market costs, by economists. Despite the quantitative nature of the data used, remaining sensitive to local knowledge and practices and adopting participatory principles during data collection can assist in collecting quality information and achieving meaningful economic analysis.
Acknowledgements
Dr. Hishamunda's comments on an early draft are gratefully acknowledged.
References
Hishamunda, N. & Manning, P. 2002. Promotion of sustainable commercial aquaculture in sub-Saharan Africa. Volume 2: Investment and economic feasibility. FAO Fisheries Technical Paper No. 408/2. Rome, FAO (also available at www.fao.org).
Further reading
Jolly, C.M. & Clonts, H.A. 1993. Economics of aquaculture. Binghamton, Food Products Press.
Shang, Y.C. 1981. Aquaculture economics: Basic concepts and methods of analysis. Boulder, Westview Press.
SPFS. 2003. Handbook on monitoring and evaluation. Special Programme for Food Security. Rome, FAO.
Stomal,B. & Weigel,J-Y. 1997. Aquaculture economics in Africa and the Middle East. In A.T. Charles, R.F. Agbayani, E.C. Agbayani, M. Agüero, E.F. Belleza, E. Gonzáles, B. Stomal & J-Y Weigel, eds. Aquaculture economics in developing countries. Regional assessments and an annotated bibliography. Fisheries Circular No. 932. Rome, FAO (also available at www. fao.org)
Wijkstrőm, U. & Vincke, M.M.J. 1991. Ghana - Technical assistance and investment framework for aquaculture in Ghana. Field Technical Report 3: Review of the economics of fish farming and culture-based fisheries in Ghana. Rome, FAO.
Appendix 1.
COMPARATIVE ECONOMIC ANALYSIS OF RICE, FISH AND RICE-FISH
CULTURE IN MADAGASCAR1
Introduction
With its long coastline of 4500 km and a continental shelf of 117000 km2, Madagascar has excellent potential for fisheries and aquaculture development. According to the National Statistical Institute, the fisheries sector contributed more than seven percent to the national GDP over the last years. A further increase to nine percent in the next few years is expected. The total population of Madagascar is 16.4 million (2001) and is growing at a rate of three percent annually. Around five percent of the working population depends on income from activities in the fisheries and aquaculture sector (Razafitseheno, 2001). The capture fisheries sub-sector saw a rapid growth in production from 107590 tonnes in 1990 to 143859 tonnes in 2000 (FAO, 2002a), showing an increase of 4 percent from 1999 to 2000. However, the potential for capture fisheries is limited, and a decrease in catches of various species was reported recently. The total fisheries export earnings were about US$ 101 million in 1999; an increase of 5.5 percent over 1998 (FAO, 2002b).
Figure 1. Carp aquaculture production in Madagascar, 1990–2000 (FAO, 2002a).
Although fish and aquatic animal products are a potentially important nutritional source for Malagasy people current consumption figures are low, estimated at 7.6 kg/year in 1999. Consumption of fish and aquatic animal products is expected to increase further as it is considered as healthy food.
Within the fisheries sector, aquaculture is important and developing rapidly in the rural areas of Madagascar. Shrimp aquaculture in particular has shown its economic potential in recent years, attracting many investors. As a result, its production has increased from 790 tonnes in 1993 to more than 4800 tonnes in 2000. In contrast, the national production figures from inland fish culture (mainly carp) over the same period show large fluctuations.
Table 1. Bio-physical data for rice, fish and rice-fish culture systems in Madagascar (calculated averages per year), 2001.
| Item | Rice | Fish | Rice-Fish |
| Cultivated areas (ha) [standard deviation] a | 0.21 [0.2] | 0.086 [0.15] | 0.45 [0.6] |
| Rice yield (kg/ha/year) | 3 769 | - | 4 604 |
| Fish yield (kg/ha/year) | - | 676 | 393 |
| Production cycles (no./year) | 1 | 1 | 1 |
| Length of rice production cycle (days) | 144 | - | 159 |
| Length of fish production cycle (days) | - | 240 | 171 |
| Lime input (kg/ha) | 34 | 778 | 5 |
| Organic fertilizer input (kg/ha) | 5 906 | 7 217 | 17 060 |
| Inorganic fertilizer input (kg/ha) | 87 | 10 | 277 |
| Rice seed quantity (kg/ha) | 474 | - | 106 |
| Stocking density (fingerlings/m2) | - | 1.16 | 0.44 |
| Weight of fish at stocking (g) | - | 5.3 | 9.7 |
| Ratio fish weight at harvest/at stocking | - | 34.53 | 26.60 |
| Fish feed inputs (kg/ha) | - | 1 271 | 396 |
| Hired labour (person-days/ha) | 276 | 28 | 340 |
| Family labour (person-days/ha) | 95 | 48 | 60 |
| Management time (person-days/ha)b | 5 | 3 | 3 |
a For rice and rice-fish operations: area of rice fields. For fish culture: pond area only.
b Estimated at 5 percent of total family labour (no data available)
The top carp production of 6105 tonnes in 1997 was followed by a steep decline the year after. Most recent FAO figures of the year 2000 show a carp aquaculture production of 2480 tonnes (Figure 1). One of the main reasons for the sharp decline in carp production in 1998 was the tropical cyclone Gretelle which hit the country in 1997 leaving 200 casualties and affecting some 570000 people. This first cyclone in 40 years destroyed large parts of the cash crops, including aquaculture. Because of the damage to hatcheries, fingerlings were in short supply the following year.
About 71 percent of freshwater aquaculture production in Madagascar comes from rice-fish culture (Remanevy, 1999). The remaining (29 percent) is produced in pond systems. While carp has been the main species used in rice-fish culture, tilapia is also becoming popular. Rice-fish farming in Madagascar is a simple, low-cost and low-technology practice. It was promoted by various nationally and internationally funded projects, like e.g., the FAO/UNDP project MAG/92/004 “Programme de développement de la pêche et de l'aquaculture” and the project “Initiatives Genre et Développement: Le projet rizipisciculture (Sud et Nord) a Madagascar” funded by the European Union. However, the economics of rice culture, fish culture and rice-fish culture are not well understood.
Methodology
Economic data were collected from ten rice farms, ten fish farms (carp culture) and ten rice-fish farms (tilapia/carp culture) in the Vakinankaratra area in 2001. Data was analysed by using the “Enterprise budget technique”. The average sizes of rice, fish and rice-fish farms were 0.21, 0.09 and 0.45 hectare, respectively. However, due to the small sample size, standard deviations were high: 0.20, 0.15 and 0.60 ha, respectively. Depreciation rates used for the investment costs in ponds and rice-fish fields were based on similar studies from other countries in Sub-Saharan Africa. They were 20 and 10 years for fish ponds and rice-fish field structures, respectively. Most farmers interviewed for the study were among the poorer part of the rural population, as the study aimed to identify the opportunities and constraints of fish culture for the rural poor in Madagascar. Photographs of the three production systems are provided in Appendix 2.
Results
Table 1 presents bio-physical data for the three production systems. Although in all systems only one production cycle per year is practiced, the length of the cycle is diverse and ranges from 144 days for rice to 240 days for fish culture. Lime, organic and in-organic fertilizers are used in all three systems although in different quantities. For instance, fish farmers use more lime in the preparation of their ponds, while rice-fish farmers add more organic fertilizers to their rice-fish fields than farmers in the other two systems. Rice-fish farmers use around 22 percent of the rice seeds that rice farmers use, and around 38 percent of the fingerlings that fish farmers use per hectare. The average weight of the fingerlings stocked in rice-fish culture is higher than in fish-only systems (± 10 g vs 5 g). The quantity of feed used by fish farmers is about double that used by rice-fish farmers. Rice-fish farming appears to be the most labour-intensive. Rice-fish farmers hire relatively more labour. Of the three systems, fish farming has the lowest labour intensity. Yields from the three systems are also very diverse. Rice yields from a rice-fish field are 22 percent higher than yields from an ordinary rice field. This could be an indication that the integration of fish and rice culture has a positive impact on rice yields. The rice-fish system on average utilizes three times more fertilizers per unit of land than the rice system. This is probably another important reason for the higher rice yield from the rice-fish systems in this study.
Table 2. Economic data for rice, fish and rice-fish culture systems in Madagascar, 2001 (calculated averages per year). FMG = Malagasy franc (US$ 1 = FMG 5970, 2001)
| Item | Rice | Fish | Rice-Fish |
| Average market price rice (FMG/kg) | 1 360 | - | 1 245 |
| Price of rice seeds (FMG/kg) | 1 360 | - | 1 245 |
| Average market price fish (FMG/kg) | - | 13 825 | 11 950 |
| Price of organic fertilizer (FMG/kg) | 55.30 | 57.50 | 86.25 |
| Price of chemical fertilizer (FMG/kg) | 3 300 | 3 000 | 3 225 |
| Price of lime (FMG/kg) | 2 700 | 800 | 750 |
| Price of fingerlings (FMG/kg) | - | 40 566 | 18 556.7 |
| Price of fish feed (FMG/kg) | - | 1 292 | 825 |
| Cost of pond construction (FMG/ha) | - | 10 450 000 | 14 080 000 |
| Cost of hired labour (FMG/ha) | 970 284 | 123 913 | 1 558 719 |
| Cost of family labour (FMG/ha) | 332 500 | 168 000 | 210 000 |
| Cost of management (FMG/ha) | 50 000 | 30 000 | 30 000 |
| Land tax (FMG/ha/year) | 117 453 | 112 319 | 64 732 |
Economic data and the results of the cost-return analysis are presented in Tables 2 and 3. Total variable costs are lowest for rice culture, which also shows low gross revenues and net returns compared to the other production systems. The total costs associated with rice-fish culture or fish culture are almost similar (around 1175 US$/year). Net returns from rice-fish culture however are 182 US$/year higher than for fish culture. This means that, although the initial investment needed for the preparation of the rice field for rice-fish culture is higher than for the construction of fish ponds, investment costs are recovered sooner as gross revenues are higher.
The benefit/cost ratio for rice, fish and rice-fish farming was 0.75, 0.34 and 0.51, respectively without imputed costs of land, labour and management. This indicates that increases in costs related to rice-fish culture and fish culture systems do not automatically result in proportionally higher returns.
Break-even points calculated for the yields at current costs and prices are presented in Table 4. Rice farmers should produce at least 2317 kg of rice/ha/year, fish farmers 516 kg of fish/ha/year and rice-fish farmers 594 kg of fish and 2766 kg of rice/ha/year to recover their total costs of production.
Discussion and conclusions
Financial returns
Of the three production systems analysed, rice-fish culture offers the highest net returns per hectare per year. Rice farmers interested in fish culture should be advised to start rice-fish culture instead of building ponds for fish culture. The rate of return on investment is higher for rice farming than for rice-fish farming, indicating that the additional investment cost offers relatively less returns. However, it should be noted that in most cases little opportunity exists for rice farmers to reach a rate of return on investment similar to that obtained from rice-fish culture by increasing investment in rice culture.
Table 3. Cost and returns analysis (per hectare per year) for rice, fish and rice-fish culture in Madagascar, 2001.
| Item | Ricea | Fisha | Rice-Fisha | |
| (US$/ha) | (US$/ha) | (US$/ha) | ||
| I. Gross Revenues (GR) | 858.63 | 1 565.66 | 1 746.90 | |
| II. Variable Costs (VC) | ||||
| Lime | 15.58 | 104.36 | 0.67 | |
| Organic fertilizer | 54.77 | 104.19 | 164.32 | |
| In-organic fertilizer | 47.91 | 5.03 | 149.58 | |
| Fingerlings | − | 415.91 | 133.33 | |
| Rice seeds | 108.04 | − | 22.11 | |
| Fish feeds | − | 275.04 | 54.77 | |
| Hired labour | 162.48 | 20.77 | 267.83 | |
| Opportunity cost of capitalb | 46.65 | 111.04 | 95.11 | |
| Total VC | 435.43 | 1036.34 | 887.72 | |
| III. Gross Margin (GM) | 423.20 | 529.32 | 859.18 | |
| IV. Fixed Costs (FC) | ||||
| Depreciation | 0 | 87.60 | 235.85 | |
| Land tax | 19.60 | 18.76 | 10.72 | |
| Total FC | 19.60 | 106.36 | 246.57 | |
| Opportunity costs of land | NA | NAd | NA | |
| Opportunity cost of unpaid labour | 55.70 | 28.14 | 35.18 | |
| Opportunity cost of unpaid managementc | 8.38 | 5.03 | 5.03 | |
| TOTAL COSTS | 519.10 | 1 175.86 | 1 174.49 | |
| Vi. NRLLM | 403.60 | 422.96 | 612.61 | |
| Vii. NRLM | 347.90 | 394.82 | 577.43 | |
| Viii. NRM | NA | NA | NA | |
| Viv. NRL | 339.53 | 389.80 | 572.41 | |
| VI. B/C with imputed opportunity costs of land, labour and management | 0.89 | 0.37 | 0.54 | |
| VI. B/C without imputed opportunity costs of land, labour and management | 0.75 | 0.34 | 0.51 | |
a Exchange rate: USD 1 = FMG 5970 (Malagasy franc, 2001)
b Calculated on the basis of interest rate on savings = 12 percent.
c Calculated on the basis of manager's salary per month = FMG 300 000.
d NA = no data available.
Investments in land, capital and labour
Farmers who initiated rice-fish culture are generally the better-off farmers, who have access to more land (0.4 ha vs 0.2 ha for rice farmers). However, the analysis shows that the net returns of the smaller farms (300–400 m2 of rice-fish field) is higher per m2 than of larger farms. Understocking of fingerlings by the larger farms might be an important reason for the relatively smaller returns.
Current problems related to land ownership also negatively affect the investments made by farmers in rice fields and inputs. Much of the land is not privately owned; inheritance processes are complicated and often only oral agreements on land use are made. Short-term thinking and fewer concerns about long-term environmental benefits are a consequence of this situation.
Table 4. Break-even analysis for rice, fish and rice-fish farming activities in Madagascar (2001).
| Rice | Fish | Rice-Fish | |
| Break-even yield (kg/ha/year) | 2316.6 | 516.2 | NAa |
| Break-even price (FMG/kg) | 835.9 | 10 557.5 | NAa |
a NA - calculation not possible with the data available.
Initial capital investment needed to start rice-fish culture activities is relatively high for the poor rice farmers; the investment equals the average net returns of 6 years of rice farming. This may be a high hurdle for entering this activity. As information on credit access, collaterals, interest rates and repayment details was not collected, it is not known which financial opportunities and constraints are connected to obtaining loans for rice-fish culture or fish culture.
Because rice-fish culture needs considerably higher labour inputs than fish pond culture and rice culture, it seems more attractive to larger families/households than to small ones. For poor farming households with a small labour force who are already active in rice, cassava, sweet potato, fruits, maize and soybean cultivation, fish culture in rice fields is another opportunity to make ends meet. Farmers already relying much on hired labour in rice culture are expected to be more willing to introduce fish in their rice fields as the additional increase in costs will be less.
Production
Rice yields are higher in the rice-fish system than in the rice system, indicating that fish culture in a rice field can increase the production per hectare2. Rice-fish culture can thus provide an additional contribution to food security at household level and will also support the household income when part of the fish produced is sold. The reduction in insect pests and weeds is an important indirect benefit of cultivating fish in rice fields, and might be one of the reasons for this higher rice production. Recycling of nutrients by the fish may be another.
Individual fish growth levels are higher in the rice-fish production system than in the fish pond culture system as a result of better growing conditions. Bad experiences when trying other culture practices are causing high levels of non-acceptance of new techniques/practices by farmers, which influence the introduction and spread of rice-fish culture negatively.
Risk
Rice-fish culture seems to be a less risky activity than rice and/or fish culture alone as none of the rice-fish farmers interviewed incurred losses, in contrast to 30 percent of the rice-farmers and 20 percent of the fish farmers (Appendix 3). However, droughts and floods can cause financial disasters, as cyclone Gretelle showed in 1997, especially to the poorer part of the rice-fish farmers and to those who have just entered rice-fish farming and have invested a considerable part of their income in this activity.
Stocking a rice field that is not located next to the farm house with fish is risky, as rural poverty leads to fish theft (especially near harvest time) and jealousy-driven sabotage activities. Moreover, traditional cultural and social structures in farming communities and individual families cause skimming of the benefits and result in reduced opportunities for investments in, e.g., rice-fish culture.
Market prices of fish fluctuate considerably over the year. Harvests of different rice-fish culture farms entering the market more or less at the same time will most likely influence the price negatively. Farmers generally cannot postpone selling the fish once the dry season starts or when the fields need to be prepared for the next season, and therefore must accept the current market price. Fish pond operators are less susceptible to drought and therefore a bit more flexible in the timing of harvesting and marketing of their fish.
References
FAO. 2002a. FAO Fishstat Plus database: total production 1950–2000 (available at: http:// www.fao.org/fi/statist/FISOFT/FISHPLUS.asp).
FAO. 2002b. FAO Fishstat Plus database: commodities production and trade 1976–1999.(available at: http://www.fao.org/fi/statist/ FISOFT/FISHPLUS.asp).
Razafitseheno, G. 2001. Aquaculture commerciale de crevettes à Madagascar. In Promotion of sustainable commercial aquaculture in Sub-Sahara Africa: experiences of selected developing countries. FAO Fisheries Circular 971. Rome, FAO (in French).
Remanevy, E.M. 1999. Situation des Pêches a Madagascar: les besoins et mesures d’aménagement préconises. ACP-EU Training, Country Report Madagascar (available at http://www.fishbase.org/training/countryreports/dakar/madagascar.hm).
Appendix 2
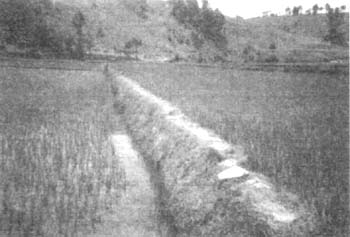
Photographs of the three production systems in Madagascar: a)rice culture; b)rice-fish culture; and c)pond fish culture (all photos by Mr E.Randimbiharimanana).
 | a) Rice culture |
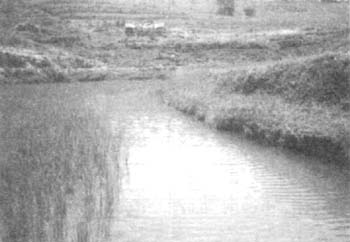 | b) Rice-fish culture |
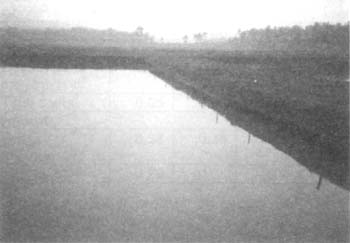 | c) Pond fish culture |
Appendix 3
A. Bio-economic data of ten rice culture farms in Madagascar, 2001
| Farm no. | 1 | 2 | 3 | 4 | 5 | 6 | 7 | 8 | 9 | 10 | Avg. |
| Main biological parameters | |||||||||||
| Field size (m2) | 1100 | 3000 | 1600 | 1000 | 3200 | 7000 | 2500 | 400 | 400 | 1000 | 2120 |
| Seed1 | 0.02 | 0.05 | 0.01 | 0.08 | 0.10 | 0.15 | 0.13 | 0.13 | 0.13 | 0.12 | 0.09 |
| In-organic fertilizer1 | - | - | - | 0.05 | 0.04 | - | - | - | - | - | 0.01 |
| Organic fertilizer1 | - | 0.08 | 1.78 | 1.40 | 1.46 | 0.14 | 0.60 | 0.63 | 0.25 | 0.50 | 0.68 |
| Length of growing cycle2 | 5 | 5 | 5 | 5 | 5 | 5 | 5 | 4 | 4 | 5 | 5 |
| Gross yield1 | 0.27 | 0.17 | 1.03 | 0.30 | 0.59 | 0.21 | 0.30 | 0.50 | 0.75 | 0.60 | 0.47 |
| Main economic parameters | |||||||||||
| Costs | |||||||||||
| Cost of seed3 | 0.01 | 0.02 | 0.00 | 0.01 | 0.02 | 0.04 | 0.03 | 0.03 | 0.03 | 0.02 | 0.02 |
| Cost of in-organic fertilizer3 | - | - | - | 0.03 | 0.02 | - | - | - | - | - | 0.01 |
| Cost of organic fertilizer3 | - | 0.00 | 0.04 | 0.02 | 0.02 | 0.00 | 0.00 | 0.01 | 0.00 | 0.00 | 0.01 |
| Cost of hired labour3 | - | 0.01 | 0.01 | 0.06 | 0.02 | 0.01 | 0.01 | 0.08 | 0.04 | 0.01 | 0.03 |
| Other costs3 | 0.00 | 0.01 | 0.01 | 0.07 | 0.02 | 0.01 | 0.01 | 0.07 | 0.04 | 0.03 | 0.03 |
| Total costs3 | 0.01 | 0.04 | 0.06 | 0.19 | 0.10 | 0.06 | 0.05 | 0.18 | 0.11 | 0.06 | 0.09 |
| Returns | |||||||||||
| Gross revenue3 | 0.09 | 0.06 | 0.22 | 0.04 | 0.10 | 0.05 | 0.07 | 0.11 | 0.16 | 0.12 | 0.10 |
| Net revenue3 | 0.08 | 0.02 | 0.14 | -0.15 | 0.00 | -0.01 | 0.02 | -0.07 | 0.05 | 0.06 | 0.01 |
B. Bio-economic data of ten fish culture farms in Madagascar, 2001
| Farms: | 1 | 2 | 3 | 4 | 5 | 6 | 7 | 8 | 9 | 10 | Av. |
| Main biological parameters | |||||||||||
| Pond size (m2) | 1000 | 200 | 4500 | 100 | 100 | 800 | 100 | 100 | 150 | 168 | 722 |
| Stocking density (fingerling/m2) | 1 | 1 | 1.5 | 0.3 | 2.4 | 2 | 1 | 0.5 | 0.66 | 1.19 | 1.16 |
| Weight at stocking (g/fingerling) | 3 | 3 | 8 | 4 | 4 | 5 | 6 | 6 | 7 | 7 | 5 |
| Lime1 | - | - | 0.03 | - | - | 0.50 | - | 0.02 | - | - | 0.06 |
| Feed1 | - | 0.4 | 0.03 | 0.07 | 1 | 0.63 | 0.2 | 0.1 | 0.1 | 0.15 | 0.27 |
| In-organic fertilizer1 | - | - | - | - | - | - | - | 0.06 | 0.01 | - | 0.01 |
| Organic fertilizer1 | 0.75 | 1.25 | 0.6 | - | - | 0.63 | 0.3 | 0.5 | 2.67 | 1.79 | 0.85 |
| Length of growing cycle2 | 10 | 9 | 7 | 6 | 9 | 8 | 8 | 6 | 8 | 9 | 8 |
| Gross yield1 | 0.133 | 0.152 | 0.018 | 0.036 | 0.378 | 0.094 | 0.090 | 0.080 | 0.117 | 0.161 | 0.126 |
| Weight at harvest (g/fish) | 190 | 190 | 100 | 180 | 250 | 110 | 180 | 200 | 250 | 180 | 183 |
| Main economic parameters | |||||||||||
| Variable Costs | |||||||||||
| Cost of fingerlings3 | 0.04 | 0.03 | 0.06 | 0.01 | 0.10 | 0.08 | 0.03 | 0.01 | 0.02 | 0.04 | 0.04 |
| Cost of feed3 | - | 0.03 | 0.00 | 0.02 | 0.13 | 0.25 | 0.03 | 0.03 | 0.03 | 0.04 | 0.06 |
| Cost of in-organic fertilizer3 | - | - | - | - | - | - | - | 0.03 | 0.01 | - | 0.00 |
| Cost of organic fertilizer3 | 0.01 | 0.01 | 0.01 | - | - | 0.01 | 0.01 | 0.00 | 0.04 | 0.02 | 0.01 |
| Cost of hired labour3 | 0.00 | 0.00 | 0.00 | 0.01 | - | 0.00 | 0.01 | 0.02 | 0.01 | 0.01 | 0.01 |
| Other costs3 | 0.01 | 0.00 | 0.01 | 0.00 | 0.00 | 0.09 | 0.00 | 0.00 | 0.00 | 0.00 | 0.01 |
| Fixed costs | |||||||||||
| Cost of pond construction4 | 0.01 | 0.07 | 0.00 | 0.15 | 0.27 | 0.04 | 0.12 | 0.09 | 0.10 | 0.15 | 0.10 |
| Total costs4 | 0.05 | 0.07 | 0.08 | 0.05 | 0.24 | 0.43 | 0.09 | 0.09 | 0.11 | 0.12 | 0.13 |
| Returns | |||||||||||
| Gross revenue3 | 0.33 | 0.38 | 0.04 | 0.06 | 0.82 | 0.20 | 0.23 | 0.20 | 0.29 | 0.33 | 0.29 |
| Net revenue3 | 0.28 | 0.31 | -0.04 | 0.01 | 0.58 | -0.23 | 0.14 | 0.11 | 0.18 | 0.21 | 0.16 |
C. Bio-economic data of ten rice-fish culture farms in Madagascar, 2001
| Farms: | 1 | 2 | 3 | 4 | 5 | 6 | 7 | 8 | 9 | 10 | Av. |
| Main biological parameters | |||||||||||
| Field size (m2) | 4000 | 9000 | 20000 | 4000 | 2000 | 400 | 1500 | 1200 | 2400 | 300 | 4480 |
| Stocking density (fingerling/m2) | 0.70 | 0.50 | 0.40 | 0.50 | 0.15 | 0.50 | 0.27 | 0.40 | - | 1.00 | 0.44 |
| Seed1 | 0.01 | 0.02 | 0.01 | 0.01 | 0.01 | 0.01 | 0.01 | 0.01 | 0.01 | 0.01 | 0.01 |
| Weight at stocking (g/fingerling) | 5 | 3 | 5 | 5 | 5 | 5 | 20 | 20 | 10 | 20 | 10 |
| Feed1 | 0.13 | 0.07 | - | 0.14 | 0.02 | 0.05 | 0.01 | 0.03 | 0.01 | 0.01 | 0.05 |
| In-organic fertilizer1 | - | 0.05 | 0.03 | 0.04 | - | - | - | 0.02 | - | - | 0.01 |
| Organic fertilizer1 | 2.50 | 1.40 | 2.10 | 1.46 | 1.25 | 1.25 | 0.67 | 0.42 | 0.63 | - | 1.17 |
| Length of growing cycle2 | 5 | 4 | 6 | 6 | 5 | 5 | 5 | 5 | 5 | 6 | 5 |
| Gross rice yield1 | 0.30 | 0.30 | 0.60 | 0.59 | 0.34 | 0.38 | 0.30 | 0.42 | 0.15 | 0.83 | 0.42 |
| Gross fish yield1 | 0.125 | 0.081 | 0.061 | 0.086 | 0.020 | 0.113 | 0.033 | 0.063 | - | 0.133 | 0.07 |
| Weight at harvest (g/fish) | 330 | 250 | 125 | 375 | 300 | 300 | 250 | 200 | 250 | 200 | 258 |
| Main economic parameters | |||||||||||
| Variable costs | |||||||||||
| Cost of fingerlings3 | 0.02 | 0.01 | 0.01 | 0.01 | 0.01 | 0.01 | 0.01 | 0.02 | - | 0.03 | 0.01 |
| Cost of feed3 | 0.03 | 0.01 | - | 0.01 | 0.00 | 0.00 | 0.00 | 0.01 | 0.00 | 0.00 | 0.01 |
| Cost of in-organic fertilizer3 | - | 0.03 | 0.02 | 0.02 | - | - | - | 0.01 | - | - | 0.01 |
| Cost of organic fertilizer3 | 0.05 | 0.02 | 0.02 | 0.02 | 0.01 | 0.01 | 0.00 | 0.00 | 0.01 | - | 0.01 |
| Cost of hired labour3 | 0.01 | 0.04 | 0.01 | 0.04 | 0.02 | 0.02 | 0.03 | 0.04 | 0.03 | 0.04 | 0.03 |
| Other costs3 | 0.01 | 0.01 | 0.02 | 0.01 | 0.01 | 0.00 | 0.01 | 0.01 | 0.00 | 0.01 | 0.01 |
| Fixed costs | |||||||||||
| Cost of field preparation4 | 0.03 | 0.01 | 0.03 | 0.03 | 0.04 | 0.00 | - | - | - | - | 0.01 |
| Total costs3 | 0.15 | 0.13 | 0.11 | 0.14 | 0.09 | 0.04 | 0.05 | 0.10 | 0.04 | 0.08 | 0.09 |
| Returns | |||||||||||
| Gross revenue3 | 0.38 | 0.24 | 0.19 | 0.24 | 0.11 | 0.38 | 0.12 | 0.20 | 0.05 | 0.40 | 0.23 |
| Net revenue3 | 0.23 | 0.11 | 0.08 | 0.10 | 0.02 | 0.34 | 0.07 | 0.10 | 0.01 | 0.32 | 0.14 |
1 Kg per m2 & per production cycle;
2 Months;
3 US$ per m2 & per production cycle;
4 US$ per m2 (note: as the cost of field preparation is spread over ten years the effect on total cost is
minimal here).
![]()
![]()
![]()