![]()
![]()
![]()
The Farm Accountancy Data Network (FADN) forms part of Chapter 7 (Agriculture) of the acquis. It has existed since 1965. Data are collected at the holding level on sources of revenue, costs, inputs, outputs and employment for a single accounting year of 12 consecutive months. Box 1 identifies the principal data collected. This is used to generate standard gross margins (SGMs). The SGM is an estimate of the income generated by farming enterprises and is the value of the output less the variable costs directly attributable to the enterprise. In other words, it measures the contribution the enterprise makes to the payment of overhead costs and farm profits. Farm income can be derived from this by deducting overheads, payments for external resources, depreciation and taxes, and adding in grants and subsidies, using the model set out in Figure 1. The data exclude any non-farming activities of the holder or the holder's family, other than forestry and tourism connected with the farm. This exclusion means that FADN does not provide information on standards of living of agricultural households, except where those households derive their entire income from the holding.
FADN is concerned with commercial farms. Regulations define the minimum size of holding considered to be commercial, rather than part-time or subsistence. These vary between Member States and currently range from 1 European size unit (ESU) in Cyprus to 16 ESU in the United Kingdom (excluding Northern Ireland). One ESU equals 1 200 euros of SGM. The Central and Eastern European countries that joined the EU in 2004 were given thresholds of 2 ESU, except for the Czech Republic (4 ESU) and Slovakia (6 ESU).
| BOX 1 Principal information collected by FADN | |
| • | Production of crops |
| • | Labour input |
| • | Number and value of animals and livestock purchases and sales |
| • | Grants and subsidies |
| • | Taxes |
| • | Interest and .nance charges |
| • | Costs of paid labour, contract work, fuels, feedstuffs, seeds, insurance, electricity, water |
| • | Land and buildings |
| • | Investment and depreciation |
| • | Machinery and equipment |
| • | Stocks and working capital |
| • | Debts |
| • | Quotas |
| • | Area under different land tenures |
| FIGURE 1 Income model in FADN | |
| Total output by product (changes in agricultural stock + sales + farmhouse consumption + farm use) | |
| - | |
| Intermediate consumption of inputs produced on the holding used in the production of other outputs | |
| + | |
| Farm subsidies | |
| - | |
| Balance of taxes and value added tax | |
| = | |
| Gross farm income | |
| - | |
| Depreciation | |
| = | |
| Farm net value added | |
| + | |
| Investment grants and subsidies | |
| - | |
| Wages, rents and interest paid | |
| = | |
| Family farm income | |
A substantial amount of accounting data and information about inputs and outputs is required by FADN from each farm, so that detailed analysis of farm accounts is necessary. Data can only be collected from a sample of farms because of the complexity of the information required. The sample is stratified by region, economic size and type of farming to try to ensure that it is representative. It is intended to represent more than 90 percent of theagriculturalproductionintheEU.Although FADN is managed by the Commission, the actual data collection is undertaken by a liaison agency in each Member State. They are responsible for the selection of the farms in the sample, the accuracy of the data recorded and the transmission of data to the Commission.
FADN collects data about the UAA and the proportion that is owned, rented and sharecropped (see Box 2). The UAA comprises land under arable, grassland and permanent pasture, and permanent crops.
The analyses that are possible include those between land tenure and farming incomes, types of production, sizes of farm, the amount of bank borrowing undertaken and net worth. For example, Figure 2 makes use of data from the British Farm Business Survey to show that owner-occupied and tenanted farms in the sample had similar monetary values of crops and trading livestock in their closing balance sheets for 2003/04, but the external liabilities of the tenanted farms represented a significantly higher proportion of their total assets. The reason for this was the amount of land and buildings in the closing balance sheets of the owner-occupied farms. This shows the greater potential for raising external loan capital of owner-occupied farms and their consequential ability to take advantage of opportunities for growth and diversification. The detailed information collected from each farm makes FADN a very rich source of data that permits analyses that would otherwise not be possible.
| BOX 2 Definitions of land tenure used in FADN |
| UAA in owner occupation Includes owned land, land for which the partners are tenants for life or leaseholders and land leased to others ready for sowing. |
| Rent UAA Land worked by a person holding a tenancy for which the rent in cash or kind is generally fixed in advance and does not normally vary with farming results. |
| UAA in sharecropping Land farmed on the basis of a sharecropping agreement or farmed jointly with the grantor on similar terms. |
A number of issues have arisen with FADN and the data derived from it, which have implications for the extent to which the data can be relied upon. They are not exclusive to the countries of Central and Eastern Europe, but are applicable to the whole of the EU. The quality of FADN has been reviewed by the EU’s Court of Auditors (2003). The United Kingdom and Denmark have also examined the quality of the statistics they provide for FADN (MAFF, 2000a; University of Hull, 2000; Sørensen, 1999). The main issues are concerned with how representative the sample is and the quality of the sampling process. Specifically, there are questions about:
| FIGURE 2A Value of crops and trading livestock in United Kingdom farm closing balance sheets, 2003/04 |
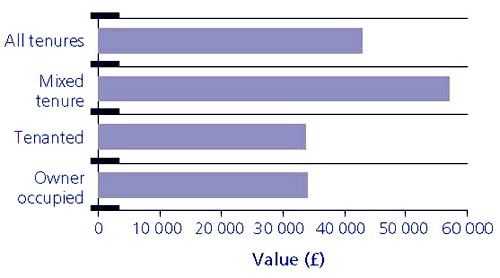 |
| Source: Defra, 2004. |
| FIGURE 2B External liabilities as percentage of total assets in United Kingdom farm closing balance sheets, 2003/04 |
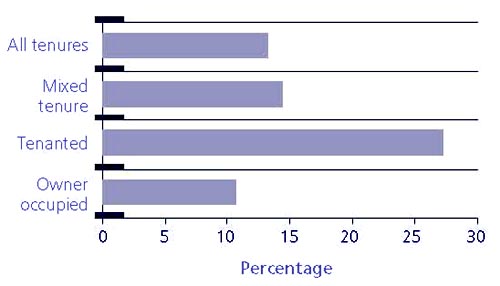 |
| Source: Defra, 2004. |
| FIGURE 2C Value of land and buildings in United Kingdom farm closing balance sheets, 2003/04 |
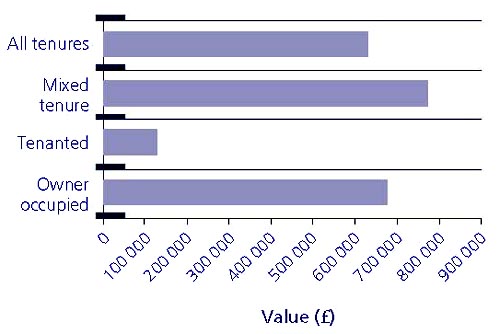 |
| Source: Defra, 2004. |
Table 2 shows the FADN sample as a proportion of the population of farms in each country in 2002/03. Four of the new Member States (Cyprus, Malta, Poland and Slovenia) did not contribute to FADN in that year. Most Member States used samples of under 3 percent and these are likely to be too small to provide robust data at the regional level. Therefore, FADN is likely to be of more value in producing data at a national level than at a subnational one.
The reliability of the data depends not only upon the sample size but also upon the frame from which the sample is selected. Many of the variables about which data are collected are highly skewed. The Court of Auditors discovered that different Member States use different methods for drawing samples, and has questioned whether the samples are drawn randomly. Participation in the survey is voluntary. In the United Kingdom, it has proved difficult to get farmers to take part; there is a 70 percent refusal rate and only 10 percent of the sample is replenished each year. Renewal rates differ among Member States. The commitment to provide data is demanding, and participants may need to gain experience of what is required before they are able to supply data of the requisite quality. Farmers tend to remain in the survey for long periods of time because of the difficulties in finding replacements. There may be biases in terms of those who are willing to participate - for example, the length of time a farm is in the sample could create an age bias. There may also be an element of self-selection in the sample, in which the individuals in the sample select themselves rather than being selected randomly.
TABLE 2
Farm Accountancy Data Network sample, 2002/2003
| Country | Sample (percent) |
| Austria | 2.3 |
| Belgium | 3.1 |
| Cyprus | … |
| Czech Republic | 10.2 |
| Denmark | 4.4 |
| Estonia | 6.3 |
| Finland | 1.8 |
| France | 2.0 |
| Germany | 3.0 |
| Greece | 0.8 |
| Hungary | 2.1 |
| Ireland | 1.0 |
| Italy | 2.6 |
| Latvia | 2.0 |
| Lithuania | 3.9 |
| Luxembourg | 25.9 |
| Malta - Netherlands | 1.7 |
| Poland | … |
| Portugal | 1.1 |
| Slovakia | 14.9 |
| Slovenia | … |
| Spain | 1.2 |
| Sweden | 2.5 |
| United Kingdom | 2.3 |
| EU | 1.9 |
Different types of farm accounts exist and could be used as the basis for FADN. The British survey, for example, uses business rather than tax accounts. This has the advantage of avoiding distortions introduced by tax avoidance strategies. The use of tax accounts can overcome problems with farmers refusing to cooperate because such accounts are available to governments. Different Member States use different dates of accounting years for FADN, so the results are not strictly comparable.
A growing number of farms are run by companies. The Court of Auditors has questioned whether FADN is representative of these or has a suitable methodology for reporting on them. It has questioned whether the profits of a limited company can be compared with the income of an individual farmer, which is likely to include returns on the labour, capital and land (s)he has supplied, whereas a company will buy the use of these. This is particularly pertinent because in 2001 the International Accounting Standards Committee adopted an accounting standard, IAS 41, on farm accounting. Accounting standards tend to have a greater impact on companies than on non-corporate bodies, such as family farms, which tend not to have to register their accounts. The introduction of IAS 41 has been controversial with regard to such features as the use of fair value rather than historical cost in valuing biological assets and the inclusion of holding gains on stocks as income. There have been questions raised as to the extent to which FADN is compatible with this standard (Elad, 2004).
Developing FADN has involved some of the Central and Eastern European countries in considerable work in creating the surveys of farms necessary to generate the data; in adopting the necessary legal framework; and in applying EU data standards, methods and concepts. Typical problems include:
![]()
![]()
![]()