![]()
![]()
![]()
Cassandra De Young
FAO, Fishery Policy
and Planning Division
October 2005
INTRODUCTION
The countries of the Indian Ocean[4] are characterized by a considerable diversity of economies, cultures, fishing practices, and fishing management approaches. Therefore, any attempt at cross-country comparisons or regional aggregation of information, without providing detailed explanations at the country level, is doomed to oversimplify the situation and possibly mislead the reader. Added to this are the difficulties inherent in different management environments stemming from lack of data and transparency, discrepancies between the status of management as formally reported and its true and real situation, definitional differences as to what constitutes large-scale or small-scale fisheries, and differences in whether a stock-based or gear-based definition of individual fisheries was applied. Therefore, this overview can be useful only in providing ‘first-glance’ insight into the region’s fisheries management regimes and their impacts on sustainability. For a deeper understanding of the historical, political and economic contexts behind the aggregated data presented in this Chapter, the reader is invited to refer to the regional and country reviews within this report.[5]
This chapter presents the results of the FAO State of World Marine Capture Fisheries Management (SOWMCFM) Questionnaire from thirty[6] Indian Ocean countries, completed during the end-2003 to beginning-2005 period. First, national-level aspects[7] of fisheries management are presented including related legislations, the costs and funding of fisheries management, stakeholder involvement and conflict management, and compliance and enforcement. The chapter then looks more specifically at the trends in the use of management tools within the top three (by volume) marine capture fisheries within the large-scale, small-scale, and recreational fisheries subsectors.[8] In addition, a brief summary of existing knowledge of Indian Ocean stocks is presented.
The information provided in the questionnaires are not official government responses but an attempt by each respondent to collect as much information as possible through published documents, personal communications with relevant stakeholders, and their own experiences in these fisheries. This approach permitted the country review author to provide information on the fisheries even where no official information existed.
FIGURE 1
|
NATIONAL MARINE FISHERIES FRAMEWORKS
In accordance with the principles of international law, as reflected in the relevant provisions of the 1982 United Nations Convention on the Law of the Seas (UNCLOS),[9] the countries of the region are responsible for regulating access to fisheries resources within their economic exclusive zone (EEZ) and “to ensure, through proper conservation and management measures, that the maintenance of these living resources are not endangered by over-exploitation”.
Legislative and political frameworks
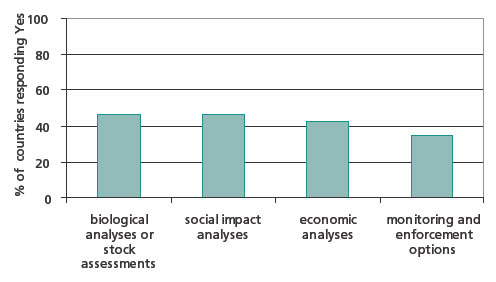
All countries within the region had specific legislation for the management of marine capture fisheries and almost all such legislation provided a fisheries management legal framework (93 percent of countries evaluated), but slightly fewer provided an administrative framework for such management (87 percent). However, the term ‘fisheries management’ was defined in only 24 percent of those countries responding and only 57 percent of the countries had laws and regulations designed to serve as a legal framework for fisheries management and fisheries management plans. In addition, only in a minority of cases did national legislations require that fisheries management decisions be based on at least one of the following analyses: biological analyses/stock assessments, social impacts analyses, economic analyses, or monitoring and enforcement analyses. Therefore, there was relatively little legal guidance on the processes for taking management measures and, hence, fisheries managers were often missing the interdisciplinary information required to develop proper management measures.[10]
In addition, participatory processes within fisheries management were formally practiced within 47 percent of the countries and, in most cases, this participation was limited to consultative management, where fisheries management stakeholders were consulted, but did not share management responsibility. Less infrequently were co-management structures, in which stakeholders share a large part of management responsibility.
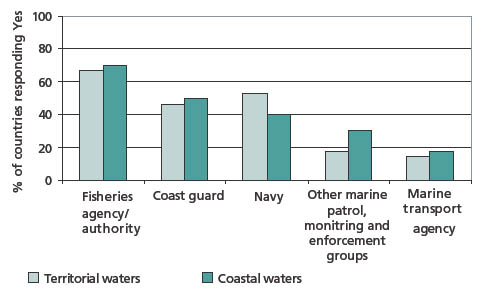
The legislation in most countries (90 percent) identified a single agency or other authority[11] with the responsibility for marine capture fisheries management at the national level[12]; however, these agencies/authorities either legally shared management responsibilities with other agencies (48 percent) and/or were further assisted by government or quasi-government agencies for their fisheries research (70 percent), to be further supported by universities. In many cases (70 percent), the fisheries agencies/ authorities were also supported by at least one other agency (e.g. navy or coast guard) for the monitoring and control of fisheries laws (Figure 2).
FIGURE 2
|
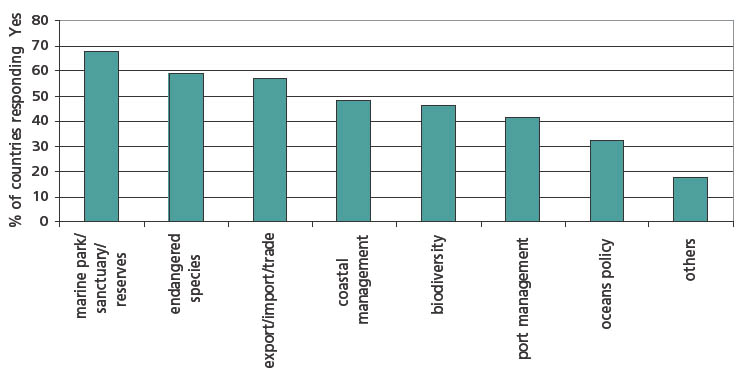
The policy framework in place within the region was more often than not development orientated, despite many fish stocks being considered at least fully exploited (FAO, 2005). When specific fisheries management objectives were provided for in the legislation (43 percent), the objectives tended to be split into either development-oriented or sustainability-oriented lines. Countries in the Red Sea and Arabian Gulf tended to have development-oriented objectives, those countries along the eastern rim of the Indian Ocean tended to specify sustainability criteria within the legislation; while those along the western rim tended not to have specific management objectives within their legislations (South Africa and Madagascar excluded). However, most countries fisheries management were affected by at least one other national legislation based on sustainability concepts (Figure 3).
FIGURE 3
|
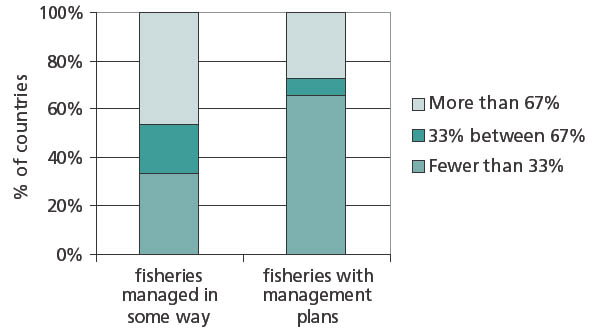
In only approximately 50 percent of the countries were more than 67 percent of the marine capture fisheries considered “managed in some way”[13] and, for those fisheries considered managed, the fisheries were more likely to be lacking any formal documented management plans (Figure 4). However, the perception within the countries is that the number of fisheries managed in some way has increased over the past ten years.
FIGURE 4
|
Costs and funding of fisheries management
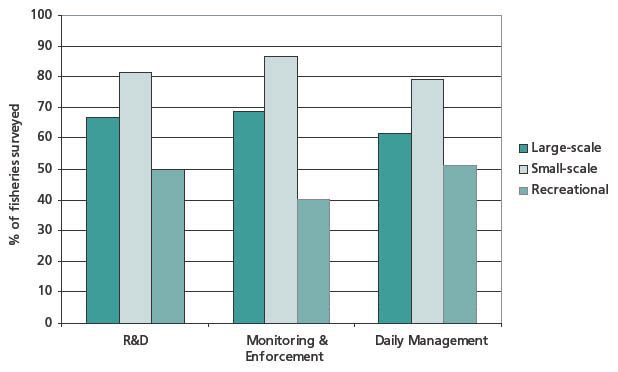
Budget outlays for fisheries management included, inter alia, funding for research and development, monitoring and enforcement, and daily administrative management. Only in approximately ten percent of the countries were these activities not covered in some way by national government funding.
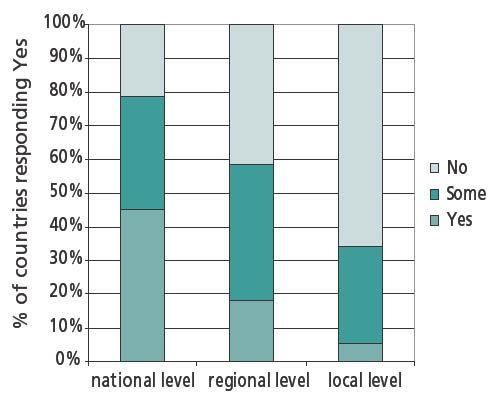
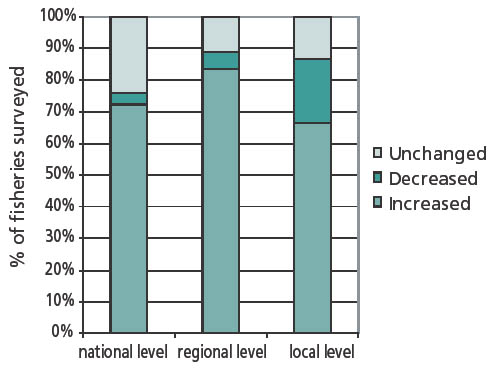
In most countries (90 percent), the costs of fisheries management were provided at least in part by national government funding; however, national funding sources tended to decrease as management moved toward regional and local levels (Figure 5). This trend was in contrast to the increased costs related to fisheries management at these levels (Figure 6), due in part to decentralization policies throughout the region.
FIGURE 5
|
FIGURE 6
|
Compliance and enforcement
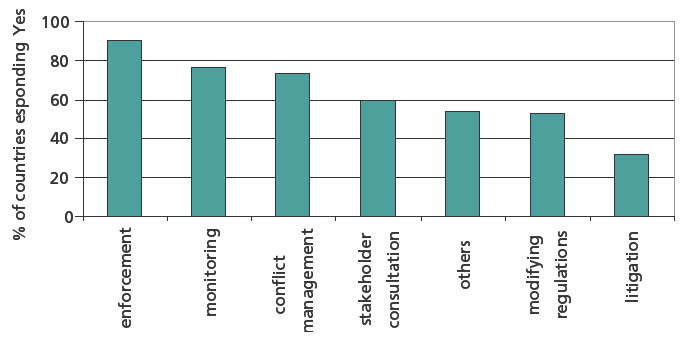
In most cases, the above-mentioned increases in management costs were associated with increased monitoring and enforcement activities but were also due to increased conflict management and stakeholder consultations (Figure 7). Linked to increased monitoring and enforcement is the perception that, over the last ten years, the numbers of infractions has increased in many countries (67 percent).
FIGURE 7
|
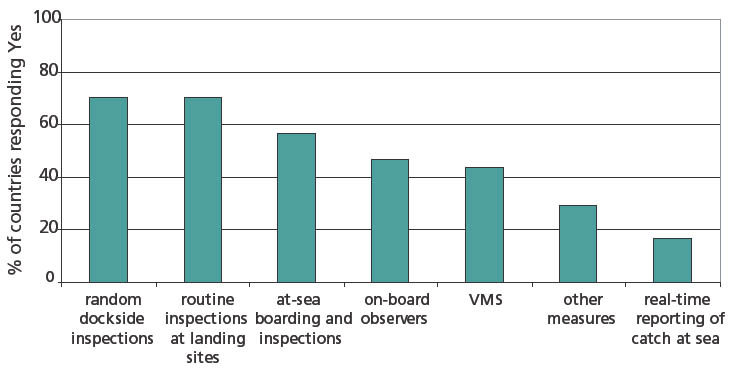
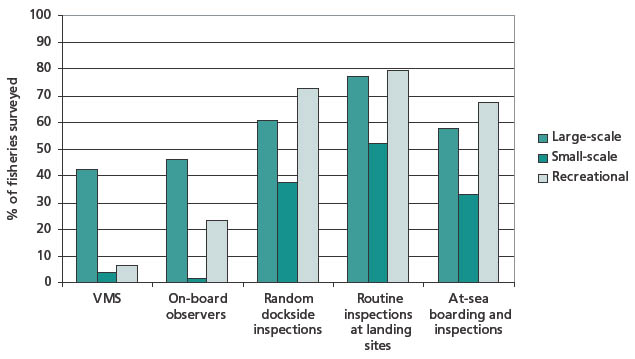
Compliance and enforcement tools within the region focused on inspections, whether on-land or at-sea. The use of additional tools, such as on-board observers or vessel monitoring systems (VMS) was less widespread within the region (Figure 8).
FIGURE 8
|
When faced with infractions, most countries relied on small fines or the revocation of fishing licences as deterrents; however, the perception within the vast majority of the region’s countries is that 1) the funding provided is not sufficient to enforce all fisheries regulations, 2) the penalties for non-compliance are not severe or high enough to act as deterrents, and 3) the risk of detection is too low to promote adherence with fisheries regulations.
REVIEW OF FISHERIES MANAGEMENT TOOLS IN USE WITHIN THE LARGEST MARINE CAPTURE FISHERIES
Within the 30 countries surveyed, 55 large-scale, 61 small-scale, and 18 recreational fisheries were identified as the top three largest fisheries by volume in each subsector (Appendix 1).[14] As the definitions for each subsector as well as whether a fishery was defined by gear or by species were left open to allow for relative definitions within each country, the resulting data should be interpreted loosely. However, the resulting trends have been grouped by subsector as they reflect common management issues across the countries and provide up-dated data at levels which are usually not collected within national and international data collection systems. Fisheries analysed within the questionnaires were limited to national fisheries within continental and jurisdictional waters; they exclude high-seas fishing and foreign fishing in exclusive economic zones (EEZ) under access agreements.
Basic data
When matched up with global comparisons of large-scale versus small-scale fisheries (e.g. Thomson, 1980; Berkes et al., 2001; Hart and Reynolds, 2002), the relative sizes between the subsectors remained basically stable (Table 1). The small-scale fisheries involved over 2.5 times more participants (employed part-time or full-time or as subsistence) than the large-scale fisheries and total landings from the two subsectors were approximately equal in size.
TABLE 1
Basic data on the largest Indian Ocean fisheries
by subsector
| |
Large-scale |
Small-scale |
Recreational |
|
Number of participants |
1.6 million |
4.3 million |
90 0001 |
|
Total landings (tonnes) |
4 million |
4.2 million |
n.a. |
|
Number of vessels |
73 000 |
313 000 |
n.a. |
Notes: n.a. = not available.
Data are for the top three (by volume) fisheries for each subsector within 30 Indian Ocean countries. Indonesia and Malaysia include data from both Pacific and Indian Ocean fisheries.
1. Includes only 11 out of 18 fisheries identified due to lack of available data in the recreational fisheries.
The number of participants had increased over the previous ten-year period in most fisheries across the three subsectors (60, 66, and 77 percent of the fisheries, respectively) and had decreased in a smaller number of fisheries (34, 12, and 5 percent, respectively).
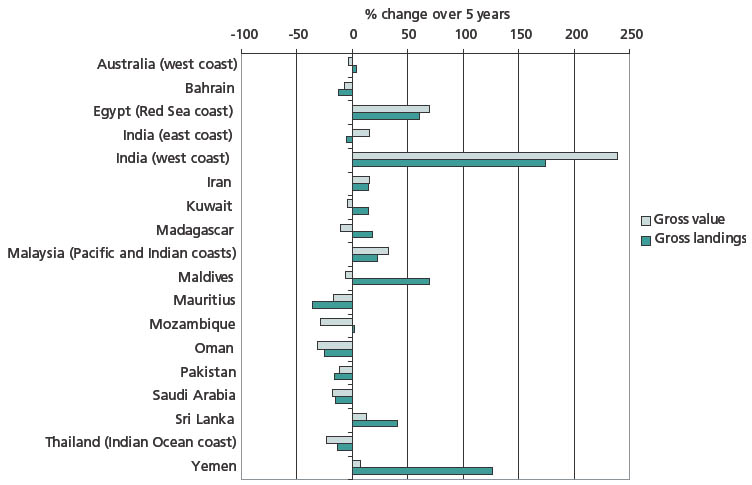
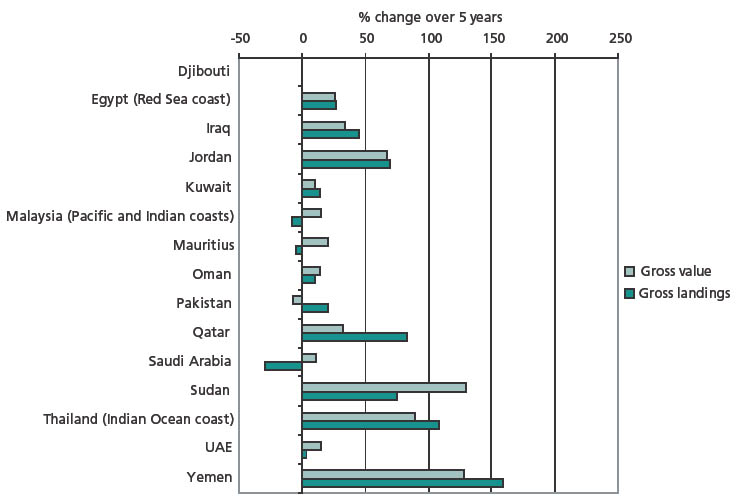
Directional changes over the previous five years in landings from the large-scale fisheries varied across the countries (Figure 9). Seven countries reported decreased trends in landings volumes; while eleven countries reported decreased trends in landing values. It is interesting to note that in six of these countries, trends in volumes and values moved in opposite directions over the five-year period. Most countries reported positive trends in both landings volumes and values within the small-scale sector and, when volumes and values went in opposite directions, volumes decreased while values increased (Figure 10). Changes in quality or price variations may explain this phenomenon.
FIGURE 9
|
FIGURE 10
|
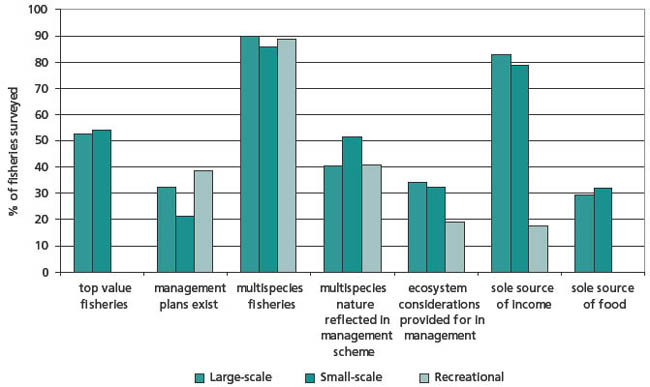
Although the fisheries were the largest fisheries in terms of volumes landed, these fisheries were the highest valued fisheries in only approximately 50 percent of the countries and in no case was recreational fisheries documented as a high value fisheries (Figure 11). Other trends were similar across the subsectors: fisheries-specific management plans were uncommon; most fisheries were multi-species but this aspect was not always accounted for within the management schemes; and explicit inclusion of ecosystem considerations was only occasionally made. In addition, although large-scale and small-scale fisheries activities provided the sole source of income in approximately 80 percent of the countries, fish and fish products provided the staple food source in 29 and 32 percent of the large-scale and small-scale fisheries, respectively.
FIGURE 11
|
Management tools in use within the largest fisheries
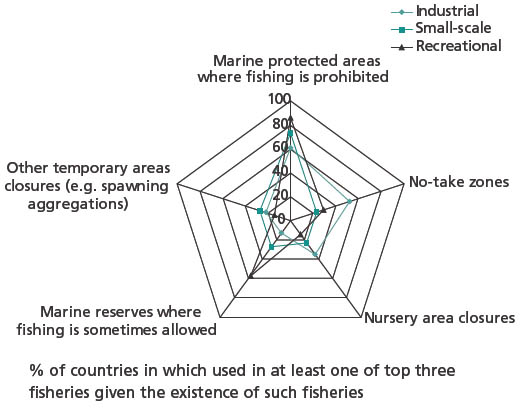
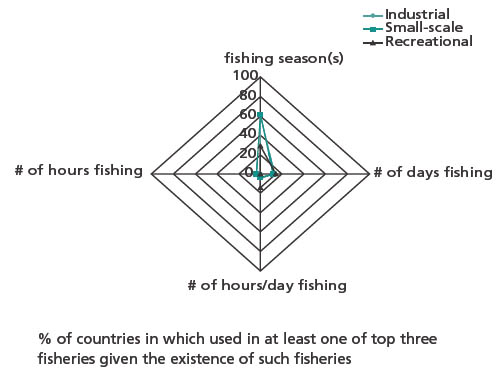
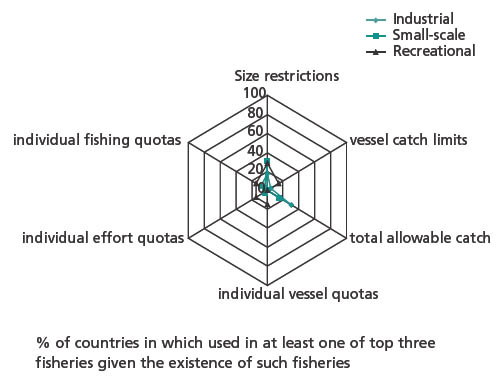
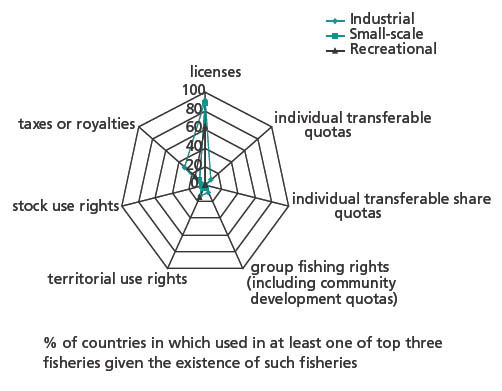
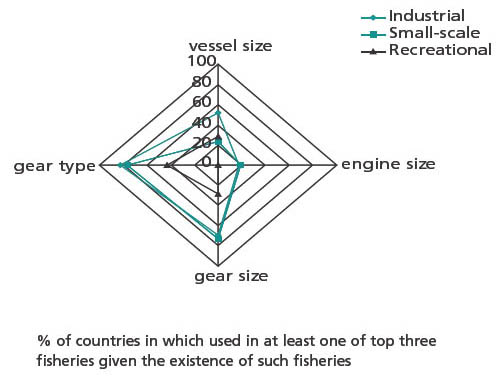
The toolkit of technical measures for fisheries management may be split into five groupings: 1) spatial restrictions, 2) temporal restrictions, 3) catch and size restrictions, 4) rights / incentive-adjusting restrictions, and 5) gear restrictions (Figures 12 - 16).
The results of the questionnaire bring to light certain tendencies within the Indian Ocean countries:
countries preferred the use of spatial (esp. marine protected areas and marine reserves) and gear restrictions (esp. type and size) over other technical measures for managing marine capture fisheries;
other than the issuance of fishing licences, very few incentive adjusting or rights providing mechanisms were used;
tools currently in use within the small-scale sector were, for the most part, established or increased within the last ten years; while those tools in use within the large-scale and recreational fisheries have not experienced many changes in use patterns with the exception of increased use in spatial restrictions; and
although recreational fisheries were active in at least ten countries in the region, few management measures are applied to these fisheries other than the establishment of marine protected areas and reserves and, less frequently, the granting of licences and the adoption of gear type restrictions.
FIGURE 12
|
FIGURE 13
|
FIGURE 14
|
FIGURE 15
|
FIGURE 16
|
Funding outlays and cost-recovery in fisheries management within the largest fisheries
Government funding outlays within the top three fisheries included, inter alia, research and development, monitoring and enforcement, and daily management. Coverage among the subsectors tended to focus on the small-scale and large-scale fisheries (Figure 17).
FIGURE 17
|
Monitoring and enforcement budgets reportedly increased in at least 50 percent of the fisheries throughout the three subsectors; however, budgets decreased within a third of the large-scale fisheries. Wide-spread use of various monitoring and enforcement mechanisms was reported throughout the large-scale fisheries; contrasted with a dependence on inspections, when used at all (maximum of 52 percent of fisheries), within the small-scale fisheries (Figure 18). For those recreational fisheries identified, the use of inspections appeared to be common in these countries. This reported lack of monitoring and enforcement within the small-scale subsector raises the question of the effectiveness of management tools and regulations reported above. The limited use (between 40 and 50 percent) of VMS and on-board observers within the large-scale sector also points to weak links within fisheries management for these fisheries.
FIGURE 18
|
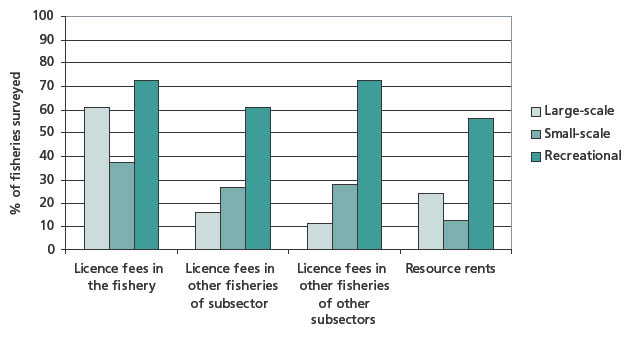
Fisheries management cost recovery mechanisms (Figure 19), other than licence fees, were uncommon within the large-scale and small-scale fisheries legislations. Interestingly, the use of licence fees and other resource rent recovery schemes were common within recreational fisheries legislations. This difference between the subsectors may reflect whether access to the resources is assumed as a right or as a privilege.
FIGURE 19
|
Participatory mechanisms and conflict management within the largest fisheries
Including stakeholders into the fisheries management process is a basic tenet of the FAO Code of Conduct for Responsible Fisheries in part to reflect multiple objectives, roles and responsibilities within each fishery and to foster compliance with any agreed upon management measures.
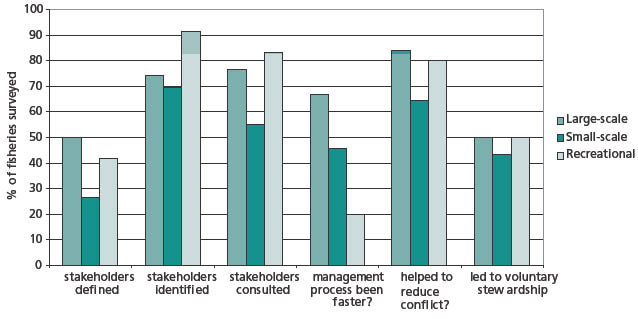
Although legal or formal definitions of those having an interest in the use and management of fisheries resources were not common, efforts had be made in most fisheries across the three subsectors to identify such stakeholders (Figure 20). In many cases, it was felt that arrangements had been made to consult these stakeholders and to work with them on the management of these fisheries; however, these sentiments were less strong within the small-scale subsector.
FIGURE 20
|
If stakeholders were part of the fisheries management decision-making process, the management process had often been sped up within the large-scale subsector but not necessarily within the small-scale sector and rarely within the recreational subsector. However, the participatory approach had led to a reduction in conflict within the fisheries and, in half of the fisheries, created incentives and reasons for stakeholders to voluntarily practice “responsible” fisheries stewardship.
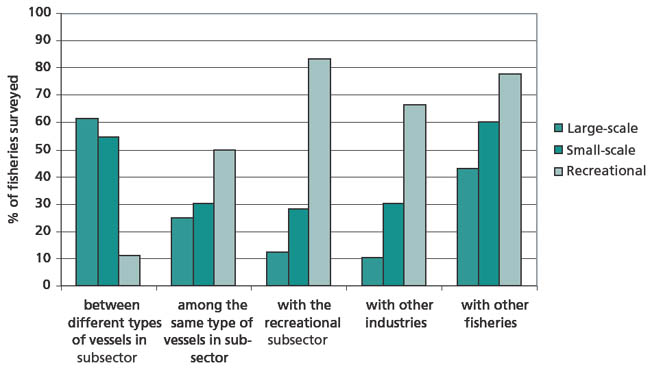
Although participatory approaches to management assisted in the reduction of conflict within and among the fisheries, there remained significant levels of conflict throughout the subsectors (69, 71, and 64 percent of the fisheries, respectively). Conflict within the large- and small-scale sectors was often caused by competition between different vessels categories or with other fisheries; while conflict within the recreational subsector tended to arise from competition with all other uses for the same area of water (Figure 21).
FIGURE 21
|
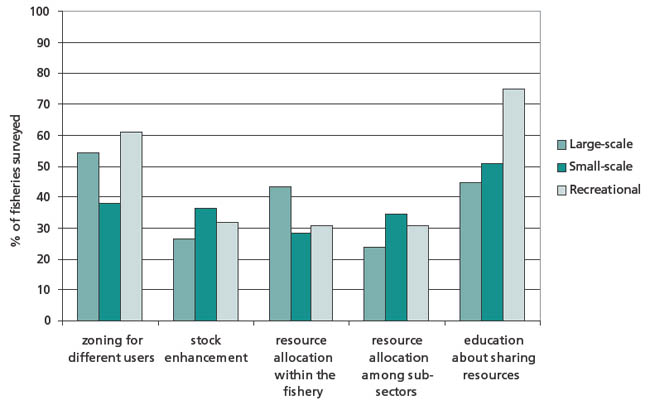
FIGURE 22
|
Conflict resolution processes were used on average within a third of the fisheries and included zoning for specific users, stock enhancement, resource allocation between and among the fisheries, and educational methods to sensitize users regarding the multiple-use nature of certain resources. There was little variation among the subsectors accept that sensitization methods were more common in the recreational subsector than elsewhere.
Fleet capacity management within the largest fisheries
It is commonly accepted that excessive fishing capacity contributes to overfishing, the degradation of marine fisheries resources, the decline of food production potential, and significant economic waste. Therefore, as part of the implementation of the Code of Conduct, countries have been urged to implement the International Plan of Action (IPOA) for the Management of Fishing Capacity (FAO, 1999). The first step in managing fishing capacity is to establish the current level of fishing activity within fisheries and to analyse each fishery for signs of excessive fishing inputs and overcapitalization. The second step would entail the preparation and implementation of national plans to effectively manage fishing capacity and to establish immediate actions for fisheries requiring urgent measures.
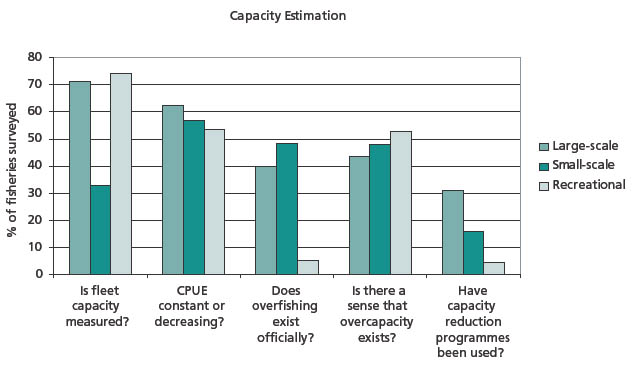
Within the Indian Ocean, fleet capacity was indeed measured in the majority of large-scale and recreational fisheries (Figure 23); however, capacity measurement within the small-scale subsector was often not undertaken. In addition, although there was often a “sense” that overcapacity existed within almost half of the fisheries, very few capacity reduction programmes were put into place to adjust for the levels of effort.
FIGURE 23
|
When put into place, the method of preference for reducing capacity levels was the purchase of fishing licences from the fishery followed by a less-used approach of buying out fishing vessels licensed to operate in the fisheries. It was felt that licence removal was an efficient means in immediately reducing any excess fishing capacity; while vessel buyouts were considered much less effective. In addition, these initial licence removals, when supported by ongoing licence purchases were often felt effective for ensuring that any excess fishing capacity did not return.
FIGURE 24
|
|
FIGURE 25
|
Funding for such capacity reduction programmes were generally supported through government funds but several instances occurred in which such programmes were paid for by participants within the fishery itself or, occasionally, by participants within other fisheries.
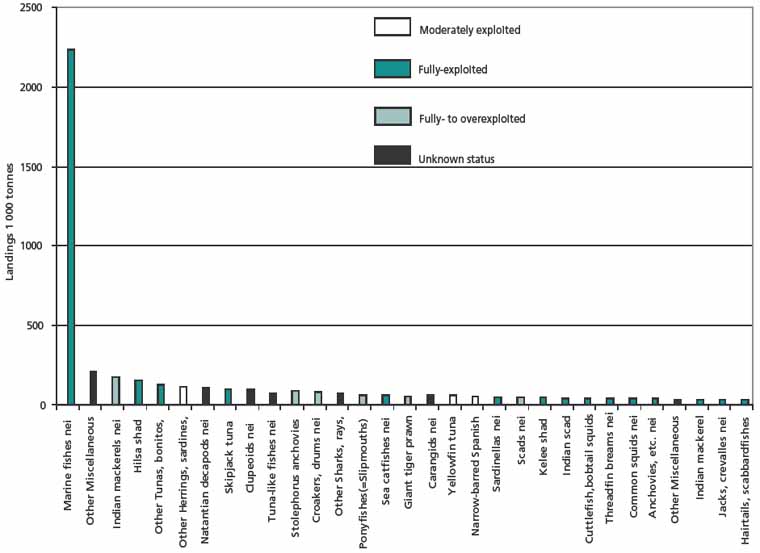
STATUS OF STOCKS IN THE INDIAN OCEAN
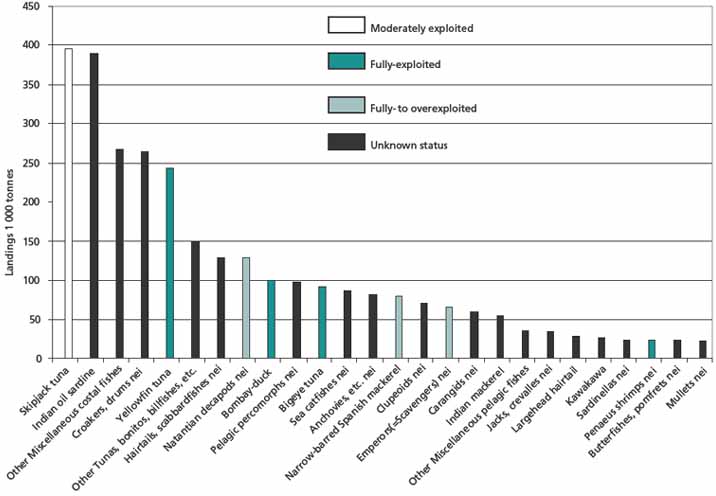
In 2005, the FAO published the Review of the State of World Marine Fishery Resources based on stock assessments and other complementary information available through 2004 (FAO, 2005). For the 47 stocks or species groups of the Indian Ocean for which there was adequate information to evaluate the state of the resources, 41 were determined to fall with the range of moderate-full exploited to full-overexploited (Appendix 2).[15] These levels signal little room for further expansion, in addition to the possibility that some, if not most, stocks might already be overexploited. One should also note the number of stocks for which it has not been possible to determine stock status.
It should also be noted that, within the sub-regional reviews included in this report, authors estimated more serious conditions for certain species than was portrayed at the larger statistical area used in the FAO report. This points to further need for precaution within the Indian Ocean, especially when the effects of illegal, illicit, and unreported (IUU) fishing on the stocks are difficult to ascertain and control.
SUMMARY AND CONCLUSIONS
The challenges regarding fisheries exploitation and management in the Indian Ocean countries are not uncommon to those in other regions:
Legislative reforms have improved the regulatory framework but application of such reforms has remained limited and lack of effective monitoring, control and surveillance (MCS) has undermined fisheries management.
Fisheries policies often remain development-driven and without consideration to economic, social, biological, and environmental sustainability criteria; however, examples of holistic management approaches exist within the region and experiences in these could prove useful for the region.
Conflicts between and among fisheries remain pervasive.
The number of small-scale vessels and fishers is high and, combined with the potential role of small-scale fisheries in poverty alleviation and prevention, management of these fisheries remains difficult to develop and implement.
Reliance on classical and costly stock assessment have limited the ability of countries to gather consistent stock data. Combined with the need for ‘hard’ data, fisheries planning capacities are often stalled at the status quo even whilst the qualitative data suggest that many stocks are fully- or over-exploited.
Socio-economic data are infrequently collected or not at all; therefore, the contribution of small-scale fisheries to human well-being, food security, and poverty alleviation and prevention is poorly understood and the impacts of potential management measures can not be evaluated throughout the three subsectors.
Information on shared and transboundary stocks is often missing or inadequate and relevant institutions arrangements are often missing.
Integration of stakeholders in the fisheries management process has increased but remained limited; leading to continued difficulties in managing fishing capacity within all subsectors but specifically within the small-scale subsector.
The multispecies nature of most fisheries has not been taken into consideration.
Clearly defined priorities of objectives for each fishery are lacking, which leads therefore to inappropriate planning and increased conflicts within and among the fisheries.
Actions to address these issues may include:
The introduction of adaptive and cost effective management strategies, based on strengthened management structures with well-defined, prioritized objectives;
The strengthening of the ecosystem approach to fisheries management;
The investigation of cost-effective data gathering methods for biological, economic, social, and environmental aspects of fisheries;
An effective enforcement of fishery laws and regulations;
A better control over growth in fishing fleet capacity;
A greater harmonization of the definition and application of laws and regulations, where appropriate;
The development of fisheries management plans with relevant stakeholders;
The development of national plans of action to address IUU and capacity issues;
An active participation in regional initiatives such as regional fishery bodies to assist in the control of IUU fishing, the harmonization of fisheries laws and regulations, and of the development of consistent management measures with respect to shared and transboundary stocks, and
A greater involvement of stakeholders in management with consideration given to co-management schemes, especially at the local level, requiring the creation or strengthening of organizations to represent fishers and other interests.
The countries of the Indian Ocean will need to continue in their development of sustainable fisheries management frameworks; addressing both international norms and agreements as well as adapting to each country’s specific situation and needs. Although there is no panacea for managing all fisheries, countries could benefit from the experiences of other countries in the same region, as well as elsewhere, and existing literature in the search for creative and cost-effective methods for managing fisheries.
In addition, regardless of the management framework chosen, if there is a lack of political will to implement the relevant laws and regulations and management measures, even perfectly designed frameworks will remain on the bookshelves.
Finally, a better understanding of the effects of implemented management measures on the fisheries (e.g. economic efficiency, social justice, and stock health) would greatly assist in the adaptive improvement of fisheries management.
REFERENCES
Berkes, F. et al. 2001. Managing Small-Scale Fisheries Alternative Directions and Methods. IDRC 2001 ISBN 0-88936-943-7.
Evans, D. & Grainger, R. 2002. Gathering data for resource monitoring and fisheries management. In: Hart & Reynolds Handbook of Fish Biology and Fisheries: Volume 2 Fisheries. Blackwell Publishing.
FAO. 1999. International Plan of Action for reducing incidental catch of seabirds in longline fisheries. International Plan of Action for the conservation and management of sharks. International Plan of Action for the management of fishing capacity. Rome, FAO. 1999. 26p. ISBN 92-5-104332-9
FAO. 2005. Review of the State of World Marine Fishery Resources. FAO Fisheries Technical Paper No. 457. Rome, 2005, 235 pp. ISBN 92-5-105267-0.
Hart, P. & Reynolds, J. 2002. Handbook of Fish Biology and Fisheries Volume 2 Fisheries, Blackwell Publishing.
Thompson, D. 1980. Conflict within the fishing industry. ICLARM Newsletter, 3(3), 3-4.
APPENDIX 1
Top three fisheries in the
large-scale, small-scale and recreational fisheries within the Indian Ocean
countries
|
Large-scale (commercial/industrial) |
|||
|
Australia (west coast) |
Western rock lobster |
Shark Bay and Exmouth Gulf shrimp |
Shark bay scallop |
|
Bahrain |
n/a |
|
|
|
Bangladesh |
Shrimp trawl |
Bottom trawl (fish) |
Mechanized gillnet fishery |
|
Comoros |
n/a |
|
|
|
Djibouti |
n/a |
|
|
|
Egypt (Red Sea coast) |
Purse seine |
Demersal trawl |
|
|
Eritrea |
Demersal trawl |
Pelagic |
Shrimp |
|
India (east coast) |
Shrimp |
Sardines |
Leiognathids |
|
India (west coast) |
Included in artisanal fisheries |
|
|
|
Indonesia (Pacific and Indian coasts) |
Longline |
Purse seine |
Shrimp nets |
|
Iran |
Kilka |
Demersal |
Pelagic |
|
Iraq |
n/a |
|
|
|
Jordan |
n/a |
|
|
|
Kenya |
Inshore prawn trawling |
Smaller scale reef fishery |
|
|
Kuwait |
Shrimp |
|
|
|
Madagascar |
Shrimp |
Bottom trawl (fish) |
Shrimp bycatch |
|
Malaysia (Pacific and Indian coasts) |
Trawl |
Purse seine |
|
|
Maldives |
Tuna |
Bait |
Shark |
|
Mauritius |
Shallow banks |
Demersal |
Tuna |
|
Mozambique |
Shrimp swallow water fisheries |
Deep shrimp fisheries (Gamba) |
Line fish (fish) |
|
Myanmar |
Commercial offshore |
|
|
|
Oman |
Demersal trawl |
Longline |
|
|
Pakistan |
Shrimp |
Tuna |
Demersal |
|
Qatar |
n/a |
|
|
|
Saudi Arabia |
Industrial shrimp |
Industrial trawl |
|
|
South Africa (east coast) |
Hake trawl |
Small pelagic |
Horse mackerel |
|
Sri Lanka |
Multiday |
Longline |
|
|
Sudan |
n/a |
|
|
|
Thailand (Indian Ocean coast) |
Trawl |
Purse Seine |
Gillnet |
|
UAE |
Purse seine |
|
|
|
Yemen |
Demersal trawl |
Cuttlefish |
|
|
Note: n/a = not applicable; n.a. = not available. |
|||
|
Small-scale, artisanal, lifestyle, subsistence, indigenous, customary |
|||
|
Australia (west coast) |
Mussels |
Bivalves |
Mullet |
|
Bahrain |
Shrimp and crab fishery |
Stake net fishery |
Fish trap fishery |
|
Bangladesh |
Estuarine set bag net fishery |
Trammelnet fishing |
Shrimp fry collection fishery |
|
Comoros |
Small-scale |
Subsistence |
|
|
Djibouti |
Mixed fisheries |
|
|
|
Egypt (Red Sea coast) |
Mixed fisheries |
|
|
|
Eritrea |
Demersal & pelagic |
Shrimp |
|
|
India (east coast) |
Included in large-scale fisheries |
|
|
|
India (west coast) |
Indian oil sardine |
Bombay duck |
Shrimp |
|
Indonesia (Pacific and Indian coasts) |
Gillnets |
Seine nets |
Trap |
|
Iran |
Kilka |
Demersal |
Pelagic |
|
Iraq |
Trawl fishery |
Gillnet fishery |
|
|
Jordan |
Mixed Gulf fisheries |
|
|
|
Kenya |
Inshore demersal fishery |
Small pelagic and sharks |
Crustaceans and molluscs |
|
Kuwait |
Shrimp |
Finfish |
Stake net (hadra) |
|
Madagascar |
Finfish |
Shrimp |
Crabs |
|
Malaysia (Pacific and Indian coasts) |
Drift & gillnet |
Hook & line |
Bag net |
|
Maldives |
Mixed reef fishery |
|
|
|
Mauritius |
Artisanal (Mauritius) |
Artisanal (Rodrigues) |
Inshore (St Brandon) |
|
Mozambique |
Beach seine |
Gillnet |
Line fishing |
|
Myanmar |
Coastal inshore |
|
|
|
Oman |
Demersal & pelagic |
Rock lobster |
Abalone |
|
Pakistan |
Demersal |
Small pelagic |
|
|
Qatar |
Finfish |
|
|
|
Saudi Arabia |
Arabian Gulf mixed fishery |
Red Sea mixed fishery |
|
|
South Africa (east coast) |
Traditional linefish |
West Coast rock lobster |
Beach seine |
|
Sri Lanka |
FRP 8’ -Boats (OBM) |
Traditional craft |
Beach seine |
|
Sudan |
Finfish |
Shrimps |
Mollusks |
|
Thailand (Indian Ocean coast) |
Small-scale gillnet |
Trap |
Hook & line |
|
UAE |
Fish trap |
Gillnet |
Stake net |
|
Yemen |
Demersal |
Pelagic |
Shrimp |
|
Note: n/a = not applicable; n.a. = not available. |
|||
|
Recreational fisheries, including non-consumptive use |
|||
|
Australia (west coast) |
Western rock lobster |
Abalone |
|
|
Bahrain |
n.a. |
|
|
|
Bangladesh |
n/a |
|
|
|
Comoros |
n/a |
|
|
|
Djibouti |
only limited recreational fishing |
|
|
|
Egypt (Red Sea coast) |
only limited recreational fishing |
|
|
|
Eritrea |
only limited recreational fishing |
|
|
|
India (east coast) |
only limited recreational fishing |
|
|
|
India (west coast) |
only limited recreational fishing |
|
|
|
Indonesia (Pacific and Indian coasts) |
Sport fishing |
|
|
|
Iran |
n/a |
|
|
|
Iraq |
n/a |
|
|
|
Jordan |
n/a |
|
|
|
Kenya |
Big game fishing beyond the reef |
Sport fishing within the reef |
Shore based sport fishing |
|
Kuwait |
n.a. |
|
|
|
Madagascar |
Sport Fishing |
|
|
|
Malaysia (Pacific and Indian coasts) |
n/a |
|
|
|
Maldives |
n/a |
|
|
|
Mauritius |
Sports (off lagoon) |
Recreational (lagoon) |
|
|
Mozambique |
Sport fishing |
|
|
|
Myanmar |
n/a |
|
|
|
Oman |
only limited recreational fishing |
|
|
|
Pakistan |
Billfish/tuna fishing |
Sport fishing (pelagic) |
Hand-line fishing (bottom fishing) |
|
Qatar |
Boat-based but no data |
|
|
|
Saudi Arabia |
only limited recreational fishing |
|
|
|
South Africa (east coast) |
Linefish |
whale watching |
Shark cage diving |
|
Sri Lanka |
n/a |
|
|
|
Sudan |
n/a |
|
|
|
Thailand (Indian Ocean coast) |
n/a |
|
|
|
UAE |
Large pelagic |
Demersal |
|
|
Yemen |
only limited recreational fishing |
|
|
|
Note: n/a = not applicable; n.a. = not available. |
|||
APPENDIX 2
State of exploitation of selected
species fished
|
Western Indian Ocean (FAO Statistical Area 51) |
||
|
Stock or species groups |
Main fishing countries in 2002 |
State of explotation* |
|
Costal Fisheries |
||
|
Bombay-duck |
India |
F |
|
Croakers, drums nei |
India, Pakistan |
? |
|
Emperors(=Scavengers) nei |
UAE, Saudi Arabia, Tanzania, Oman |
F/O |
|
Lizardfishes nei |
Egypt, Eritrea, India |
? |
|
Mullets nei |
Pakistan, India, Egypt |
? |
|
Sea catfishes nei |
India, Pakistan |
? |
|
Demersal Fisheries |
||
|
Demersal percomorphs nei |
Oman, Yemen, Kenya |
F |
|
Hairtails, scabbardfishes nei |
India, Oman |
|
|
Largehead hairtail |
Pakistan |
|
|
Herrings, sardines, anchovies |
||
|
Anchovies, etc. nei |
India, Pakistan |
? |
|
Clupeoids nei |
India, Pakistan, Iran |
? |
|
Dorab wolf-herring |
Pakistan |
? |
|
Indian oil sardine |
India, Oman, Pakistan |
? |
|
Sardinellas nei |
Tanzania, Egypt, UAE |
? |
|
Stolephorus anchovies |
UAE |
? |
|
Wolf-herrings nei |
India |
? |
|
Tunas, bonitos, billfishes, etc. |
||
|
Bigeye tuna |
China,Taiwan p. China, Other nei, Spain, France |
?F |
|
Kawakawa |
Iran, Maldives, Oman, India |
? |
|
Narrow-barred Spanish mackerel |
India, Madagascar, Iran, Pakistan |
F-O |
|
Skipjack tuna |
Maldives, Spain, France, Other nei |
M ? |
|
Tuna-like fishes nei |
India, Pakistan, Mozambique, Saudi Arabia |
|
|
Yellowfin tuna |
Spain, France, Other nei, Iran |
?F |
|
Other pelagic fishes |
||
|
Barracudas nei |
Pakistan, Oman, Yemen, India |
? |
|
Butterfishes, pomfrets nei |
India, Pakistan |
? |
|
Carangids nei |
India, Pakistan, Oman, Saudi Arabia |
? |
|
Chub mackerel |
Egypt |
? |
|
Indian mackerel |
India, Tanzania, Oman, Egypt |
? |
|
Indian mackerels nei |
Comoros, Seychelles |
? |
|
Jacks, crevalles nei |
India, Pakistan, UAE |
? |
|
Mackerels nei |
Mauritius, Saudi Arabia |
? |
|
Pelagic percomorphs nei |
Yemen, Oman |
? |
|
Pompanos nei |
India |
? |
|
Shrimps, prawns, etc. |
||
|
Indian white prawn |
|
F |
|
Jack-knife shrimp |
|
F |
|
Knife shrimp |
Mozambique |
F |
|
Natantian decapods nei |
India, Madagascar |
F-O |
|
Penaeus shrimps nei |
Mozambique, Pakistan, Saudi Arabia, Yemen |
F |
|
* (U) underexploited; (M) moderately exploited; (F) fully exploited;
(O) overexploited; (?) unknown |
||
|
Eastern Indian Ocean (FAO Statistical Area 57) |
||
|
Stock or species groups |
Main fishing countries in 2002 |
State of exploitation* |
|
Shads, etc. |
||
|
Chacunda gizzard shad |
Malaysia |
M |
|
Diadromous clupeoids nei |
Malaysia |
|
|
Hilsa shad |
Bangladesh |
F |
|
Indian pellona |
Malaysia |
|
|
Kelee shad |
India |
F |
|
Toli shad |
Indonesia |
|
|
Costal Fisheries |
||
|
Croakers, drums nei |
India, Thailand, Indonesia, Malaysia |
F-O |
|
Mullets nei |
Indonesia, India, Thailand, Malaysia |
|
|
Percoids nei |
India |
|
|
Ponyfishes(=Slipmouths) nei |
India, Indonesia |
F-O |
|
Sea catfishes nei |
India, Indonesia, Malaysia |
F |
|
Threadfin breams nei |
Thailand, Indonesia, Malaysia |
F |
|
Demersal Fisheries |
||
|
Hairtails, scabbardfishes nei |
Indonesia, India |
M-F |
|
Largehead hairtail |
Thailand, Malaysia |
M-F |
|
Snoek |
Australia |
|
|
Herrings, sardines, anchovies |
||
|
Anchovies, etc. nei |
Thailand, India |
F |
|
Clupeoids nei |
Sri Lanka, India, Australia |
|
|
Indian oil sardine |
India |
F |
|
Sardinellas nei |
Thailand |
F |
|
Stolephorus anchovies |
Indonesia, Malaysia |
F-O |
|
Tunas, bonitos, billfishes, etc. |
||
|
Kawakawa |
Malaysia, India, Thailand, Sri Lanka |
F |
|
Narrow-barred Spanish mackerel |
India, Indonesia |
M |
|
Seerfishes nei |
Thailand, Malaysia |
|
|
Skipjack tuna |
Indonesia, Sri Lanka |
M-F |
|
Tuna-like fishes nei |
Indonesia |
|
|
Yellowfin tuna |
Indonesia, Sri Lanka, China,Taiwan Province of China |
M |
|
Other Tunas, bonitos, billfishes, etc. |
|
F |
|
Other pelagic fishes |
||
|
Butterfishes, pomfrets nei |
India |
F |
|
Carangids nei |
Indonesia, Sri Lanka, India, Thailand |
|
|
Indian mackerel |
Thailand, India |
M-F |
|
Indian mackerels nei |
Indonesia, Malaysia, Thailand |
F-O |
|
Indian scad |
Thailand, Malaysia |
F |
|
Jacks, crevalles nei |
India, Indonesia, Malaysia |
F |
|
Scads nei |
Indonesia |
F-O |
|
Torpedo scad |
Thailand, Indonesia, Malaysia |
|
|
Sharks, rays, chimaeras, etc. |
||
|
Rays, stingrays, mantas nei |
Indonesia, Thailand, Malaysia |
M-F |
|
Silky shark |
Sri Lanka |
M-F |
|
Marine fishes not elsewhere identified |
||
|
Marine fishes nei |
Myanmar, India, Thailand, Bangladesh |
M-F |
|
Shrimps, prawns, etc. |
||
|
Banana prawn |
Indonesia, Thailand |
F-O |
|
Giant tiger prawn |
India, Indonesia |
F-O |
|
Natantian decapods nei |
Malaysia, Myanmar, Indonesia, India |
|
|
Penaeus shrimps nei |
Thailand, Australia |
F |
|
Sergestid shrimps nei |
Malaysia, Thailand |
M-F |
|
Squid, cuttlefish, octopuses |
||
|
Cephalopods nei |
India |
|
|
Common squids nei |
Thailand, Indonesia |
M-F |
|
Cuttlefish,bobtail squids nei |
Thailand, Malaysia, Indonesia |
M-F |
|
Octopuses, etc. nei |
Thailand, Malaysia |
M |
|
Various squids nei |
Malaysia, Australia |
|
|
* (U) underexploited; (M) moderately exploited; (F) fully exploited;
(O) overexploited |
||
|
[4] Including the Red Sea and
Persian Gulf. [5] Additional resources for the reader are the chapters concerning the Indian Ocean fisheries resources within the Review of the state of world marine fishery resources (FAO, 2005). [6] Questionnaire were received from Australia (west coast), Bahrain, Bangladesh, Comoros, Djibouti, Egypt (Red Sea coast), Eritrea, India (east coast), India (west coast), Indonesia (Pacific and Indian coasts), Iran, Iraq, Jordan, Kenya, Kuwait, Madagascar, Malaysia (Pacific and Indian coasts), Maldives, Mauritius, Mozambique, Myanmar, Oman, Pakistan, Qatar, Saudi, Arabia, Seychelles, South Africa (east coast), Sri Lanka, Sudan, United Republic of Tanzania, Thailand (Indian Ocean coast), UAE and Yemen. Questionnaires were not received for the Seychelles, Somalia, and Tanzania. [7] Includes inland and marine capture fisheries. [8] Also referred to as commercial/industrial, artisanal/lifestyle/subsistence/indigenous/customary fisheries, and recreational/sports fishing including non-consumptive uses, respectively. [9] Most countries of the region are either signatories of or Parties to the Convention. Exceptions include Eritrea and Jordan. See http://www.un.org/Depts/los/index.htm. [10] On these requirements, see Evans and Grainger, 2002. [11] Occasionally as a stand-alone authority or Fisheries Ministry but more often in the form of a Fisheries Department within an Agriculture/Livestock or Environment Ministry or a combined Agriculture/Fisheries Ministry. [12] Note that formal designation of a single agency or other authority responsible for fisheries management at the regional level within country or at the local level was less common: 48 percent and 37 percent, respectively. [13] According to the questionnaires, the concept of ‘managed’ was mostly inferred to mean 1) published regulations or rules for specific fisheries, 2) legislation about individual fisheries, and 3) interventions/actions to support specific management objectives. [14] For those countries bordering multiple oceans, only Indian Ocean fisheries are included. However, the information for Indonesia and Malaysia includes data from both Pacific and Indian Ocean fisheries. [15] Moderately exploited - exploited with a low level of fishing effort; believed to have some limited potential for expansion in total production. Fully exploited - operating at or close to an optimal yield level with no expected room for further expansion. Overexploited - exploited at above a level which is believed to be sustainable in the long term, with no potential room for further expansion and a higher risks of stock depletion/collapse. |
![]()
![]()
![]()