![]()
![]()
![]()
The state of fisheries for oceanic species (most if not all of which are forming highly migratory, straddling or high seas fish stocks) was assessed using the method developed by Grainger and Garcia (1996) to analyse worldwide historical catch data (updated and expanded in Garcia, de Leiva Moreno and Grainger, 2005). The method had also been applied to the eastern central Atlantic (Garibaldi and Grainger, 2004) and to the Cuban marine fisheries (Baisre, 2000).
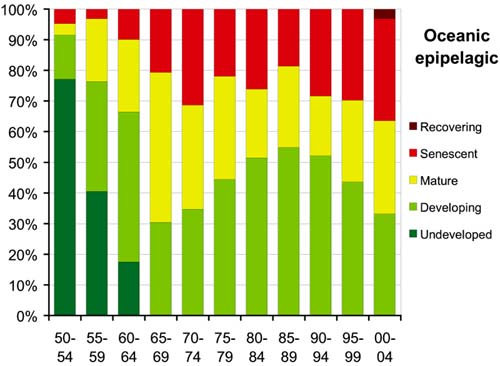
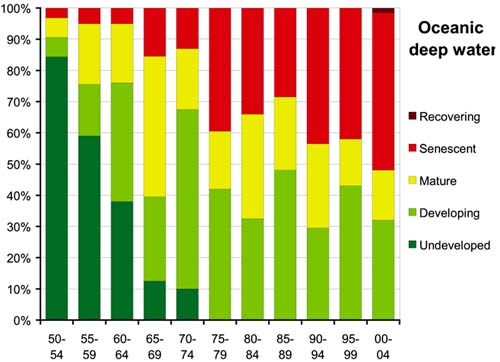
The model used to analyse the catch trends is based on a simple generalized fishery development model incorporating five phases: (1) Undeveloped: low initial catches; (2) Developing: rapidly rising catches; (3) Maturing: catches reaching and remaining around their historical maximum; (4) Senescent: catches consistently falling below the historical maximum; (5) Recovering: catches showing a new phase of increase after a period of senescence.
This approach was applied to historical catch data of oceanic-epipelagic and oceanic-deep-water species as classified by Garibaldi and Limongelli (2003). Data were extracted from the FAO capture fishery production statistics for 1950 - 2004 (FAO, 2006a).
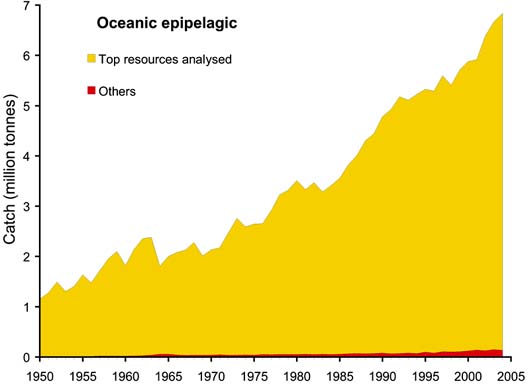
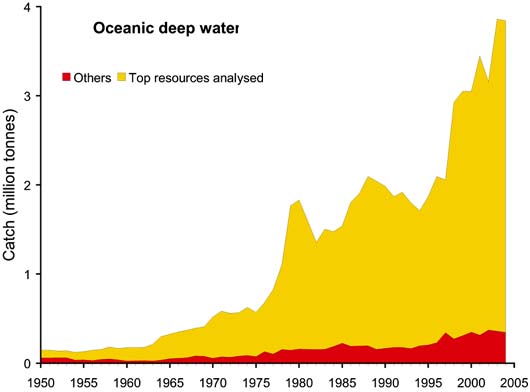
The top "resources" (defined as species by statistical fishing area) were selected on the basis of catches during 1950 - 2004 totaling 100 000 tonnes or more. The data referring to landings of aggregated species were excluded from the analysis, except where the grouping is confined to a single genus, such as Frigate and bullet tunas (Auxis thazard and A. rochei). These top resources accounted for 97 percent of total oceanic-epipelagic catches and for 88 percent of the total oceanic-deep-water catches as can be seen in Figures 55 and 56. The species included in the top resources analysed are shown in Table 5.
The time series of catches were standardized (rescaled to Mean = 0; Standard deviation = 1) giving equal weight to all resources, independently of their magnitude and variance, to facilitate comparison of their trends and then grouped by shape using the K-Means Cluster Analysis (as implemented in STATISTICA Version 7.1, with default settings and limiting the number of clusters to 6). Based on an analysis of the slope, the profiles were sliced into phases corresponding to the five stages of development indicated above. The total number (and percentage) of resources in each phase were calculated each year, across the whole data set. The overall patterns are shown in Figures 57 and 58. An identical analysis was carried out with only the species defined as "highly migratory"; as the results were almost identical to those for the oceanicepipelagic category they are not presented separately here. The species composition of this oceanic-epipelagic category contains virtually all highly migratory fish species, plus some additional (krill, flying fish and squid) species as indicated in Table 5.
|
FIGURE 55
|
Whereas catches of the oceanic-epipelagic resources showed a fairly steady increase during the whole time period (Figure 55), fisheries for oceanic-deep-water resources increased more slowly at first, but then more rapidly from the 1970s onwards (Figure 56). As already pointed out, this is presumably a result of technological developments which allowed fishing in deeper waters, but also because of reduced fishing opportunities in more coastal areas elsewhere (e.g. due to extended jurisdictions and declining resources) which encouraged exploitation in deeper waters.
|
FIGURE 56
|
These different historical development patterns are reflected in the comparative analysis of the evolution of the oceanic-epipelagic versus oceanic-deep-water fisheries. The proportion of resources with fisheries classified as "undeveloped" fell to zero by the late-1960s for the oceanic-epipelagic resources (Figure 57) but not until the late-1970s for the oceanic-deep-water resources (Figure 58). By the late- 1960s, more than 50 percent of the oceanic-epipelagic resources had evolved to mature or senescent stages. Since then, the resources with some room for further development ranged between 30 and 55 percent, with about 20 percent classified as senescent. By the early-1980s, the fraction of oceanic deepwater resources with room for further development had declined to about 35 percent, and during the most recent period 40 percent are classified as senescent, more than in any other stage of development. This result reinforces the concern that deep-water resources are generally more vulnerable to overexploitation due to their slow growth, longevity and lower replacement potential.
|
FIGURE 57
|
|
FIGURE 58
|
TABLE 5
Top species in the categories oceanic-epipelagic
and oceanic-deep water which were subjected to cluster analysis
|
Oceanic-epipelagic |
|
|
English name |
Scientific name |
|
Albacore |
Thunnus alalunga |
|
Antarctic krill |
Euphausia superba |
|
Atlantic bluefin tuna |
Thunnus thynnus |
|
Atlantic pomfret |
Brama brama |
|
Basking shark |
Cetorhinus maximus |
|
Bigeye tuna |
Thunnus obesus |
|
Black marlin |
Makaira indica |
|
Blackfin tuna |
Thunnus atlanticus |
|
Blue marlin |
Makaira nigricans |
|
Common dolphinfish |
Coryphaena hippurus |
|
European flying squid |
Todarodes sagittatus |
|
Frigate and bullet tunas |
Auxis thazard, A. rochei |
|
Indo-Pacific sailfish |
Istiophorus platypterus |
|
Japanese flying squid |
Todarodes pacificus |
|
Japanese flyingfish |
Cypselurus agoo |
|
Jumbo flying squid |
Dosidicus gigas |
|
Kawakawa |
Euthynnus affinis |
|
Little tunny (=Atl.black skipj) |
Euthynnus alleteratus |
|
Neon flying squid |
Ommastrephes bartrami |
|
Northern shortfin squid |
Illex illecebrosus |
|
Pacific bluefin tuna |
Thunnus orientalis |
|
Pacific saury |
Cololabis saira |
|
Silky shark |
Carcharhinus falciformis |
|
Skipjack tuna |
Katsuwonus pelamis |
|
Southern bluefin tuna |
Thunnus maccoyii |
|
Striped marlin |
Tetrapturus audax |
|
Swordfish |
Xiphias gladius |
|
Wellington flying squid |
Nototodarus sloani |
|
Yellowfin tuna |
Thunnus albacares |
|
Oceanic-deep water |
|
|
English name |
Scientific name |
|
Argentines |
Argentina spp. |
|
Beaked redfish |
Sebastes mentella |
|
Black scabbardfish |
Aphanopus carbo |
|
Blue grenadier |
Macruronus novaezelandiae |
|
Blue ling |
Molva dypterygia |
|
Blue whiting (=Poutassou) |
Micromesistius poutassou |
|
Deep-sea smelt |
Glossanodon semifasciatus |
|
Electron subantarctic |
Electrona carlsbergi |
|
Geryons nei |
Geryon spp. |
|
Greenland halibut |
Reinhardtius hippoglossoides |
|
Grenadiers nei |
Macrourus spp. |
|
Hector's lanternfish |
Lampanyctodes hectoris |
|
Ling |
Molva molva |
|
Longspine snipefish |
Macroramphosus scolopax |
|
Orange roughy |
Hoplostethus atlanticus |
|
Patagonian grenadier |
Macruronus magellanicus |
|
Patagonian toothfish |
Dissostichus eleginoides |
|
Queen crab |
Chionoecetes opilio |
|
Roundnose grenadier |
Coryphaenoides rupestris |
|
Sablefish |
Anoplopoma fimbria |
|
Silver gemfish |
Rexea solandri |
|
Silver scabbardfish |
Lepidopus caudatus |
|
Silver warehou |
Seriolella punctata |
|
Southern blue whiting |
Micromesistius australis |
|
Tusk(=Cusk) |
Brosme brosme |
Garcia, de Leiva Moreno and Grainger (2005) noted that over two thirds of all resources appear to be either "mature", "senescent" or "recovering" which underscores the global need to control fishing effort and capacity. It is apparent that this need applies no less to oceanic, and particularly deep-water species.
![]()
![]()
![]()