![]()
![]()
Resource Paper
Satellite Accounts for Agribusiness
Heidi Arboleda
Regional Adviser on National Accounts, UN ESCAP, Bangkok,
Thailand
1. Introduction
The Oxford Dictionary defines business as trade or commerce and agriculture as farming and livestock. The meaning and use of these words have now been expanded to suit recent economic developments. Business has now been widely used to mean production activity for the market and agriculture to mean the economic activity covering crops, livestock, fishery and even forestry.
Agribusiness within this context, therefore, covers the production in these economic sectors for the market. In a wider scope it could refer to the integrated activities which involve the production, processing, marketing and consumption of agricultural products. As one of the major groups of production activities in the economy, it has links with other economic activities. It is also an integral part in the compilation of national accounts although its articulation might not be explicit. The System of National Accounts revised in 1993 provides for satellite accounts that allow for modification of the configuration of the accounts to enable specific analysis without deviating from the central framework. The sectors covered in agribusiness could be expanded to allow for more in-depth analysis without losing its links with the overall framework of economic analysis.
2. Framework for Economic and Social Analysis
Before looking at the Satellite Accounts it is necessary to examine the wider framework of socio-economic analysis and how the system of national accounts relates to this wider framework.
This framework serves as the basis for a systemic management of statistics (data collection, processing, tabulation, summarization, etc.) The logical analysis and interpretation of these statistics provide basis for plans, policies, and decision making.
The elements of the framework is anchored on resources which could be broadly classified into: human resources, produced capital resources; Natural resources; and financial resources.
Human resources consist of the country’s population and could be categorized into three major age groups: children (usually 0-14 years) who are in the formative stage; the productive and reproductive age group (15 - 59 or 64); and the retired (60 or 65 years and over). The role/functions of human resources in the framework are as follows:
Natural resources (land, water, etc), raw materials for production (trees, minerals, water, etc), and the environment that promotes the overall well being of people. Maintaining a healthy balance in these resources at the country and global level is important for the sustained well being of the people. It is important to note that while some of these resources can reproduce themselves others cannot. These are very important because of the following reasons:
Produced capital resources such as machinery, equipment, buildings, inventory of goods, etc. make possible the expansion of capacity to produce goods and services. These assets, which are the result of past and present production, are used as means or input to production. As resources they are important.
Finally, societies, which have increasingly been market-oriented, need financial resources to provide the means for efficient flow and use of these resources. While financial resources are not directly used for production, they are very important in acquiring the materials for production and in making possible all the flows in the use and transfers of these resources. They are also used in facilitating the flows of the produced goods and services from the producers to the users. Financial resources are the creation of transactions, as such for every financial resource a corresponding liability is also created. For example, currency (money or cash) is a resource of the holder but is a liability of the institution, which created it (Central bank).
The framework shows the stock of resources and their flows as they are used to produce goods and services to meet the present needs of the population and to expand the resources for future needs of the people. The framework likewise presents undesirable results of the production, distribution and consumption processes, which may cause damage to the society and the countries’ resources.
The framework is shown in the chart below:
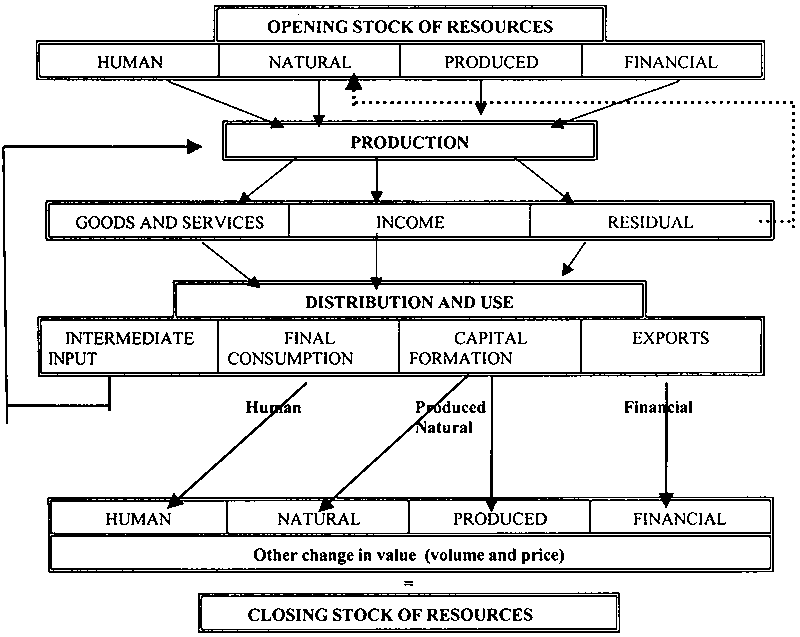
The above diagram indicates the resources, which the country has in stock, and the flow in which these resources are put to use to attain society’s goal. Opening and closing stocks of resources reflect the quantity or the value of the resources at a certain point in time - the beginning or ending of a long term, medium term plan, or short-term plan. This could also be reckoned at the beginning or ending of an accounting year or at any point in time when stock taking is desired.
Ownership, comparative levels, and use of these assets in economic or social processes are crucial to the development of any country. Ownership of these resources determines the use of such resources; and where ownership is concentrated in an institution, social problems often arise. Almost all countries have aspired to increase their produced and financial resources while at the same time improving human resources and preserving their respective natural resources. Use of these resources also determines the sustainability of the development of the country. For example, underutilization of produced or human resources because of the imbalance in the use of resources result in wastage; on the other hand, overuse or exploitation of natural resources could damage the prospect of sustainable growth.
During the accounting period, these resources are tapped for production of goods and services. The type of product or economic activity that a country wishes to undertake on a medium or long term has often become a goal of planning. Production generates goods and services (products). These products plus those which come from the rest of the world, constitute the supply of goods and services available to the people. The supply of goods and services are then put to use either to: (1) Meet the present need of consumption; add to the produced asset; or generate foreign exchange (financial asset), through exports.
Production also generates income, which are paid to the owners of the different resources. Allocation, distribution and redistribution of this income take place during the period. The recipients of these incomes then make decisions on how and for what purposes to use them - consumption (to satisfy their present needs of people), investment (to increase the stock of assets for future production), export to the rest of the world (to increase financial resources). The income that is received is therefore turned into goods and services, produced assets or financial assets.
When income is used to pay for consumption of goods and services, the result would then accrue to the welfare of the people with the desired effect of contributing to improvement of human resources. On the other hand, when income is used to acquire produced asset or financial asset, these resources will eventually expand to meet the needs of future production. Income may also be used to restore natural assets such as reforestation, regeneration, etc. as these resources may have become depleted by production or natural events.
During the period, other events not connected with production or economic processes may also take place, as in earthquake, typhoon, fire, floods, etc. These events may cause the destruction of resources resulting in reduction of existing assets or other investment that may have been made during the same period. Other discovery of new assets could add to the existing resources.
At the end of the period when another stock-taking is done, an updated inventory of resources would be recorded. Increases in these resources would mean expansion of the production capabilities. Where stock data indicate uneven changes of the type of assets, the next planning cycle may reflect a different structure of production to conform with the change. For example, where non-renewable natural resources have been depleted in volume or value, production structure would probably shift to use of other assets instead. Similarly where human resources (population) increase much more, there would be a need to change production technology to correspondingly adjust to the change in manpower resources for production as well as the anticipated increase in the demand for goods and services.
In the above framework, information on the level and distribution of the resources are referred to as stock information while that of the production, distribution, and use are classified as flow information. Stock information are taken at a point in time, while flow information is taken as the sum of what takes place during a period of time.
Resources
The stock of resources of a country is a key factor in its capability to attain society’s goal. Countries with sufficient supply of such resources will have better chance to attain their goals against those with resource constraints.
For any country, optimization on the use of these resources to attain short and long term goals is considered with the end in view of meeting desired development objectives without compromising the future. Where there are under supply of human resources, optimization may call for capital intensive technology. Alternatively, excess in human resources would mean adoption of labor-intensive technology possibly including labor export policy. Countries where natural resources (forestry, oil, mineral, and fishery) are abundant would be inclined to exploit these resources to expand produced resources or to meet their socio-economic goals. Countries with insufficient financial resources would borrow from other economies to finance development while those with more than what is needed in the country would invest these resources in other countries.
The use of these resources is often dictated by the principles underlying the development process of a country.
Production
The above resources are used directly or indirectly in the process of producing goods and services. People supply labor. Machinery, equipment, buildings are used as means to produce while inventories are used as raw materials. Similarly, natural resources such as trees from the forests are used as intermediate input, while land is used as a means of production. Production is undertaken to produce goods and services that will satisfy the needs and wants of people as well as to expand the resources of the country.
Production is generally defined as the economic activity that creates (produce) goods and services using the resources available. It is usually classified into three broad types: primary, secondary, and tertiary. Primary production, which includes agriculture, fishery and forestry, and mining, are basically production that extracts goods from natural assets with or without cultivation. Secondary production activities involve the transformation of goods into other goods. These include manufacturing, the processing of goods into other goods; construction, the transformation of goods into buildings or infrastructures; utilities, the transformation of natural resources and produced goods into energy and water for drinking and other household or production use. Services cover production activities, which make use of assets to maintain and improve the condition of people, institution, society or the environment. These include transportation, trade, business or financial services, real estate and housing, community services, personal services, public administration, and other services.
Goods and Services
As production brings about goods and services desired by PEOPLE or are needed in further production of the same or other products, it also produces by-products called residuals, which are not considered as the characteristic output of the activity. These residuals may be used by the same or other industries to create new products or they may be left to be absorbed by the natural environment. For example, garment industries produce T-shirts and its residuals of cut textile pieces are used by small entrepreneurs to make doormats. On the other hand, the processing of ores into gold results in residuals of various contents (including mercury) which are disposed of and left to be absorbed by the natural environment.
While production produces goods and services for various purposes of PEOPLE and residuals for further use or disposal, it produces income for the different resources used in production.
Income
Income in production includes compensation for the use of human resources in production, consumption of fixed capital for the use of produced assets, operating surplus for the use of financial assets, other non-produced assets, and other resources including technology and human resources for management of production operations. It also includes taxes, which are imposed by the government. Taxes are used for various purposes including maintenance of natural environment of society.
Income is received by the different institutions in society and will either remain in these institutions or will further be distributed among them. Thus, the household will receive compensation, the owners of financial assets receive dividend or interests for the use of their financial assets, government receives the taxes it has imposed, and the owners of the produced assets will get the allowance for the consumption of these assets.
The incomes that finally accrue to these institutions are used for final consumption and the saving is then used for investment or accumulation of assets.
Residuals
Residuals are the by-products of production, which are not considered as the output of the process. These are usually the wastes of production. In some instances, these residuals are recycled for production. When they are not recycled they often cause damage as waste materials and results in the deterioration of the human and natural resources.
To minimize the damages to human and natural resources, various ways are being adapted to control the excessive exploitation of natural resources, to limit emissions and other pollutants due to production and consumption and to restore damages that have been caused by previous activities.
Final Consumption
Final consumption, which is attributed to household (PEOPLE), is designed to meet their basic needs and wants. Government and private non-profit institutions also make expenditures on final consumption. Government consumption expenditure however may be classified into collective and individual consumption, where individual consumption expenditure of government would eventually benefit the individuals. Non-profit institutions serving households on the other hand, is attributed consumption, which are mainly for the benefit of households. In both consumption expenditures of government and households, the beneficiaries of such expenditures are people.
The use of income for final consumption expenditure of households, government, and non-profit institutions invariably accrue to PEOPLE. As such, income used for final consumption could be considered as contributing to maintaining or improving the quality of life of PEOPLE, the human resources of the nation.
In a narrow perspective, the consumption of households consists of the goods and services that results from production and acquired with the use of income generated in production. In the broader sense, household consumption could include the use of natural assets, which are non-produced and are availed of for free. Such consumption includes air that people breath, the use of beaches, enjoyment of scenic spots, etc.
Like production, consumption of household (PEOPLE) of goods and services, both produced and non-produced, results in maintaining or improving the quality of human resources. At the same time, consumption creates residuals, which could be ploughed back to production or disposed of and absorbed by natural resources. For example, households read newspapers, which are eventually sold for recycling; at the same time they use water and the used water flows to the drain to be absorbed back by the environment. Where these residuals are absorbed, the environmental quality is maintained; where they are not absorbed, the environmental quality is diminished.
Capital formation
Capital formation is the use of goods and services, income and residuals to add to produced and natural resources. The increase or restoration of these resources is important to expand the production capacity of the country or at least maintain the existing level of resources.
Export
The distribution of goods and services and income as export results in the addition of financial resources of the country. This export is however reduced by imports of goods and services; resources and income that come from other economies which are used by the economy. While export adds to financial resources, import reduces them.
Other value change
The value of resources is increased by the transactions that emanate from production and the other flow of resources with other economies. However, there are non-economic factors that could add or reduce the value of resources. This includes the appearance or disappearance of assets due to new discovery, natural and man-made calamities and seizures. It also includes the increase in the value of resources due to price increase (holding gain). The decrease for example in the standing trees in the orchard due to typhoon is a decrease of agriculture asset.
3. System of National Accounts (SNA)
The above framework is adopted in SNA (1993 version) but limits the resources to economic resources - those with ownership rights and have economic benefits to whoever has the ownership rights. The unit or institution which has ownership rights can derive economic benefits from these assets. Moreover, because the asset is owned and has economic benefit, there is a monetary value attached to it. With these limitations, human resources and natural resources, which are not in the name of any institutions, are excluded in the SNA framework.
The owners and transactors in the economy are classified into different institutions, namely: corporations and quasi corporations; general government; households; and non profit institutions. These institutions are units, which have legal, social or political personality and therefore can own assets and make decisions on how to use them. They can use the assets for their own production or can put them at the disposal of other institutions for production. In doing so, they get the share of the income derived from the use of the assets.
The SNA is characterized by economic flows, which result in change in ownership, value or composition. These economic flows could occur within the institution or between institutions. In the national accounts, there are different transactions involved, namely: goods and services; distribution (income); financial; and other accumulation transactions. Transactions of goods and services are matched with equivalent transactions of financial flows: income with financial, goods and services with income or financial with financial, other accumulation transactions are mostly involved imputed value such as consumption of fixed capital and other value change.
4. Formulation of Satellite Account for Agribusiness
The satellite account for agribusiness refers to the detailed articulation of agribusiness within the framework of national accounts. If agribusiness refers to the production and other transactions of agriculture and related activities, it means that the satellite account will have to articulate this in more detail within the framework of the SNA.
The satellite accounts of the SNA can be classified into articulation of the details of the existing framework or expansion of the framework. The agribusiness satellite account will fall under the first category. The current framework will be articulated in detail to highlight the stock of resources and the various transactions related to agribusiness. The satellite account will take on the various elements of the SNA framework and apply them specifically to institutions, assets, transactions related to agribusiness.
Chart 1 - Type of Satellite Accounts
5. Classification
The first classification that would be considered is the producer institution. In trying to understand the producer, we would like to differentiate between the institutional unit, enterprise and establishments.
Institutions are the units that own the resources and make decision on how the resources are going to be used. These include the following:
Enterprise is an institutional unit that engages in production. Except for the households which might not be always be producers, all the institutional units are producers of either market or non-market goods and services. It is made up of producing units called establishments. The enterprise is the unit that decides on investment, financing, and distribution of income. It also keeps information on aggregate production. This can be grouped into:
One economic activity enterprise - institutional unit may have one productMore than one economic activity - institutional unit has primary and Secondary activity/product
Establishment is the producing unit. It could be a landholding, a factory, store, an office, a residential house, etc, The establishment is generally the statistical unit for the collection of production and related data. Although production activity in the household is also called establishment, for data collection purposes, they are generally excluded.Vertically integrated enterprise - chained operation, product of one establishment are input to another establishment of same enterprise, generally identified with the final product.Horizontally integrated enterprise - one enterprise producing different product line not necessarily related with each other.
The establishments producing the same product or have the same production methods are grouped together and referred to as an industry. These industries follow the International Standard Industrial Classification (rev 3). Further articulation to highlight the type of production technology would be useful. For example, agribusiness satellite accounts could separate crop production with irrigation and no irrigation, greenhouse, etc.
Information on assets, distribution of income, financial flows, aggregate production and entrepreneurial income are derived from enterprise while information on input, income generation, output by type of product are derived from the establishments.
Following this concept, agribusiness could either be corporation, quasi corporation or households, which produces agricultural or agriculture-based goods and services for the market. The classification system for the enterprise and industry in agribusiness satellite account would be formulated based on the analytical use of the agribusiness accounts.
1 Non market goods are produced at prices which are not economically significant, that is the level of production and the prices are determined by supply and demand in the market.For example for industrial classification, subsistence agriculture should be separated from non-subsistence agriculture. The former is outside of the scope of agribusiness but still needed to determine the extent of agribusiness and non agribusiness production in the agricultural industries.
For assets, the agribusiness accounts could articulate in more detail, produced, natural produced and non produced, and financial resources. Although human resources are not considered economic asset per se, classification of human resources and the level of services used could also be classified. Non produced assets include the land, water, etc, that producers used in production.
Transactions of Goods and Services
Transactions of goods and services show the supply and demand of goods and services in the economy. This is shown in the diagram above. The flow diagram above could be represented in a matrix form which shows production and disposition of goods. The input-output table shows the goods and services used for production and the disposition of the goods and services produced. The table could be done using productxproduct (product technology) or industry by industry (industry technology). For agribusiness, the latter might be preferable as the type of industry is reflected.
Table 1 shows the transaction flows of the goods and services of the different industries. The columns indicate the input of the production of agribusiness. It shows where those inputs come from. On the other hand, the rows indicate the disposition of the goods and services from the industries as intermediate consumption of other industries or itself and final demand.
For analytical purposes, the table is useful in understanding the effects of one sector to other sectors. It shows the backward and the forward linkages of the industry. The table can have as many disaggregation of industries depending upon the need for analysis and the available data.
Income Flows
Production generates income which is paid for the services of the resources used in production. Hence compensation is paid to workers(human resources), consumption of fixed capital for the services of fixed assets used in production, operating surplus for the resources that agribusiness has put in production. Operating surplus incorporates the rent of natural assets (land, water, etc), payment for the use of financial assets owned by the enterprise or put at their disposal by other institutions and the services of the intangible fixed assets of the entreprenurs such as technology of production, etc.. In addition, production pays taxes or receive subsidies from government. The taxes net of subsidies add on to the value added and the value of output.
The income flows are recorded as transactions of institutional sectors not of industries. The units for which the income flows could be recorded would include the following:
The different accounts and the income flows that are recorded are the following:
Generation of income account - records the breakdown of value added into: compensation, taxes net of subsidies, consumption of fixed capital, and operating surplusOther value changeAllocation of income account - records the income above from domestic and foreign producers to the recipient institutions and how the institutions pay the income from the assets put at their disposal as rent,dividends and interest. The producer institution will have the balance as their residual income
Secondary distribution of income account - records the transactions of current transfers and other unilateral flow of income such as income tax to government, current transfer to non profit organization or households. The residual item in this account is referred to as disposable income.
Use of income account - carries over the disposable income and records the final consumption expenditure of the institutions. This would only be seen in households but not in corporations and quasi corporation. The residual is savings. For corporations and quasi corporations, saving would be the same as disposable income.
Capital account - carries over the saving recorded as residual in the use of income account and records the capital formation of the institution. The residual is net lending(if positive) or net borrowing (if negative)
Financial account - records the net flow of financial assets due to the various transactions of the institutions. It records the net acquisition of financial assets and the incurrence of financial liabilities. If the institutions showed a net lending, the net acquisition of assets would be higher than the net incurrence of liabilities. On the other hand if the institution showed net borrowing, it will record higher net incurrence of liabilities than acquisition of asset.
Volume change - records the non economic flows of appearance and disappearance of non financial and financial assets due to discovery, natural and manmade calamities, seizures, etc.These tables include the transactions with the rest of the world but these transactions are not reflected in the individual institutional sector accounts. The flow with the rest of the world will be recorded at the aggregate national accounts. These tables are illustrated in Table 2 and Table 3 below.Revaluation - records the change in the value of assets due to change in prices(holding gain)
Balance Sheet - shows the stock of all assets from the beginning and at ending of the accounting period. The assets include non financial and financial assets and the residual is referred to as net worth
Table 1. Input output table for agribusiness (supply and use table)
|
|
Agribusiness |
Subsistence
|
Industry
|
Services
|
Total Intermediate input
|
Final consumption |
Capital formation |
Export
|
Total Demand
|
Import
|
Output
|
||||
|
Crop livestock |
Fishery |
Forestry |
HH & NPI |
Gen. Govt |
fixed |
Inventory |
|||||||||
|
(1) |
(2) |
(3) |
(4) |
(5) |
(6) |
(7) |
(8) |
(9) |
(10) |
(11) |
(12) |
(13) |
(14) |
(15) |
|
|
(1) |
|
|
|
|
|
|
|
|
|
|
|
|
|
|
|
|
(2) |
|
|
|
|
|
|
|
|
|
|
|
|
|
|
|
|
(3) |
|
|
|
|
|
|
|
|
|
|
|
|
|
|
|
|
(4) |
|
|
|
|
|
|
|
|
|
|
|
|
|
|
|
|
(5) |
|
|
|
|
|
|
|
|
|
|
|
|
|
|
|
|
(6) |
|
|
|
|
|
|
|
|
|
|
|
|
|
|
|
|
Total II |
|
|
|
|
|
|
|
|
|
|
|
|
|
|
|
|
Comp |
|
|
|
|
|
|
income derived from production |
||||||||
|
taxes |
|
|
|
|
|
|
|||||||||
|
subsidies |
|
|
|
|
|
|
|||||||||
|
CFC |
|
|
|
|
|
|
|||||||||
|
OS |
|
|
|
|
|
|
|||||||||
|
VA |
|
|
|
|
|
|
|||||||||
|
GO |
|
|
|
|
|
|
|||||||||
II = intermediate inputTable 2 - Institutional Sector Integrated Economic Accounts
CFC = consumption of fixed capital
OS = operating surplus
VA = value added
GO = gross output
|
Account
|
Agribusiness (corporation) |
Agribusiness (Households) |
Other institutional Sectors... |
National |
||||
|
Use |
Resource |
Use |
Resource |
Use |
Resource |
Use |
Resource |
|
|
Production |
Int. Input |
Gross output |
Int. Input |
Gross output |
Int. Input |
Gross output |
Int. Input |
Gross output |
|
Generation of Income |
Comp |
GVA |
Comp |
GVA |
Comp |
GVA |
Comp |
GVA/GDP |
|
Allocation of Income |
Property income paid (land rent, interest, divident) |
OS |
Property income paid |
OS/mixed |
Property income paid(land rent, interest, divident) |
income |
Property income paid |
income |
|
Secondary Distribution of income |
Taxes on Income & wealth |
Balance of Primary income |
Taxes on Income & wealth |
Balance of Primary income |
Taxes on Income & wealth |
Balance of Primary income |
Other current transfer |
GNI |
|
Use of Income |
Saving |
Disposable income |
Final consumption expenditure |
Disposable income |
Final consumption expenditure |
Disposable income |
Final consumption expenditure |
Disposable income |
|
Account |
Agribusiness (corporation) |
Agribusiness (Households) |
Other institutional Sectors... |
National |
||||
|
|
Asset |
Liabilities/addition to net worth |
Asset |
Liabilities/addition to net worth |
Asset |
Liabilities/addition to net worth |
Asset |
Liabilities/addition to net worth |
|
Capital Ac count |
Gross domestic capital formation |
Saving |
Gross domestic capital formation |
Saving |
Gross domestic capital formation |
Saving |
Gross domestic capital formation |
Saving |
|
Financial Account |
Net acquisition of financial assets |
Net lending (net borrowing) |
Net acquisition of financial assets |
Net lending (net borrowing) |
Net acquisition of financial assets |
Net lending (net borrowing) |
Net acquisition of financial assets |
Net lending (net borrowing) |
|
Other value change |
Addition reduction of assets |
Addition, reduction of liabilities net worth |
Addition reduction of assets |
Addition, reduction of liabilities net worth |
Addition reduction of assets |
Addition, reduction of liabilities net worth |
Addition reduction of assets |
Addition, reduction of liabilities net worth |
|
Account
|
Agribusiness (corporation) |
Agribusiness (Households) |
Other institutional Sectors... |
National |
||||
|
Asset |
Liabilities/addition to net worth |
Asset |
Liabilities/addition to net worth |
Asset |
Liabilities/addition to net worth |
Asset |
Liabilities/addition to net worth |
|
|
Balance Sheet Opening |
Non financial assets |
Financial liabilities |
Non financial assets Financial assets |
Financial liabilities |
Non financial assets Financial assets |
Financial liabilities |
Non financial assets Financial assets |
Financial liabilities |
|
Balance Sheet Ending |
Non financial assets |
Financial liabilities |
Non financial assets |
Financial liabilities |
Non financial assets |
Financial liabilities |
Non financial assets |
Financial liabilities |
The satellite account is designed to meet a specific needs of analysis, in this case, agribusiness. Within the framework, several indicators could be derived in addition to indicators that describe temporal changes. The various accounts in the satellite accounts allow for formulation of indicators that will provide insights on the role of agribusiness in the economy and the various transactions within agribusiness.
Some of the indicators are provided below. They are suggestive that other indicators could be formulated for specific purposes.
Goods and Services Account
Gross value added ratio(by type of agribusiness, by corporation or households)Institutional Sector AccountsLabour productivity (GVA/number of manhours, GVA/number of equivalent full time Workers)
Incrementalcapital output ratio (capital formation/increase in GVA by institutional sector, by industry)
Capital output ratio (total stock of non financial assets/GVA)
Input ratio (ratio of type of input to total output, by industry)
Distribution ratio (ratio of type of disposition to total output by industry)
Total backward linkage (the total of columns of industry in the inverse matrix)
Total forward linkage (total of industry row in the inverse matrix)
Ratio of compensation to total GVA
Tax rate of industry (tax-subsidies/GVA, tax-subsidies/GO)
Ratio of OS to output(OS/gva OS/GO)
Ratio of Intermediate use to total output (by industry)
Ratio of final consumption to total output (by industry)
Import/Total output (by industry, product)
Export/Total output
Export/total supply
Capital formation/total supply
Implicit price index (current estimate to constant price estimate of GVA by type of product)
Other indicators for specific analysis
GVA of agribusiness to total GVA(by type of corporate and household agribusiness)Balance Sheet
Compensation paid to total GVA (within agribusiness)
Compensation paid to total compensation
Taxes - subsidies to total taxes net of subsidies
Ratio of government subsidies to total taxes
Consumption of fixed capital to GVA
Operating surplus to GVA (OS/GVA)
Ratio of GVA to GNI(GVA/GNI)
Ratio of property income paid to GNI
Ratio of agribusiness balance of primary income to total GNI
Ratio of Property income received to GDP
Ratio of Disposable income to total disposable income
Ratio of current transfer paid to total transfer paid
Ratio of saving to disposable income
Ratio of saving to Balance of primary income
Ratio of capital formation to saving
Ratio of net lending/borrowing to total saving
Ratio of net lending to capital formation
Ratio of net incurrence of financial liabilities to acquisition of financial assets
Other indicators for specific analysis
Total addition to net worth/total value of assets at beginning of period6. Data Implications
Ratio of net worth to total asset
Ratio of financial liabilities to total financial liabilities
Ratio of financial to non financial assets
Other indicators for specific analysis
The compilation of national accounts requires a wide range of basic data. However, most countries have institutionalized national accounts compilation and have put in place the basic statistics for compilation although there remain many gaps in some cases.
In the compilation of satellite accounts for agribusiness, additional data would be needed, which at the moment may not be regularly available. While there are current statistics on agriculture, corporations, quasi corporation and households, they might not be disaggregated to suit agribusiness monitoring and analysis. National statistical organizations interested in developing agribusiness satellite accounts would need to expand their statistical data collection programs.
7. Conclusion
The compilation of satellite account for agribusiness provides valuable information for analysis, evaluation and monitoring. Moreover, as a satellite account based on the central framework of the SNA, it will show the linkage of agribusiness to the total economy. The framework of an agribusiness satellite account will also provide a useful model for planning and programming future development of statistics for agribusiness.
The framework presented here is an initial attempt to conceptualize the agribusiness satellite accounts. To make it more relevant to suit requirements of individual countries, additional national and regional discussion fora should be organized to bring to highlight key issues such as: what it is intended for, who are going to use the accounts and further articulation of the detailed components of the satellite account that should be consistent with national development plans and programs. These discussions should eventually lead to the formulation of medium term statistical development programmes to support the promotion and development of agribusiness.
India
Statistical considerations in developing a national agribusiness statistics and information system (ASIS)
M.K. Srivastava
Director, Ministry of Agriculture, Government of
India
1. Introduction
Statistics and data in the beginning were used mainly in the management of affairs of the State, particularly in the collection of revenue from production and trade. Its use has spread to other areas: as indicators of performance of democratic governments, as instruments to measure development across national and international geographical regions, among others.
With the move towards market liberalization, the statistical needs of stakeholders have become more pronounced. They require reliable statistics to make economic decisions but also need a variety of non-quantifiable information to run their business. Private initiatives in this regard have been taken all over the world, as evidenced by the growing number of websites on “agribusiness,” “agribusiness information” and “agribusiness statistics.” Yet, an organized effort in this direction with Governmental support is needed.
As in many developing countries, agriculture and related entrepreneurial activities account for a large chunk of GDP and a majority of their population is dependent on these activities. It is argued that development of this sector holds the key for alleviating poverty in these countries. It is expected that as a country progresses, the share of agriculture sector in GDP may decline, but the share of business linked to agriculture may go up. One of the strategies proposed to develop this sector is to increase the availability of information on this sector, calling for a change in our perspective, from “Information for Policy Making” to “Information as Marketable Commodity” and “Information for the Market.”
2. Defining Agribusiness: A Statistical Necessity
Before implementing a programme for the development of Agribusiness Statistics and Information System (ASIS), one needs to define the “Agribusiness Sector.” One has to seek a precise answer to the question, “Statistics about what?” which is the central issue in ASIS Star Assessment Model (Fig. 1). The key issue is to draw a production boundary for the agribusiness sectors in terms of enlisting activities and products that comprise this sector. It is only after the statistical unit is precisely defined that we can choose the characteristics that best describe this entity. The choice of suitable indicators to measure these characteristics, their periodicity and units of measurement are issues that could be addressed later.
A wealth of data relating to agribusiness is already available but the real problem relates to the development of a uniformly acceptable conceptual framework of data presentation. The next logical steps would be judging the suitability of available data in the agreed framework and the identification of data gaps. Action to fill-up the gaps would need to be initiated only after completion of these steps.
An integrated and total statistical view of agribusiness sector needs to be taken before any data collection program for this could be expected to succeed.
Figure 1: Amplified Star Assessment Model
Agribusiness includes the entire agriculture and allied activities sector (crops and animal husbandry), some industries and some services. The Australian Agribusiness Association [1] defines the agribusiness sector as “the chain of industries directly and indirectly involved in production, transformation and provision of food, fibre, chemicals and pharmaceutical substrates.” The agribusiness chain hence includes the following industry sectors:
The above definition includes the chains of all value-adding activities, which terminate at the field, take place at the field or emanate from the field. Adopting this definition for setting up ASIS would require scanning of links of all types of industries and services with (to/from) field as well as those from the field to consumers. If in addition to “effort input” in agribusiness production, “knowledge input” is also included in the framework, the production boundary would enlarge considerably to include:
While economists and statisticians may agree on the core of agribusiness, they may hold diverse views on the definition of the agribusiness sector. Many issues may be fundamental in nature. For example, should research which is used by the core agribusiness sector be taken as part of the agribusiness sector? If so, then would it be applied research or pure research? Would production for home consumption be included in agribusiness? Are speculative activities or market research activities relating to agribusiness also part of the agribusiness sector? How should we account for infrastructure and services which serve a wide variety of economic activities including those in agribusiness sector?
As one objective of ASIS is the preparation of Agribusiness Satellite Accounts, the sector could be defined in terms of the activities listed in the International Standard Industrial Classification (ISIC) or the products classified in the Central Product Classification (CPC). It may be necessary to modify these classifications to meet the national requirements. This could be possible within the framework established by the internationally accepted classifications which foster international comparability of data.
In terms of ISIC - Revision 3, the following core activities of agriculture form part of the agribusiness sector.
|
Code |
Description and explanatory notes |
||
|
|
|
||
|
A |
Agriculture, hunting and forestry |
||
|
01 |
Agriculture, hunting and related service activities |
||
|
011 |
|
Growing of crops; market gardening; horticulture |
|
|
0111 |
|
|
Growing of cereals and other crops |
|
0112 |
|
|
Growing of vegetables, horticultural specialties and nursery
products |
|
0113 |
|
|
Growing of fruit, nuts, beverage and spice crops |
|
012 |
|
Farming of animals |
|
|
0121 |
|
Farming of cattle, sheep, goats, horses, asses, mules and
hinnies; dairy farming |
|
|
|
|
Other animal farming; production of animal products |
|
|
013 |
|
Growing of crops combined with farming of animals (mixed
farming) |
|
|
014 |
|
Agricultural and animal husbandry service activities, except
veterinary activities |
|
|
015 |
|
Hunting, trapping and game propagation including related
service activities |
|
|
02 |
Forestry, logging and related service activities |
||
|
B |
Fishing |
||
|
05 |
Fishing, operation of fish hatcheries and fish farms; service
activities incidental to fishing |
||
A more discerning judgment would nevertheless be required in selecting activities from manufacturing and services sector. The manufacturing activities listed in the Annexure would be included in the Agribusiness sector. A judicious view, however, needs to be taken whether the manufacturing activities which actually use the products which originate from the agriculture sector as intermediate consumption for further value addition would also be included in the Agribusiness sector. For example, consider the following activities:
|
1541 |
Manufacture of bakery products |
|
1554 |
Manufacture of soft drinks; production of mineral
waters |
|
17 |
Manufacture of textiles |
|
18 |
Manufacture of wearing apparel; dressing and dyeing of
fur |
|
19 |
Tanning and dressing of leather; manufacture of luggage,
handbags, saddlery, harness and footwear |
A solution to the problem of defining Agribusiness Sector thus lies in defining a boundary based on internationally accepted systems of classification like ISIC, Harmonised Commodity Description Coding System (HS), Standard International Trade Classification (SITC) and the new Central Product Classification (CPC). The classification of an activity or a product would require the consideration of the following
i) nature of activity/product3. Extracting Agribusiness Data
ii) character of goods and services produced
iii) uses to which goods and services are put to and their destination, and
iv) inputs (knowledge, effort and material), process and technology of production.
The second practical challenge to be handled after defining the agribusiness sector relates to the extraction of agribusiness data from general industry statistics and to present those on an internationally comparable and consistent basis. This calls for the development of standardised concepts, definitions and measures. There may be problems of splitting the classes within the ISIC to get separate data for agribusiness activity. For example, the Division 17 relating to “Manufacture of textile” does not discriminate between use of fibre from agricultural and industrial sources. Blending of synthetic and agricultural fibre for manufacturing of textile is a common practice. But as an agribusiness statistician one would be interested only in production based on fibre produced in agriculture (crop and animal husbandry). There may also be the problem of splitting the activities and/or production of many process-based industries whose production is used both in agriculture and non - agriculture sector. For example, one of the by-products of steel industry is calcium ammonium nitrate (CAN) which is used as a fertilizer, a key input in the agricultural sector. Similarly, accounts of General Insurance companies may not be available separately for agricultural insurance and other types of insurances.
4. Measurement Issues
Availability of data to measure agribusiness activity in different countries may vary. It may seem difficult at this stage to evolve coherent measures of agribusiness activity for comparative purposes. Efforts may be required to build estimates within an internationally agreed framework. Besides the choice of units, this exercise would throw up the valuation issue. Does one value production at farmgate, market or border prices? If it is market price, is the price at wholesale or retail? What valuation system should one adopt for industries only part of whose production falls in the agribusiness sector? How do we value and quantify research? Though answers to some issues may be found in the available literature, the sheer complexity, vast expanse of agribusiness sector and extended links require that these issues are settled beforehand.
5. What can be done immediately?
A system of agricultural statistics and national accounting exists in many countries and much of it per international standards. Evolving a uniformly acceptable definition of Agribusiness Enterprise and hence of the Agribusiness sector is no doubt a requisite for the development of a system for preparation of macro-economic indicators and statements. Manuals on measurement issues and methods for extracting agribusiness information from existing statistical systems should be prepared before establishing ASIS. Nevertheless, a number of standardised indicators that describe some aspects of agribusiness are already used in many countries.
Official statistical infrastructure for these indicators already exists in most countries and indicators of performance are released periodically for public consumption. There is a high degree of international comparability of these indicators due to the development assistance and efforts of international agencies. Several entrepreneurs also disseminate agribusiness primary and secondary information through their websites. The immediate need is to compile data from diversified sources in a coherent framework to present a picture of the Agribusiness Sector.
The proposed ASIS is summarized in Fig. 2.
Figure 2: Agribusiness Statistical Information System
One needs to evolve separate strategies for statistical and non-statistical information, keeping in view that the government usually assigns the lowest budgetary priority to statistical activities. The role of the private sector whose components are the real stakeholders and direct beneficiaries of the proposed ASIS cannot be undermined. Given the resource crunch of most governments in developing countries, ASIS should be developed not as a fresh venture, but through networking and integration of existing government and private ventures. The services of existing statistical systems within the government set up should be dovetailed, as they follow the international standards. Much statistical and non-statistical information is collected by parastatal agencies or private agencies that specialize in particular aspects of agribusiness. But before these non-governmental initiatives are brought within the fold of ASIS, there should be policies for inclusion. These policies may be in the nature of the following:
With regular reference to slogans such as “single-window-clearance” or “one-stop-shop” even by government departments, alliances should be forged for efficient and effective provision of agribusiness information both at national and international levels. In this scenario ASIS is expected to be a dynamic web-based gateway to information resources all over the globe. But these resources should be selected, evaluated, described and indexed before being placed in public domain. The emphasis on ASIS has to be on quality, reliability and timeliness as in any other statistical program. There should be a database of metadata so that the statistical and textual resources could be easily accessed. Each record in the metadata will have information for those elements that are relevant and discoverable from the resource described. Linking of existing databases would thus be a pragmatic strategy.
6. A Replicable Model
ASIS could adopt the model of the Fertilizer Advisory, Development and Information Network for Asia and the Pacific (FADINAP). This network, established in 1978 as UN inter-agency network of ESCAP, FAO and UNIDO, has appointed a Technical Liaison Office (TLO) within the government for each member country. The TLOs play an advisory or policy making role for FADINAP and set priorities for action agenda. FADINAP works with a network of National Fertilizer Information Centres (NFIS), either in the private sector or industry associations. FADINAP collects, processes and disseminates some important statistics through special surveys. But it provides a link to the NFIS websites which maintain more detailed information. Regional workshops organized by FADINAP facilitate exchange of views between countries. Periodical publications such as Agro-Chemical News (monthly) and topical ones from FADINAP help spread information on country experiences and recommended practices.
Keeping in view the vast scope of the proposed ASIS and prevalence of decentralized statistical systems in different countries, a country would have more than one Information Centre-participant in ASIS. Each centre would function as the information node for a commodity or for a type of information. But one agency, preferably within the Government, should be entrusted with coordinating responsibility and be designated as the National Information Centre besides serving as Technical Liaison Office for FAO. Policies on enlisting private entrepreneurs in the network should be implemented by the Technical Liaison Office. In the case of India, this could be the Ministry of Agriculture. The Information Centres enlisted by the National Information Centre and TLO would remain accountable to this national office. Nodal points could be government commodity boards e.g., Coffee Board; or a Government office, e.g., Directorate General of Government Intelligence and Statistics (DGCIS) in India for trade data; or an autonomous institution like the Indian Council of Agricultural Research (ICAR) for technology related information; and so on. Data on desegregated levels could be obtained by going further down the line. Commodity-based searches could be carried out by going to sites of various commodity Boards or agencies. These commodity boards would then provide links to all other relevant sites.
7. How to Proceed?
Without waiting for the establishment of a precise definition of agribusiness sector, one can proceed to -
8. Management of the Agribusiness Sector in India
Though the need for promoting the agribusiness sector has been recognized, information on this sector is scattered. These should be collated and integrated to present a holistic picture of the sector in India. At present, the estimates of the contribution of this sector to the country’s GDP may not be available. Several government departments and parastatal agencies are promoting various segments of agribusiness. To give a fillip to this sector, GOI has set up a Small Farmers’ Agri-Business Consortium. Its objectives are the following:
9. Availability of Agribusiness Data in India
India’s statistical system is highly decentralized due to diversities in agroclimatic conditions, vast dimensions of coverage and its federal political system. A vast amount of data is collected and processed at State level and only processed results are sent to the Union level. The data collection efforts of federal governments are supplemented by national level survey agencies like the National Sample Survey Organization (NSSO) which collects economic data including those on agriculture and industry. (See ref. [4] for a detailed description of the system of collection of agricultural statistics in India.) The following list outlines the availability of information in Government sector in India.
Annual data on Production, Consumption and Import of Fertilizers [6]
Much of the above information, including those on policies and programmes to promote agribusiness, is already available on various government websites. News services on agribusiness sector have already started in India. Weekly agribusiness pages in national and local newspapers are special features. For example, The Hindu Business Line has a daily exclusive page on agribusiness. Agri Watch is a daily news capsule service which could be subscribed to through e-mail [14]. Besides providing market prices, it also gives important data on market sentiments, arrival dates of vessels with imported commodities, international market and weather-related information, and important government policies impacting agribusiness.
Another private sector initiative is www.eagritrader.com which provides the following services:
10. Conclusions
Given that some information system in the private and Government sector already exists, we should evolve a strategy which avoids duplication in efforts. FAO should concentrate in the first phase on establishing a network, which is useful for both government and the private traders. Information which serves the purpose of only the entrepreneurs should receive second priority. The capabilities of national governments to provide information should also be considered. The information that could be considered for inclusion in the FAO database on Agribusiness Statistics immediately would include:
- Quantities imported and Exported (monthly)
- Broad varieties in which the trade takes place (annual)
- Unit price of import (monthly)
- Origin and destination of trade (Quarterly movement matrix)
- Directories of Traders and Trader Organizations (current information)
- Bound rate and applied rates of tariff
- Procedures for imports
- Sanitary and Phyto-sanitary Standards
- Other trade related policies - incentives and disincentives
Availability of time series data on various aspects would help make forecasts with the help of some online tools provided in the network.
References
[1] Australian Agribusiness Association (2000): (http://www.agribusiness.asn.au)
[2] FAO (2000): Development of Agribusiness Statistics and Information System; APCAS/00/12, paper presented at eighteenth session of Asia and Pacific Commission on Agricultural Statistics, Bali, Indonesia, November, 2000
[3] FADINAP: (http://www.fadinap.org)
[4] Harcharan Singh (1998): A Country Paper on Statistical System for Agriculture, Forestry and Fisheries in India, presented at APO Seminar at Tokyo, Japan; 21-30 July, 1998.
[5] ICAR (2000): Technologies from ICAR for Industrial Liaison, Indian Council of Agricultural Research, Krishi Bhawan, New Delhi.
[6] Fertilizer Statistics: Fertilizer Association of India, (htttp://www.fertindia.com)
[7] Livestock Census, Directorate of Economics & Statistics, Ministry of Agriculture, Govt. of India
[8] Input Survey: Department of Agriculture and Cooperation, Ministry of Agriculture, Govt. of India
[9] Agricultural Statistics at a Glance: Directorate of Economics & Statistics, Ministry of Agriculture, Govt. of India (http:www.nic.in/agricoop)
[10] Publications of Directorate General of Commercial Intelligence and Statistics, Ministry of Commerce, Govt. of India, Calcutta
[11] Basic Animal Husbandry Statistics: Department of Animal Husbandry, Ministry of Agriculture, Govt. of India
[12] Fishery Statistics: Department of Animal Husbandry, Ministry of Agriculture, Govt. of India
[13] Agricultural Marketing (2000): National Institute of Agricultural Marketing, Jaipur, India
[14] Agri Watch: (http://www.agriwatch.com)
[15] Monthly Status of Agriculture, Ministry of Agriculture, Govt. of India (http://www.nic.in.agricoop)
[16] Wholesale Price Index Numbers of India; Office of Economic Advisor, Ministry of Industry, Govt. of India (http://eaindustry.nic.in)
[17] Directorate of Economics & Statistics, Ministry of Agriculture, Govt. of India
[18] Index Numbers of Industrial Production, CSO, Department of Statistics, Govt. of India
Annex 5.1
Exemplary List of Manufacturing Activities for inclusion in Agribusiness Sector
|
Code |
Description and explanatory notes |
|
|
|
|
D |
Manufacturing |
|
|
|
|
15 |
Manufacture of food products and beverages |
|
151 |
Production, processing and preservation of meat, fish, fruit,
vegetables, oils and fats |
|
1511 |
Production, processing and preserving of meat and meat
products |
|
1512 |
Processing and preserving of fish and fish products |
|
1513 |
Processing and preserving of fruit and vegetables |
|
1514 |
Manufacture of vegetable and animal oils and fats |
|
152 |
Manufacture of dairy products |
|
153 |
Manufacture of grain mill products, starches and starch
products, and prepared animal feeds |
|
1531 |
Manufacture of grain mill products |
|
1532 |
Manufacture of starches and starch products |
|
1533 |
Manufacture of prepared animal feeds |
|
154 |
Manufacture of other food products |
|
1541 |
Manufacture of bakery products |
|
1542 |
Manufacture of sugar |
|
1543 |
Manufacture of cocoa, chocolate and sugar
confectionery |
|
1544 |
Manufacture of macaroni, noodles, couscous and similar
farinaceous products |
|
1549 |
Manufacture of other food products n.e.c. |
|
155 |
Manufacture of beverages |
|
1551 |
Distilling, rectifying and blending of spirits; ethyl alcohol
production from fermented materials |
|
1552 |
Manufacture of wines |
|
1553 |
Manufacture of malt liquors and malt |
|
1554 |
anufacture of soft drinks; production of mineral
waters |
|
|
|
|
16 |
Manufacture of tobacco products |
|
|
|
|
17 |
Manufacture of textiles |
|
171 |
Spinning, weaving and finishing of textiles |
|
1711 |
Preparation and spinning of textile fibres; weaving of
textiles |
|
1712 |
Finishing of textiles |
|
172 |
Manufacture of other textiles |
|
1721 |
Manufacture of made-up textile articles, except
apparel |
|
1722 |
Manufacture of carpets and rugs |
|
1723 |
Manufacture of cordage, rope, twine and netting |
|
1729 |
Manufacture of other textiles n.e.c. |
|
173 |
Manufacture of knitted and crocheted fabrics and
articles |
|
|
|
|
18 |
Manufacture of wearing apparel; dressing and dyeing of
fur |
|
181 |
Manufacture of wearing apparel, except fur apparel |
|
182 |
Dressing and dyeing of fur; manufacture of articles of
fur |
|
|
|
|
19 |
Tanning and dressing of leather; manufacture of luggage,
handbags, saddlery, harness and footwear |
|
191 |
Tanning and dressing of leather; manufacture of luggage,
handbags, saddlery and harness |
|
1911 |
Tanning and dressing of leather |
|
1912 |
Manufacture of luggage, handbags and the like, saddlery and
harness |
|
192 |
Manufacture of footwear |
|
1920 |
Manufacture of footwear |
|
|
|
|
20 |
Manufacture of wood and of products of wood and cork,
except furniture; manufacture of articles of straw and plaiting
materials |
|
201 |
Sawmilling and planing of wood |
|
2010 |
Sawmilling and planing of wood |
|
202 |
Manufacture of products of wood, cork, straw and plaiting
materials |
|
2021 |
Manufacture of veneer sheets; manufacture of plywood,
laminboard, particle board and other panels and boards |
|
2022 |
Manufacture of builders’ carpentry and joinery |
|
2023 |
Manufacture of wooden containers |
|
2029 |
Manufacture of other products of wood; manufacture of articles
of cork, straw and plaiting materials |
|
|
|
|
21 |
Manufacture of paper and paper products |
|
210 |
Manufacture of paper and paper products |
|
2101 |
Manufacture of pulp, paper and paperboard |
|
2102 |
Manufacture of corrugated paper and paperboard and of
containers of paper and paperboard |
|
2109 |
Manufacture of other articles of paper and
paperboard |
Developing Agribusiness Statistics and Information System: the Indonesian Experience
Kaman Nainggolan
Director, Center for Agricultural Data and Information,
Ministry of Agriculture
1. Introduction
Change Paradigm
Agribusiness development in Indonesia is facing a number of challenges due to domestic and international changes.
International Environment
The liberalization of international trade is a challenge facing agribusiness development. WTO/GATT commitments to reduce or eliminate various forms of tariff or non-tariff protection means opportunity as well as challenges. For nations which have the ability to improve their competitive strength, the opportunity is open to increase market share, domestic and international. Conversely, it will have adverse effects - either withdraw or step down - on nations with no capacity to improve their competitive strength. For this reason, there is no option for Indonesia but to accelerate the strengthening of its the competitive capacity. The term competitive capacity can be interpreted from the demand side and from the supply side.
From the demand side, competitive strength means that agribusiness products sold must satisfy consumer’s preferences, in terms of quality and price. In this regard, we have to be aware of the significant changes in consumer’s preferences, determining changes in consumer’s behaviour of to buy or not to buy. The associated changes are as follows:
The above four international changes have changed consumer’s behaviour in buying a product. In the past, consumers would be satisfied by considering type of commodity and price, but now and especially in the future, consumers require more detailed and specific attributes, such as: (1) safety; (2) nutritional; (3) value; (4) packaging; (5) eco-labelling; and (6) humanistic attributes. The required attributes have been institutionalized, both at the international level (such as sanitary attributes and phyto-sanitary practices established by WTO) and in several individual countries (internalized in the standard of quality of agribusiness products).
On the supply side, competitive strength is related to the capacity to efficiently respond to the changing attributes of products demanded by consumers. The ability to respond is related to two fundamental issues:
The above arguments represent the agribusiness development challenges that face the highly dynamic and changing environment. Management of agribusiness development requires the ability to build a comprehensive and integrated product-line, and offers a strategic role to the skilled human resources, capital goods, and technology innovation as the source of power to increase productivity and value addition.
Domestic Environment
These changes have an important implication in the management of agribusiness development, namely:
(1) Agribusiness development will be determined by the economic actors, i.e. the agribusiness enterprises, including household farm, small scale and medium scale enterprises, cooperatives, and large scale corporations. The centeral and regional governments have the task of facilitating the growth of the agribusiness enterprises, especially household farm, small, medium scale and cooperatives.(2) The Central government has to empower regional governments in agribusiness management.
(3) The capacity of the government to orchestrate the whole potential and activity in agribusiness development must be improved to ensure synchronization of program, both in terms of type, spatial distribution and time to encourage creativity of the agribusiness actors.
2. Agribusiness as Prime Mover of Indonesian Economy
Indonesia has a strong comparative advantage in its agricultural and marine resources. If these are used to develop a strong competitive advantage, the economy will have a strong domestic resource base, competitive strength, and be fully developed for the well being of the people.
Experience has shown that to effectively change comparative into competitive advantage, it is necessary to change agricultural development into agribusiness system development, where agriculture, upstream and downstream industries, and the service sector are simultaneously developed. Agribusiness system development should be regarded not only as a new approach, but also as the prime mover and grand strategy in Indonesia’s overall economic development. This is based on several strategic considerations:
Simply put, by promoting agribusiness system development as the prime mover of the national economic development, the grave economic problems facing Indonesia today (e.g. how to push economic growth, promote employment opportunity, increase export earning, encourage more equity, accelerate regional development, develop food security status and sustainability of the living environment) can be resolved in a simultaneous and sustainable fashion.
In connection with the development of Indonesia’s economy through agribusiness system development, two major challenges are essential.
Based on the challenges and under present conditions, agribusiness system development as the prime mover of the national development has the following vision: “To create a healthy and vigorous national economy through agribusiness and agribusiness enterprises system development which is competitively strong, people oriented, sustainable, and decentralized.”
With that vision, we will develop agribusiness system or structure to include upstream and downstream agricultural industries, agriculture itself, and the supporting services with the following characteristics: competitive strength, people oriented, sustainable and decentralized. In addition, the system will also develop home industries, group enterprises, small scale and intermediate industries, cooperatives, and corporations which have the above characteristics.
3. The Need for Agribusiness Statistics and Information
The world today is characterized by rapid and fundamental change toward a new global economic change. Geopolitical change, which is not easily predictable as to its direction as well as its impact, and the increasingly rapid development of science and technology, are quickly driving the world economy into the era of globalization.
Globalization is being accelerated even further by the rapid advancements in the areas of information, telecommunication and transportation technologies. Obviously, globalization will affect national economies as well, including the agricultural sector and all of its various activities.
Over the past three decades, the global economy has grown enormously. The successes of GATT, APEC and other regional economic development activities has produced agreements on opening the market all over the world. The significant action to achieve free trade is to reduce, step by step, tariff and non-tariff barriers. We have witnessed the acceleration of international financial flows and massive growth of foreign direct investment, fuelled by the opening of world markets, all contributing to a significant expansion of the size of the global economy. To compete in the international market, product quality has to meet the requirements of the standardization systems, such as the ISO 9000. Production and marketing management quality should be improved to conform to international standards. World-class quality of products increases competitiveness and access to international markets.
One of the strategic ways to access global markets is to ensure the availability of agribusiness/market information. Without accurate and up-to-date information, it is impossible to formulate a strategy to expand in the world market. Information about the dynamics of customer preferences, competitors, new products, needs to be analyzed as a basis in formulating good planning and marketing strategy. In other words, the marketing plan can only be implemented if it is supported by adequate agribusiness/market information. The agribusiness/market information system therefore needs to be developed as to link and match supply in rural areas and demand in the cities. The advantage to the farmers is that they will have access to the market and use agribusiness/market information as strategic resources for better decision making. Accordingly, the agribusiness process should be market-driven, in a sense that businessmen should produce what the market wants rather than selling what they can produce.
For businessmen, agribusiness/market information will be important for making accurate decisions. For government, the system will improve the ability to access information and disseminate them to the farmers. The agribusiness/market information system as a new tool will help agribusiness to plan, coordinate, and market their products.
One of the main objectives of agricultural development in Indonesia is to reduce poverty by increasing farmer income. The rapid economic development has a tendency of widening the income gap between farmers and those working in the non-agricultural sector. One way of increasing farmer’s income is to reduce marketing costs by improving marketing efficiency. This would mean reducing the traders’ excessive profit margin. One reason for this excessive profit margin is the asymmetry of the marketing information. Most farmers have limited access to timely and reliable agribusiness/market information. On the other hand, traders, particularly the larger ones, generally have better access to the agribusiness/market information since they have better facilities. The price is basically determined by supply and demand conditions. Agribusiness/market information therefore, is important in price determination at each level of the marketing systems.
Agribusiness/market information is also important to reduce the instability of prices received by farmers, thereby improving the allocation efficiency of resources and increasing net farm incomes. Efficient agribusiness/market information systems would help decision-makers make more informed and improved decisions. To accomplish this, agribusiness organizations must secure, assemble and analyze relevant data for sound decisions and reducing uncertainty in planning process.
The efficiency of the agribusiness/market information dissemination is determined by whether or not the information is used by its intended receivers. This will further be determined by the receivers’ subjective evaluation on the accuracy of the information. If the receivers believe that the information is not accurate, then they would not use it optimally. In this case, the information will be considered inefficient or even useless. Perhaps the main reason for the limited use of agribusiness/market information is the quality of information itself. The information disseminated to both farmers and traders are mostly existing prices. In many cases there is no information on future prices. Information on supply and demand situation is only useful for price determination and selling of the corresponding products. It would be very useful if future price could be made available for users.
The field interview also supports the proposition that the quality of the information itself makes its use very limited. Most farmers say that the agribusiness/market information available to them could only serve either in price determination or selling purposes. It could not be used for production adjustment or for improving their bargaining position. This condition indicates the need to develop strong agribusiness/market information systems that provide users with information they need.
By developing agribusiness/market information systems the link between supply and demand subsystems will be established, such that marketing efficiency will increase. Farmers, government and entrepreneurs can use this agribusiness/market information system. Farmers with access to this information can make decisions as to type, quantity and quality of the commodity to produce, while entrepreneurs will have agribusiness/market information as an accurate input to facilitate their business. For government, the system will improve its ability to access data from domestic and international market such as data of supply, demand, stock, and price can be monitored continuously. This information is very important for effective policy formulation and comprehensive planning.
A good indicator of the effectiveness of an information system is the frequency of the message received by its target audiences. The more frequent the message received by the targeted audiences, the more effective is the information systems. Another indicator of the effectiveness of an information system is its speed in disseminating the information to its audiences. The faster its audiences receive the information, the more effective it is. The speed of disseminating the information is especially crucial for agricultural commodity prices since agricultural prices could change in a very short time.
The specific objectives of agribusiness/market information development, therefore, are the following:
3. Major Types of Agribusiness Information
The setting up of agribusiness statistical information systems is catching the interest of many countries in the Asia and the Pacific region. This is an encouraging development and will require a big shift in the focus of information from purely production-based to market-oriented ones. Governments have started to realize that the key to the development of agriculture to instill in the farmers’ minds the importance of ensuring a steady market for their products.
Basically, agribusiness system development consists of five subsystems, namely:
Therefore, the development of agribusiness statistics and information system should be aimed at supporting the five subsystems above.
In countries with a fairly developed ASIS (Agribusiness Statistics and Information System), three major types of information constitute the dominant scope of the system. These three interrelated types of information have significant implications for assisting policy makers and agribusiness participants in understanding supply and demand conditions for important agricultural commodities. The types of information are prices, volumes of supplies and flows, and acreage.
Prices
Price information is always the centerpiece of any ASIS. It is necessary to make informed marketing decisions at all levels of an agribusiness system. It is therefore not surprising that prices are given highest priority in the design of the ASIS in any country.
Whenever feasible, the design of any price collection system should aim at achieving uniformity in concept and definitions and should be handled by properly organized institutions with well-trained market reporters and supervisors.
The price components of the system relate to the following:
Market supplies and flowsfarmgate prices
After prices, the next most important sets of information for ASIS are those that relate to public and private supplies of commodities at various levels of the agricultural marketing system. In addition, stocks information should be supplemented with regular information on the volume of arrivals and outflows (origin/destination) of marketed commodities. Supplies provide information on potential availability of products to meet future demands, both the domestic and international needs. Volume flows, meanwhile, indicate market and supply area locations. The availability of these data assists in keeping a balance between supply and demand resulting in more stable market prices.
Acreage and production
Information on acreage as well as production is the third most important type of information for ASIS. This is a necessary component of the agricultural situation and outlook service. Acreage estimates of the farmers’ planting intentions, actual area planted, as well as harvested acreage provide insights into potential supplies and their location in relation to anticipated future demands. Drawing a clearer picture of the supply-demand position in the country is facilitated if the acreage information is supplemented by production estimates, farm stocks and demand estimates. Production information is measured by quintal or kilogram.
Other information
Other information are also considerably important in agribusiness. These include commodity losses, commodity quality specifications, new marketing or post-harvest technologies that improve drying and storage, and afternative costs of transportation from production to consumption areas. These types of information, however, are not collected as frequently as the other three mentioned above.
4. Developing Agribusiness Statistics and Information
· Previous Efforts
The development of agribusiness statistics and information system began in 1995 until 1997, through an FAO Technical Cooperation Project. Through this TCP, the Government expressed its commitment to help in accelerating a sustained development of the agribusiness sector by setting up a user-oriented, demand-driven agribusiness statistics and information service. It has assigned this task to the Ministry of Agriculture through the former Center for Agricultural Data, now the Center for Agricultural Data and Information (Pusdatin).
Inherently, an Agribusiness Statistics and Information System (ASIS) fulfills four specific functions: to inform, to understand, to infer, and to decide. Each of these functions may be translated into clearly defined service that ASIS should provide, as the following:
West Java and the grocery market Kramat Jati have been used as the launching areas of the Project main activities. In Kramat Jati, the Project initiated regular monitoring of market arrivals. To facilitate data capture, the Project installed a computer unit in the Pasar’s administrative office. The Market Manager assigned two staff members to undertake data inputting. The CADI gets a diskette copy of the records of market arrivals.
Over at West Java, the Project launched its pilot demonstration of the statistical index area approach. It harnessed the information available from special reporting forms for vegetables and fruits (called SPII and SPIII). The sample Kabupaten, which serve as the statistical index areas of the province, submit copies of SPII and SPIII to CADI. The CADI staff, in turn process the information in the computer. When the first few months of the operations yielded encouraging results, CADI requested the Project to expand the application of the statistical index area approach to include Central and East Java.
The data accumulated from these operations, coupled with the price information obtained directly from the Directorate-General for Food Crops and Horticulture, provide the base of statistical inputs to the Agribusiness Statistical Indicators bulletins initiated by the Project. Two bulletin series - monthly and quarterly - were developed. Bulletin series were also prepared separately for each of the Java provinces. Feedback from target readers were solicited by CADI before these were mass circulated. CADI has included this as a regular information service in its Internet homepage.
The Monthly Agribusiness Statistical Indicators. The Monthly Agribusiness Statistical Indicators is published by CADI, with FAO support. The publication contains information on the trends of production, acreage and prices of selected vegetables and fruits grown largely in the Java region. The key vegetables and fruits production and marketing characteristics are expressed in statistical indexes and their monthly, quarterly, and annual trends in percentage change. Market arrival monitoring information has been limited to Grocery Market Kramat Jati, Semarang, and Bandung. Information on the origin of the commodities is also available on commodity flows.
The Quarterly Agribusiness Statistical Indicators. The Quarterly Agribusiness Statistical Indicators serves as one of CADI’s concrete responses to the Government’s call to take steps to promote agribusiness in the country. It serves as a complementary publication to the Monthly Agribusiness Statistical Indicators, and provides time series statistical table for the key crop characteristics for fruits and vegetables. Charts give readers a visual presentation of these statistical indexes. A technical note at the end of the publication explains the methodology used in generating the statistical tables. Again, the FAO has been instrumental in helping CADI in the conceptualization, preparation and publication of the Indicators.
· Methodology of Agribusiness Statistics
Data Collection and Data Processing
Production and acreage. The data collection frame is based on the concentration of the area of vegetables and fruits, whereas the choice of area of concentration for districts is based on the average of harvested area (for vegetables) and the number of productive trees (for fruits) which have harvested area cumulative greater than 80%. The vegetables include: shallot, garlic, potato, cabbage, chilli, and tomato; while the data for fruits include: mango, papaya, banana, pineapple, and orange.
The unit of data collection for harvested area and production of vegetables and fruits is the province, with the object of data collection at sub-districts within the district area of concentration. The data collection activities are conducted by agricultural officials in each sub-district. The data collection methodology used for acreage and production of vegetables and fruits is complete reporting method, using special forms called SP-IIA (for vegetables) and SP-IIIA (for fruits) at sub-district within the concentration area. The data is collected through interviews with farmers or farmers groups, and head of villages, and sometimes through eye estimates. Planted area and production data of seasonal vegetables and fruits are collected monthly, and the number of annual trees and vegetables, quarterly.
Before the data is processed, it goes through the data entry procedure at the provincial level. A special computerized program processes the data. The program can compute planted area or number of trees or production for vegetables and fruits for a given district. Using this computer program we can also arrive at provincial figures for the planted area or number of trees or production.
Price and supply volume. Grocery prices and supply volume data including point of origin are collected directly from the grocery market, while retail prices are collected daily at retail markets. CADI provides special forms for data collection; these are distributed to grocery markets and retail markets in the cities. Officials from each market then fill out the forms based on interviews with grocers or retailers in that market, after which the forms are collected by officials from CADI. The forms for supply volume data are filled out by officials of the grocery market based on the number of trucks that carry the commodities which enter the market. The completed forms are collected by officials from CADI weekly. After one month, the data is processed to get the average grocery price as well as retail price, and the total volume for each commodity.
Data analysis and dissemination. After data processing, tables, graphs as well statistical index representing that data are produced. The results are analyzed and published in the monthly bulletin, and are distributed to all related agencies. In addition, the publications are posted in the website of the Ministry of Agriculture so that more users can access them.
Agribusiness Information System
To respond the dynamics of the global market economies, the Ministry of Agriculture of Indonesia has developed a website which contains agribusiness information. In addition, the former Agribusiness Agency of the Ministry of Agriculture of Indonesia designed an on-line agribusiness information using the Internet in 1995 in cooperation with USAID, and implemented through the Agribusiness Development Project (ADP). The system is known as “Agribusiness Indonesia On-line”. This system has been successfully tested in the Regional Offices of Agriculture of North Sumatera, South Sumatera, West Java, Jambi, East Java and West Kalimantan. The site disseminates information on agribusiness development. It is also meant as a cheap and simple medium of agribusiness promotion to the global market. The site has been visited by a large number of domestic and foreign users. For its contribution to agricultural community, the site received the Academic Excellence Award from Study Web, Stackyard Agricultural in 1999.
Those involved in agribusiness practices and development are encouraged to use the site to promote their products worldwide. Farmers have difficulty in accessing these information because of the lack of computer and Internet software, telephone lines, and electricity. However, within five years from now, it is anticipated that farmer groups or farm cooperatives would be able to utilize the system.
The menu of the site is shown below.:
1) Agribusiness Agency, which contain job descriptions and functions for all units within the former Agribusiness Agency. Because of organizational restructuring, this menu will be updated shortly.5. Some Problem and Issues2) Price Reports which provide daily and monthly prices report for Estate Crop, Food crops and Horticulture, Livestock and Fisheries in Indonesia and abroad.
3) Market Survey which provide market surveys of several commodities in Indonesia and overseas.
4) Production Guides which contain production guidance for superior commodity in Indonesia and overseas.
5) Post Harvest Guides which provide post-harvest technologies for commodity in Indonesia and overseas.
6) Trade Regulations which contain Trade Regulation for Agricultural commodities in Indonesia and overseas, including import duties.
7) Trade Statistics which contain annual export and import data in Indonesia and overseas.
8) Production Statistics which show the annual production of Indonesia agricultural commodities.
9) Trade Directory which displays directory export and import, name and address of agricultural exporter and importers in Indonesia and overseas.
10) Buy-Sell On-Line; this menu is the most popular among traders and the busiest one. This facility is free of charge and could be used by users for buying, selling and promotion of agricultural commodities worldwide. At the beginning, this menu was used mainly by overseas traders not only because domestic traders had limited access to Internet system, but also the Internet was not been familiar to Indonesian traders.
11) Investment Opportunities which contain investment opportunities in Indonesia by province.
12) Agricultural Standards which contain the Indonesian National Standard of agricultural commodities.
13) Small Scale Enterprises which presents the listing of small-scale agribusiness enterprises.
14) Info Exchange On-Line which is a medium for agribusiness information exchange.
15) Feedback, which users send to improve the site.
16) Internet Links which inform on other sites that can be accessed through this site.
Sampling methodology
The methodology for collecting acreage data is complete reporting. However, due to budget constraints and lack of manpower the acreage data is mainly obtained through eye estimates. Sampling methodology is implemented partially; hopefully it will replace the eye estimate completely in the near future.
Accuracy
There is a measurement problem in collecting volume data, because the volume is measured by estimating the weight of carload that passes through the gate of the grocery market without actually weighing the car load. The accuracy of the complete reporting method could be better if it is conducted using the right way. However, due to budget limitation, sometimes the acreage data is estimated by using eye estimate, leading to less accurate data. Some districts sometime do not even send the data to CADI because they do not have the funds for collecting and sending the data. To facilitate the sending of the data to the central office, CADI is now trying to implement an electronic form (e-form). Implementing the method nationally requires that the users have access to the Internet either through official subscription or through Internet café.
Timeliness
The markets are quite far from the CADI’s office; some are out of town. In the latter case, the data is sent by mail, causing some delay in receiving the data. Also, due to the lack of manpower the data is collected by CADI staff once every month from the markets, which delays processing. Just like the price and volume data, the acreage and production data are also sent by mail from provincial or district offices.
Communication with Regional Government
So far, decentralization has not has significant impact on data flow from provinces to central office. Provincial officers still show their commitment to cooperate with central officers in accomplishing the work assignments. However, the most important thing is that the central government offices must provide budgetary allocations for local government as their counterparts.
Accessibility to the Agribusiness/Market Information
There are some major problems concerning the accessibility of the agribusiness/market information:
6. Conclusions
Agribusiness development in Indonesia is facing a number of challenges, both as the result of domestic and international changes. Domestic changes involve regional autonomy where agribusiness development will rely more on the creativity of the people in the respective regions. International changes involve supply and demand. From the demand side, competitive strength means that agribusiness products sold must satisfy consumer’s preferences, in terms of quality and price. From the supply side, competitive strength is related to the capacity to efficiently respond to the changing attributes of products demanded by consumers.
Based on the challenges and considering the condition to date, agribusiness system development as the prime mover of the national development has the following vision: “To create a healthy and vigorous national economy through agribusiness and agribusiness enterprises system development which is competitively strong, people oriented, sustainable, and decentralized.”
With that vision, headed to the future, we will develop agribusiness system or agribusiness structure to include upstream and downstream agricultural industries, agriculture itself, and the supporting services.
Despite its usefulness in helping promote Indonesian agribusiness, the system apparently still faces some problems in methodology, accuracy, timeliness, and its accessibility. These problems are very much related to the limited funds provided by government for conducting surveys.
References
Anon. Agribusiness System Development as Prime Mover of The National Economy. Ministry of Agriculture of Indonesia. Jakarta, Indonesia: March 2001.
De Guzman, Generoso. On the Development of a User Responsive Agribusiness Information Services: The Case of Agribusiness Indicators Bulletin. Paper presented at National Workshop in Agribusiness Statistics and Information System. Food and Agriculture Organization of The United Nations. Jakarta, Indonesia: December 5, 1997.
Nainggolan, Kaman. Indonesia in the Information Age-Agribusiness: Information, Planning and Coordination Using New Tools. Paper presented in International Workshop on Agribusiness Indonesia 2000. Bali, Indonesia: 22-23 June 2000.
Japan
Role of Agricultural Cooperatives in Establishing and Maintaining a Functional Agribusiness Statistics and Information System
Tetsurou Shimizu
Norinchukin Research Institute
1. Introduction
The effect of agribusiness on agriculture has become bigger nowadays. Farmers sell most of their products to the food [processing] industry, and source much of their input materials from other industries. Agricultural cooperatives [therefore] have a significant role in agribusiness in Japan. Let me present an outline of agriculture and agribusiness to give you an understanding of the background of agribusiness statistics in Japan, and some examples of agribusiness statistics used in the country. After that, I will explain the role of agricultural cooperatives in maintaining and distributing the statistics and information to their members.
Agriculture in Japan
Products
Agricultural production was valued at 9,944 billion yen in 1998, with rice as the most important product, accounting for 25.6% of the total. The share of vegetables was 26.3%, livestock (meat, dairy, eggs) 24.4%; fruits 9.0%; and flowers 4.7%. Other crops included wheat, soybean, tobacco, sugar beet etc shared 9.9.%. After World War II, the food self-sufficiency rate (calculated in terms of calories) declined from 79% in 1960 to 40% in 1999 because of increasing imports, shrinking domestic agriculture, and changing of food life. Almost all livestock feed were imported from USA or Canada. The number of farms and farmers decreased as the younger generation chose other occupations, turning to work in other industries. By 1999, the number of farm households was 3,239 thousand, and farmers numbered 3,845 thousand. Farmers comprised only 5% of the total labor force.
Types of farmers or farm households
The 3,239 thousand farm households are classified into several types, as follows:
|
Type |
No. |
Percentage |
Description |
|
· Fulltime farm
household |
433 thousand |
13.4% |
Type (a) mostly are engaged in dairy, livestock or vegetable
farming. They have large share of the production. As of pig, chickens, and eggs,
companies produce more than half of production. |
|
· Part-time farm households
(agricultural income is more than other income) |
359 thousand |
11.1% |
Type (b) are near type (a). But they also earn money from
other jobs. |
|
· Part time farm households
(agricultural income is less than other income) |
1,682 thousand |
51.9% |
Most of Japanese farmers are type (c). They have other fixed
jobs and earn most of money from the job. They have only 0.5-1.0 ha land. Their
agriculture is mainly rice and some vegetable. |
|
· Non-commercial farm
household |
764 thousand |
23.6% |
Type (d) do not have large land. They earn most of money from
other jobs. In the mountainside, young people go to cities and do not return to
the village. Only old parents are left in the countryside, and some of them
receive pension. Their agriculture is mainly rice and vegetables. They do not
sell any product, or sell less than 500 thousand yen. Their farming is mainly
for their own consumption. |
Japanese agriculture changed much after the second world war. Farmers now use machinery to cultivate, plant and harvest. Other changes included the development of vegetable and livestock farming, and increase in the use of agricultural inputs such as fertilizer, pesticide, besides an upsurge in the use of agricultural machinery and livestock feed. The market for agricultural machinery was noted at 488 billion yen in 1997; fertilizer 202 billion yen; pesticide 405 billion yen; and livestock feed 917 billion yen. Agricultural cooperatives have an important role in selling these input materials to farmers.
Food market and food industry
As of 1995, the food market in Japan was 80,386 billion yen, which corresponded to 17% of GDP and 28% of the total consumption of private sector. But the share of farmers’ income out of the food market was only 13%. The food industry has a big role in the food market in Japan, which imports much food from foreign countries. Only 12% of the total population lived in farmholds in 1995. And even farmholds buy most of their own food requirements from shops.
2. Role of Agricultural Cooperatives in Agribusiness in Japan
The system
1) There are 9,128 thousand members of agricultural cooperatives (JA), of whom 58.5 percent are regular and 41.5 percent associate members. All farmers in Japan are the members of JA.Market share of agricultural cooperatives in the agribusiness2) Multi-purpose agricultural cooperatives numbered 1,618 in 2000. Agricultural cooperatives are now under reform because of the sharp decrease in number farmers. The number of JA has decreased by amalgamation (merger). There is another type of agricultural cooperatives in Japan such as dairy cooperatives (single-purpose).
3) The types of service rendered by agricultural cooperatives to their members are in the areas of finance, insurance, marketing products, purchasing, consulting (guidance) and others.
4) As to structure, agricultural cooperatives, are at the national l, prefectural, and city (town) levels. The federations at the prefectural level are now under restructuring.
JA group has a strong influence in the rural market in Japan. However, the market share of JA group has decreased because of competition with other companies.
|
a. Input Materials into Agriculture |
b. Output from Agriculture (Selling of agricultural
products) |
||
|
(a) Fertilizer |
73% |
(a) Rice |
67% |
|
(b) Pesticide |
73% |
(b) Wheat |
99% |
|
(c) Livestock Feed |
37% |
(c) Potato |
59% |
|
(d) Vinyl For Horticulture |
69% |
(d) Meat |
48% |
|
(e) Machinery |
49% |
(e) Pork |
27% |
|
(f) Oil |
49% |
(f) Broiler |
18% (Zennoh) |
|
(g) Other necessary goods of life |
14% |
(g) Eggs |
29% (Zennoh) |
|
|
(h) Milk |
29% (Milk plant) |
|
|
|
(i) Vegetable |
54% |
|
|
|
(j) Fruit |
47% |
|
|
|
(k) Flower |
50% |
|
|
|
[JA Zennoh estimates these data] |
||
The JA group is responsible for food processing, while the JA Zennoh has subsidiary companies which produce and sell processed foods to consumers.
The amount of processed food produced by the JA group is valued at 192 billion yen, covering potato starch, meat processing, tea refining, rice polishing, pickles, milk processing. Although 45% of JA activities relate to food processing, its share of the food market is very small (under 1%). The total value of food processing in Japan is 31,502 billion yen. On the other hand, the JA Zennoh group produces about 2,385 billion yen of processed foods.
Other special-purpose cooperatives such as dairy, meat, or orange cooperatives are engaged in food processing.
3. Statistics on Agribusiness
The varied statistics on agribusiness in Japan are used to analyze agribusiness industry and agriculture. Some examples are the following.
Census of Manufacture (Kogyo Toukei Hyou)
The Census of Manufacture is produced every year by the Ministry of Economy, Trade and Industry (METI). This census provides information on the number of companies and working population, amount of production, cost of materials of each manufacturing industry, and amount of production of food industry or agricultural machinery.
Input-output tables on agriculture and food industry by MAFF
Every five years, eight government ministries jointly prepare Input-Output Tables which enable us to analyze the relation between agriculture and agribusiness (food industry) or import ratio of agricultural product. The Ministry of Agriculture, Forestry and Fisheries (MAFF) abstracts the data on agriculture and food industry from the overall tables and publishes the data every 5 years.
Census of Agriculture
The Census of Agriculture is undertaken by the MAFF every 5 years. This census gives us detailed information on the structure of agriculture.
Other statistics on agricultural production
There are many statistics on agricultural production - crops, vegetable, fruits, livestock, and dairy. There are other kinds of statistics on price, farmhouse economy and others. These statistics are mostly published in the form of yearbooks, but some statistics are reported as quick reports, or monthly reports. These statistics are too many and complicated for us or for farmers. Various handbooks from which we can obtain data easily are published by MAFF, including “Pocket statistics of agriculture, forestry and fisheries” and “Attached statistics of the agriculture white paper.”
Some examples of handbooks are shown in the following matrix.
|
Title |
Prepared by |
|
Annual Statistics of Food Industry, published
annually |
Japan Food Industry Center (JAFIC) |
|
Pocket Handbook of Statistics of Food |
MAFF |
|
Collected data and Statistics of Food Service Industry,
published annually |
Food Service Industry Research Center (FSIRC) |
|
Information of Livestock; published monthly; information
also available on the Internet |
Agriculture and Livestock Industry Corporation
(ALIC) |
|
Yearbook of Agricultural Machinery, published
annually |
Shinnourinsya |
This is a handbook for the staff of the JA group (JA Zennoh and JA Keizairen). While most of the data are extracted from MAFF statistics, some are from the original data of JA group. JA Zennoh edits and publishes this handbook.
Statistics of Agricultural Cooperatives by MAFF
These statistics gives information on membership and business activities of agricultural cooperatives.
Agro Trade Handbook by JETRO
Import food and agricultural products from foreign countries are very important for Japanese agriculture, because Japan’s food imports are considerable. The MOF has compiled trade statistics but it is rather complicated. The “Agro Trade Handbook” prepared by the Japan External Trade Organization (JETRO) is a valuable source of information on the situation of import of agricultural products and food.
These are some examples of statistical sources that we use in research or analyses of the problems of agriculture and food industry. But I think the statistics on the food industry is rather inadequate compared to that on agriculture.
4. Role of agricultural cooperatives in establishing and maintaining agribusiness statistics
Agricultural cooperatives
Agricultural cooperatives, in my view, do not play so big a role in establishing and maintaining agribusiness statistics. The government is the main organization that does this. It decides what kind of statistics to collect, and it publishes the statistics. Agricultural cooperatives may express opinions to improve the statistics. There is a council to discuss the statistics in Japan, and under this council is a sectional meeting on agricultural statistics. There are no members from agricultural cooperatives in this meeting now, but sometimes there are occasions for agricultural cooperatives to express opinions on the statistics about agricultural cooperatives or agriculture. It should be noted that agricultural cooperatives help or cooperate with government when the examinations such as “Statistics of Agricultural Cooperatives” are enforced.
Extra-government organizations
In Japan are many extra-government organizations which play a big role in distributing statistics. Although they are now criticized because most seem inefficient and are supported by the government budget, they play a big role in linking the government and the private sector. As for the agricultural sector, there are many extra-government organizations for each area - rice, wheat, livestock, vegetable, fruits, machinery, among others. Some prepare handbooks of statistics for each field. Agricultural cooperatives are also members of these organizations and provide some funding support.
The organization that has the biggest role in maintaining and spreading agricultural statistics is “Nourin Toukei Kyokai” (Association of Agriculture and Forestry Statistics), which publishes a number of agricultural statistics. It also provides statistics in CD-ROMs. Membership in this association and payment of the prescribed fees (100,000-250,000 yen) will entitle the organization-member or individual member to the agricultural statistics compiled and prepared by the organization. As of the last count, there were 300 organization-members, mainly national level organizations, research institutes and libraries.
There are also associations at the prefecture level. The fees charged by the prefecture association are lower than that of the national revel (10,000-20,000 yen). Most agricultural cooperatives are members of the prefecture-level associations which also provide many statistics. The advantage in membership is that it is convenient for members who will be sent the statistics as they are available.
Organizations established by each industry
In Japan, many organizations are established by each industry such as food, fertilizer, machinery, and others. These organizations edit and publish handbooks or newsletters on the statistics of their interest, and they send them to their members.
5. Role of agricultural cooperatives in distributing agribusiness information
How Japanese farmers obtain agribusiness statistics
Not many farmers have statistics (yearbook or handbook) at their fingertips. They obtain the data or information from several channels such as agricultural cooperatives, public offices (city, town, village), and extension advisers. Agricultural cooperatives or extension offices hold meetings or lectures on techniques on agriculture. This is an occasion for farmers to get information or statistics about agriculture.
Most agricultural cooperatives publish bulletins or newspapers for their members, either weekly or monthly. These bulletins are also an information source for the members.
From where do agricultural cooperatives obtain statistics?
Agricultural cooperatives obtain statistics from several channels. First, they themselves may have yearbooks or handbooks of statistics provided by Norin Toukei Kyoukai. Much information is provided to agricultural cooperatives by the federations at the prefecture or national levels or from public offices. Our research institute analyzes the statistics and provides reports or magazines to every agricultural cooperative. Several research institutes at the national level publish monthly magazines.
Newspapers and Magazines
Farmers also get information from newspapers and magazines. Several newspapers specialize in agriculture or agricultural cooperatives and these are read by many farmers in their own homes.
Nihon Nougyou Shinbun (The Japan Agricultural News) is the most popular newspaper among farmers, as it reports much information or statistics in this newspaper. It is published daily by an agricultural cooperatives. Nihon Nougyo Shinbun has 480 thousand readers.
The weekly Zenkoku Nougyo Shinbun (National Agriculture News) is published by Zenkoku Nougyo Kaigisyo (National Chamber of Agriculture). Other newspapers specialize in dairy, rice and others, and provide farmers with another source of information or statistics on agriculture. Zenkoku Nougyo Shinbun has 350 thousand readers.
In Japan, there are many magazines specialized in agriculture. Agricultural cooperatives also publish magazines, the most popular in the rural areas being “Le no Hikari.” It has 840 thousand readers. JA Zenchu publishes “Monthly JA” which has a readership of 12 thousand. Many companies also publish magazines about specialized sector of agriculture.
Information through Internet
Computers and the Internet are likewise popular in rural areas. The role of Internet in distributing information has become bigger.
Some statistics are provided through the Internet. JA Zenchu provides basic statistics about agriculture of Japan; while ALIC provides precise statistics on livestock and dairy industry. About 305 JAs now have websites, although the contents are still poor.
Two cases will be explained below. The first on Statistics of Livestock by ALIC, available through the Internet; and the second on the case of Nagano Prefecture, made available through JANIS and Agrinet.
A study made by the MAFF shows that as of 2000 34.0% of farmers had personal computers, and 12.2% used the Internet. The number of farmers who use the Internet will increase in the future, so the need to access statistics through Internet will be stronger. But the percentage who use the Internet is so small now. And it is difficult for the old generation to master and use computer. It is thus important for agricultural cooperatives to urge farmers to use computers in their farm management or as a means to get information. Some agricultural cooperatives hold meetings to train farmers on the effective use of computers and the Internet.
6. Conclusions
Pakistan
Utilizing and disseminating food and agriculture statistics in support of agribusiness development
Muhammad Abrar
Deputy Director, Ministry of Food, Agriculture and
Livestock, Economic Wing, Government of Pakistan
Agriculture is the largest sector of the economy in Pakistan, accounting for 25 percent of the national GDP. The development of agro-based industries’ is requisite for promoting and diversifying agricultural production. Agribusiness development requires a reorientation in food and agriculture statistics compilation and dissemination. The system lacks the analytical aspects and information on policy instruments for agricultural production, trade, investment and taxation. In view of the government’s policy to encourage investment in agro-based industries, an Agribusiness Cell that promotes agribusiness exists in the Ministry of Food, Agriculture and Livestock, but the cell is presently dormant. Its mandated functions indicate the directions of its activities, mainly data utilization and application to develop and promote agribusiness. To perform the functions effectively, the Agribusiness Cell needs revitalization. An Agribusiness Council in the semi-public sector has been proposed with requisite institutional capacity to build, maintain and update Agribusiness Information System (ABIS). A design for utilization of food and agricultural statistics, data collection, analysis, dissemination of information, advisory and monitoring services has been prepared. ABIS will be able to disseminate data/information electronically using its own website. Formats for biweekly and monthly publications have been designed for information dissemination. Templates for commodity profiles have also been prepared by the Council, to help investors to assess the potential of an agro-based project.
Background
Agribusiness holds the same importance to agriculture as agriculture to the national economy of Pakistan. It is a requisitein referring to the existing agricultural production, system of collection, compilation and dissemination of agricultural statistics, agribusiness policy and the institutional capacity in the Ministry of Food, Agriculture and Livestock (MINFAL) to promote agribusiness. This will help in the design of a system for maintaining and utilizing an extensive agro-based database, data analysis and information dissemination in support of agribusiness development in Pakistan.
Fig. 1: Growth rate, 1990-91 to 2000-2001.
As the agriculture sector (comprising the crop, livestock, fishing and forestry sub-sectors) contributes 25 percent to national GDP, its performance influences GDP growth. In any given year, fluctuations in agricultural production are immediately reflected in the growth rate of the economy. Fig. 1 shows changes in GDP growth with changes in agriculture growth during the last ten years.
The agricultural GDP mostly comes from crops (57%) followed by livestock (38%), fishing (4%) and forestry (1%). All sub-sectors have vast investment potential and are equally important for overall growth of agricultural economy.
Pakistan has two main crop seasons - Kharif and Rabi. Kharif crops (rice, sugarcane, cotton, maize and sorghum) are grown in April-September while Rabi crops (wheat, gram, rapeseed and mustard, barley and tobacco) are grown in October-. Pakistan also produces other crops such as pulses, sunflower, canola, fruits and vegetables. (The main features of agricultural production during the fiscal year 2000-01 are shown in Table 1.)
Table 1: Agricultural production, 2000-2001
|
Sub-Sector
|
Area |
Production
|
Yield
|
|
|
ha |
% of total cropped area |
|||
|
A. Crops |
||||
|
Wheat |
8,137 |
35.7 |
18,500 |
2.1 |
|
Rice |
2,377 |
10.4 |
4,803 |
2.0 |
|
Maize |
967 |
4.2 |
1,731 |
1.8 |
|
Sugarcane |
961 |
4.2 |
43,608 |
45.4 |
|
Cotton |
2,928 |
12.9 |
10,732 |
0.624 |
|
Gram |
963 |
4.2 |
493 |
0.5 |
|
Onion |
105 |
0.5 |
1,496 |
14.2 |
|
Potato |
106 |
0.5 |
1,720 |
16.3 |
|
Citrus Fruit |
198 |
0.9 |
1,951 |
- |
|
Mango |
94 |
0.4 |
988 |
- |
|
Apple |
52 |
0.2 |
393 |
- |
|
Dates |
77 |
0.3 |
610 |
- |
|
Other crops |
5,795 |
25.6 |
- |
- |
|
Total |
22,760 |
100.0 |
- |
- |
|
B. Livestock |
||||
|
Milk |
000 Tonnes |
26,284 |
- |
|
|
Meat |
|
2,009 |
- |
|
|
C. Fisheries Products |
||||
|
Maine |
000 Tonnes |
454 |
- |
|
|
Inland |
|
176 |
- |
|
Source: Federal Bureau of Statistics/MINFALMajor agricultural exports are rice (basmati and coarse varieties), raw cotton and cotton made-ups, cotton waste, citrus fruit, mango, dates, onion, potato, fish and fish products. Major agricultural imports are wheat (up to 1999-2000) palm oil, soybean oil, tea, pulses, sugar, and milk products. Agricultural/agro based exports make up about 67 percent of total exports while agricultural imports are about 11 percent of total imports.
To support policy making in agriculture, a system of collection, compilation and dissemination of agricultural statistics is in place. This is coordinated by the Federal and the four Provincial Governments. The provincial governments and agriculture departments, send their crop estimates to the Federal Bureau of Statistics for approval and to MINFAL for consolidation. After approval, MINFAL disseminates crop production estimates and other agricultural statistics to the national and international public and private sector organizations. This is done through periodic crops estimates, annual publications, and electronic media (Fig. 2).
Fig. 2: Present agricultural statistics collection and dissemination system
The following types of agricultural statistics are compiled and disseminated:
2. Agro-Industry in Pakistan
An agro-industry is composed of a number of complimentary or competitive agricultural businesses. Agro-industries manufacture farm supplies and equipment and transform farm commodities into industrial and consumer goods. Agro-industry also includes research, technical and marketing service sector which create, help produce and distribute the farm supplies, agricultural commodities and food and fiber products available in the market. The production, processing and distribution of a given agricultural commodity generally require the participation of a number of agro-industries. Since they function in an integrated framework of business activity, agro-industries link the farmers to the consumers.
In Pakistan, agro-industry plays a major role in the lives and productivity of farmers, while providing the agro-based products, markets, jobs, and income needed to increase and improve the standard of living of the majority of people. According to the 1990-91 Census of Manufacturing Industries conducted by the Federal Bureau of Statistics, 59.8 percent of total value of industrial production came from agro-industries (Table 2).
Table 2: Value of production
|
Agro-Industries |
Value of Production |
% Share in total |
|
Food manufacturing |
62.2 |
16.6 |
|
Tobacco manufacturing |
8.8 |
2.3 |
|
Manufacturing of Textiles |
91.7 |
24.5 |
|
Wearing apparel |
7.0 |
1.9 |
|
Leather and leather products |
8.7 |
2.3 |
|
Foot wear except rubber and plastic |
2.1 |
0.5 |
|
Ginning & bailing of fiber |
19.8 |
5.3 |
|
Manufacturing of wood and wood cork products |
0.8 |
0.2 |
|
Manufacturing of furniture excepting primary metal |
0.6 |
0.2 |
|
Manufacturing of paper and paper products |
5.6 |
1.5 |
|
Fertilizers |
9.9 |
2.6 |
|
Pesticides, insecticides, etc. |
3.0 |
0.8 |
|
Manufacture of agriculture machinery |
4.0 |
1.1 |
|
Total Agro-based |
224.2 |
59.8 |
|
All industries |
374.8 |
100.0 |
Source: Agricultural Statistics of Pakistan, 1999-00Agribusiness
Agribusiness is a company which operates within a distinct agro-industry sector. Examples could be a farm input supplier such as a company producing hybrid sunflower seed, and an agricultural commodity processor such as a vegetable oil manufacturing company are examples of agribusiness in separate but interdependent agro-industries.
The Business of Agriculture
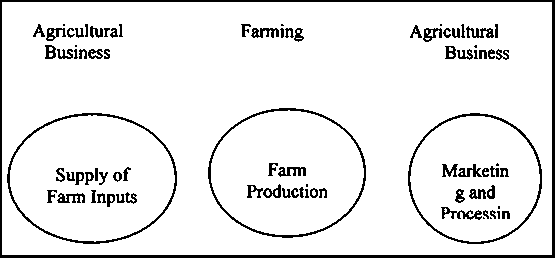
Agribusiness covers many areas. These include production of high quality seeds, storage facilities for agricultural products, manufacturing/supply of farm machinery and implements, marketing of agricultural products, the farm input industry of fertilizer, pesticides and herbicides, livestock and dairy industry, food processing and packaging activity, corporate farming, water management and the financing of agribusiness.
Agribusiness Policy
Agriculture is the most promising and important area for development and investment purposes. The Government encourages investment in agro-based industries, particularly in corporate farming. The following areas have been specified by the Board of Investment for investment under corporate agriculture farming:
For corporate agriculture farming (which has not yet started), the Government would provide some incentives. These include:
First Pakistan Agribusiness Conference
The First Pakistan Agribusiness Conference was held in Islamabad on 26-28 April 2001. This was arranged by a private sector company sponsored by farm inputs manufacturers, commercial banks and supported by MINFAL and Board of Investment. It was attended by representatives of international farm input manufacturing/supplying companies, diplomats, foreign missions, UN agencies, foreign banks, Government officials, scientists and experts in agribusiness. Representatives of the local agro-based companies, farmers associations, farmers also participated. This Conference provided a venue for the promotion of agribusiness activities in Pakistan.
Agribusiness Promotion in Pakistan
In MINFAL is an Agri-Business Cell (ABC) that is mandated to promote agribusiness in Pakistan. This cell is not active, but the functions laid down in its charter indicates the specific directions of its activities and includes provision for data utilization and application to develop and promote agribusiness.
- Government policies, business practices, investment incentives and taxation.
- Economic, technical, agricultural and marketing data.
- Financial channels, opportunities and mechanisms.
- Physical infrastructure, material and human resources.
3. Utilizing and disseminating food and agriculture statistics in support of agribusiness promotion
Need for system of information dissemination
The current system of dissemination of agricultural statistics lacks an early warning system, and is mostly geared towards the requirements of government functionaries to carry out analysis for formulating policy decisions. The system is neither farmer - or agribusiness-oriented in that it does not provide information on time to farmers to enable them to make production decisions, nor does it provide production/marketing information to traders, processors and agribusiness companies according to their requirements. Apart from this, information on government policy instruments that affect agricultural production, domestic marketing and international trade and investment climate of agro-industries is not a part of the agricultural statistics dissemination system. There is therefore a need for a specific Agribusiness Information System (ABIS) for ABC
Benefits of information dissemination
Information properly disseminated to farmers, traders, agricultural researchers/planners, government officials and policy makers is important in the allocation of resources and in the planning process. Hence the need for a dynamic market information dissemination service. According to Shepherd (1997) a market information service can have the following impacts:
Information needs
Every piece of agricultural information is useful for all the active players in the agribusiness. However, the functions of each group differ; thus, the data forms required by each group would vary, following list is prepared on the possible information need by different groups:
· Policy Makers
Government policy makers have to make well thought out, timely and relevant decisions, and therefore need timely and relevant information on production, prices, exports, imports, consumption requirements, deficit or surplus. These would make them better informed when making decisions about producers’ support programme, intervention policies in marketing system and emergency measures in the case of deficit or surplus of a crop and channeling investment in certain priority investment areas. Policy makers also need analysis of different policy options available in a given set of policy issues.
· Farmers
Farmers generally follow the cobweb path and keep on moving around the equilibrium price without achieving equilibrium. They base their production and marketing decisions on their experience. The prices they last received play a central role in their decision-making on where to sell and to whom. If they are given price information, they can compare this with their last sale price, and therefore benefit from having access to a range of options. In the case they receive lower prices, they can seek other traders or negotiate more forcefully. Information on market conditions may also change their marketing strategies. Historical information on prices and production facilitate farmers to make optimal decisions. Generally, farmers need the following types of information:
· Traders
Marketing functions are facilitating functions. Traders need to decide on the purchase and sale points, and therefore information on prices, arrivals, consumption requirements and production are important. Because of new market entries, with deficit area getting more supplies and prices tending to stabilize around equilibrium, traders need market information as follows:
· Agribusiness companies
Agro-industries are the main consumers of agricultural products. The agribusiness companies maximize the use of government and private-sector data, information and services to expedite agribusiness investment and resolve constraints which impede agro-industry development. Specifically, data needs are for:
· Agricultural researchers/economists
Researchers/economists, whether in the public or private sector, need all information on area, production, yield, marketing margins, consumption requirements, distribution arrangements, wholesale prices at important markets, trade data and government policies. They need current and historical data to conduct further analysis for developing policy options for the use of policy makers.
Agribusiness Information System (ABIS)
Information is a valuable commodity, and dissemination makes information more valuable. Therefore, a valuable commodity should be handled carefully and given to those who need it and willing to pay for it. The information needs of the players in the agribusiness sector have been described above. The design of ABIS is developed below.
As discussed above, a vast potential exists for the promotion of agribusiness in Pakistan and government policies encourage and support investment in this sector. Agricultural statistics as disseminated by MINFAL provides basic data, but the ABC in MINFAL should be revitalized to play an active role in establishing comprehensive data, data analysis and dissemination to achieve its objectives. In support of this task the following plan is designed for the ABC.
a. Nomenclature. A change in nomenclature will be made, from Agribusiness Cell (ABC) to Agribusiness Council (ABCon), revitalization, and moved from the public to the semi-public sector, although it will remain under the administrative control of MINFAL. Initially, the Government will finance it. After its successful launching andoperations, ABCon may recover cost of its services from its clients (agribusiness companies and prospective investors).The operational efficiency of four technical services will determine the effectiveness of ABCon and its future existence. The operational efficiency will, in turn, depend on a coordinated approach to build, maintain, update and utilize the Agribusiness Information System as designed above.b. Objective. The objective of ABCon is to stimulate and promote private sector investment in agribusiness and agro-industry. This will be done by providing advisory services and comprehensive agro-based information to the policy makers, farmers, agribusiness companies, prospective investors and creating investment-enabling environment.
c. Methodology. ABCon will be provided with a highly motivated team of qualified personnel particularly in the fields of agribusiness, agro-industry, agricultural economics and computer programming. This team will be supported by a comprehensive agro-based database system and data analysis. The available agricultural statistics provide the requisite data for agribusiness decision-making. These data, along with other relevant data/information, should be disseminated through monthly analytical and biweekly news reports. The reports of the ABCon, as recommended here, will form an integral part of the advisory services.
d. Structure. ABCon will have following four services: Technical,Analysis; Advisory/News; and Monitoring. It will also have a personnel administration section. All services will coordinate with each other to meet the targets of ABCon.
e. Functions of Technical Services
The Technical Service (ABTS) will do the following: (1) collect agro-based data from MINFAL/Economic Wing, Federal Bureau of Statistics, other Federal and Ministries and Divisions, provincial governments particularly the Department of Agriculture, international organizations; (2) develop, maintain and update ABIS; (3) develop the website of ABCon (its proposed name, agribusiness.gov.pk, which should be regularly reviewed for feedback and updating purposed); and (4) connect all the services and sections in ABCon with the ABIS electronically.
The Analysis Service (ABAS) should be responsible for the following:
The Advisory/News Service (ABANS) should
The Monitoring Service (ABMS) is equally important for ABCon. Its responsibilities are the following:
Annex 5.2
AGRIBUSINESS COUNCIL
FORMAT OF FORTNIGHTLY NEWS REPORT BY ABAS OF ABCon
Name: AGRIBUSINESS FORTNIGHTLY NEWS
|
Section |
Contents |
Level of Analysis |
|
1. Agricultural Production |
|
Salient features of |
|
2. Market Trends |
|
Salient features of |
|
3. Agribusiness Activities |
|
|
|
4. Miscellaneous |
|
Salient features of |
Annex 5-3
AGRIBUSINESS COUNCIL
FORMAT OF MONTHLY ANALYTICAL REPORT BY ABCon (ALL SERVICES)
Name: AGRIBUSINESS MONTHLY NEWS
|
Section |
Contents |
Level of Analysis |
|
1. Agricultural Production |
|
|
|
2. Market Trends |
|
|
|
3. International Trade |
|
|
|
4. Advisory Services |
|
|
|
5. Feedback |
|
|
|
6. Miscellaneous |
|
Salient features of |
Annex-5-4
SAMPLE COMMODITY PROFILE
(TO BE PREPARED BY ABANS OF ABCon)
NAME: PULP, PAPER AND PACKAGING INDUSTRY
1. Market Size
The market size of the product may be estimated on the basis of total supplies obtained from local production and imports. The range of annual supplies, the share of local production in total supplies and the average annual growth rates for different products of paper, viz. writing paper, newsprint, paper board, wrapping and packing paper, long fiber wood pulp.
2. Factors affecting demand
Analysis of the major factors affecting demand for the product. This may include rate of population growth, economic growth, increase in per capita income, change in habits.
3. Factors affecting supply
Analysis of major factors affecting supply of the product. This may include demand side, government policy on imposition of taxes, increase in cost of production and profitability.
4. Feasible production volume
Production volume for the present and for the future projects. Estimate for a medium term of 5 years could be of use by the investors.
5. Available infrastructure
Facilities of transport, water, power, communications, disposal of wastes/affluent
6. Availability of raw material
Availability of requisite material for manufacturing of pulp, paper and packaging material locally or importable.
7. Existing facilitates/projects
The number of millsand projects existing, ongoing or in the pipeline; and their production capacity.
8. Suitable location of the project
Location consideration of the access to raw material, access to market for finished goods, availability of required infrastructure for new projects.
9. Incentives for investment (local and foreign)
Government rules and regulations on investment, incentives in taxation, concession on import of machinery or raw material.
10. Other information
Any other information which helps investors to make decisions.
Philippines
Promoting Sustained Agriculture Sector Development Through A Demand-Driven Agribusiness Statistics and Information Systems
Ma. Celeste M. Molina
ASSIST Foundation of the Philippine Statistical
Association
As early as a decade ago, the Philippine Department of Agriculture (DA) had concerned itself with accelerating agricultural productivity and assisting the agribusiness sector. This development thrust was welcomed by the country’s major international development partners, in particular the United States and the European Community. To assist the Philippine Government, the United States Agency for International Development (USAID) agreed to underwrite two major agricultural-agribusiness development grants: the Accelerated Agricultural Production Program (AAPP), implemented from 1988-1992; and the Agribusiness Sector Assistance Program (ASAP), from 1992-1996. A common objective under both programs was strengthening government’s capability for policy planning. A significant component of the programs was improving the national agricultural statistical system. This objective was successfully achieved because it was in this decade when the major surveys of the Bureau of Agricultural Statistics for grains and livestock were significantly improved and the interest and participation of the agribusiness firms to cooperate in statistical surveys were harnessed and better appreciated. Alongside the implementation of the two USAID-DA programs, the legislative branch of government ratified the General Agreement on Trade and Tariff - World Trade Organization (GATT-WTO) that is now apparently adversely affecting the economies of developing member countries including the Philippines. To cushion businesses from the anticipated adverse effects of GATT-WTO, the Philippines has set minimum access values (MAV) for its exports and imports. Moreover, the agricultural sector worked for the passage of the Agriculture and Fisheries Modernization Act (AFMA) of 1997 the goals of which are to “enhance the profitability of the sector and prepare them for the challenges of globalization through an adequate, focused and rational delivery of necessary support services”. One of the key provisions of AFMA is the establishment of a National Information Network (NIN), which primarily focuses on improving access to information that would help in accelerating the modernization of the agricultural sector. The framework of NIN is basically oriented towards the development of a user-friendly agribusiness statistic and information system, very much in keeping with the subject of this Expert Consultation. This presentation will recount public and private sector initiatives and will culminate with a sharing of users’ (private sector) views from some agribusiness firms about the current agribusiness statistics and information systems.
1. Statistical Framework
Agribusiness statistics span all types of data and information that could be gathered on all aspects of the agribusiness system (Chart 1). Following the system flow, agribusiness activities start with securing financing support either through own-source, the banking system or informal sources such as input suppliers cum traders/distributors. Production activities are performed by any one of the following - individual farmers, farmers’ cooperatives and organizations, and corporate farms/firms. These stakeholders could be both the sources and users of useful agribusiness information such as: geographic scope of operation, physical area planted and harvested, marketable surplus, soil condition, product condition, prices received and paid, cost and returns and transport cost.
At the distribution level, there are at least seven types of participants and the following data sets can be made available - transport cost, volumes bought and sold, product specifications, buying and selling prices, amount of financing provided, packaging and handling cost, inventory, among others. Processing channels could be sources of data on raw material specifications, production volume and plant capacities, processing cost, inventory, suppliers and market outlets. Meanwhile the consumption sector which consists of households and institutional buyers could give indications of per capita intake, volume requirements, product specifications, buying prices, expenditure pattern and qualitative information such as tastes and preferences.
External factors that affect the agribusiness system could be monitored and their impacts on the performance of the sector can be analyzed. For example, typhoons affect agricultural production and trigger wild price fluctuations and hence, farm incomes. In some instances, cultural events and religious beliefs sometimes result in geographic supply and demand imbalances which could have implications on marketing and production practices. Varying production technologies adopted by farmers may likewise result in different production levels and costs. Legal and political factors such as government policies and bureaucratic structures are another form of external force that contributes to the system’s performance. Along this line, there is the AFMA to reckon with.
Historically, the burden of providing the bulk of useful statistics and information has always been with government. It was only in the past decade that the private sector started venturing into providing information service, albeit, mostly resulting from re-packaging government-originating basic information. The following pages will therefore dwell on the scope of the agribusiness information systems of the public and private sectors.
Chart 1. The Agribusiness System
2. Public Sector Initiatives
Information support has always been a key tool in any development effort, be it for government or for business. Thus, statistics and information are always considered a public good. Since governments are traditionally recognized as the major consumers of information, most governments have at least one census and statistical agency providing information support that enables them to prepare policies, develop programs and projects and monitor successes or failures of these development instruments. Moreover, the statistics or information units serve as governments’ arm for delivering public service, specifically information dissemination. Considering that agribusiness is a multi-dimensional sector, it is not surprising that agribusiness-related information is spread around several government offices. Very few countries have the infrastructure that attempt to consolidate or develop an integrated agribusiness statistical information system. Through NIN, the Philippines hopes for a truly one-stop-shop platform for the promotion and further development of agribusiness as a key sector in the country’s economic recovery strategies.
Bureau of Agricultural Statistics
In the Philippine agricultural sector, a law created the Bureau of Agricultural Economics (BAEcon) in the early 50s and mandated it to collect agricultural statistics and prepare economic studies on the agriculture sector. To strengthen the country’s market information system, Congress enacted a law that mandates BAEcon to develop a system of collection of important information on the marketing of agricultural products and disseminate the same in the form of regular market news.
In the government-wide reorganization in 1987 the government took positive steps to strengthen the national statistical system. Recognizing the importance of agriculture in the still agrarian Philippine economy, the BAEcon was implicitly abolished with the creation of the Bureau of Agricultural Statistics (BAS) under the Department of Agriculture. The entire personnel complement of BAEcon was integrated into the new bureau. As the country’s official agency given the mandate for collecting and disseminating agricultural statistics, BAS became a recipient of the earlier cited USAID grant that aimed to assist DA improve overall agricultural productivity. The BAS’s component of the USAID grant was aimed at: (a) improving survey designs for grains and livestock; (b) massive statistical training (degree and non-degree) for its personnel; (c) upgrading of its data processing capability; and (d) pilot testing various market information dissemination strategies. As a kick-off activity BAS initiated a series of consultative sessions with agribusiness firms aimed at achieving a dual purpose of determining their information needs and instilling awareness among the private sector on the importance of providing accurate data to the government.
Agricultural Marketing Assistance Service (AMAS)
This unit is located in the Office of the Secretary of Agriculture and with a mandate to provide farmers and agribusinesses with marketing assistance and investment information. It has five divisions: (a) Agribusiness Industry Development Division (AIDD), (b) Market Promotions and Facilitation Division (MPFD), (c) Agribusiness and Marketing Information Division (AMID), (d) Agribusiness Development and Coordination Division (ADCD), and (d) Investment and Enterprise Development Division (IEDD). AIDD, AMID and IEDD do market intelligence but the task is heaviest on AIDD which is in charge of developing the products and markets for 22 priority commodities. A vital and critical input to this work is market information on the demands, preferences as well as information on how markets for the priority commodities are being developed here and abroad. AMID is developing its AMAS website and plans to operate as well, E-commerce and E-services. Meanwhile, the ADCD assists in the development of Regional Agribusiness Development Centers and updates the Regional Agribusiness Profiles. And IEDD promotes investment and enterprise development through investment clinics, promotion of various joint venture modalities and provision of assistance in the establishment and maintenance of Agribusiness Parks in major trading centers in the country.
Agricultural and Fisheries Information Service (AFIS)
AFIS is another unit under the Office of the Secretary of Agriculture with a mandate to effectively package and disseminate information on agriculture and fisheries production and marketing. It serves as the media outfit of the DA that prepares and maintains assorted information materials such as monthly publication covering a wide variety of issues in agriculture, production technology guides for various crops translated into several dialects and illustrated in komiks (cartoons), a popular reading material. The monthly publication has a circulation of 20,000. In addition, AFIS prepares posters, implementing guidelines of various DA national programs and thrusts including DA annual report. All these are circulated in the DA regional offices and disseminated to farmers, fisherfolk and other interested parties. Other product lines include special documentaries, information campaigns, which are usually paid advertisements, TV plugs on DA national programs.
Department of Trade and Industry (DTI)
This is a line agency that caters to the information needs of the business sector. Its major clientele groups are those engaged in manufacturing and trade. Its Bureau of Export Trade Promotion,manages Tradeline Philippines, a web-based information system that contains Philippine Trade Statistics, listing of exporters/suppliers and local/foreign buyers, their addresses and product and market profiles. The database has recently been expanded to contain Philippine Regional Profiles. Tradeline Philippines supports the Filipino exporter/supplier and local buyer in gaining a foothold to new market opportunities through the Internet. DTI plans to venture into e-commerce with the Department Secretary chairing the Information Technology E-Commerce Council (ITECC), a new body that is tasked to oversee the development and promotion strategies of e-commerce in the Philippines.
To ensure that the economic flow of goods and services are not hampered by sharp and sudden market fluctuations, DTI chairs a Price Coordinating Council which is a venue for interacting with manufacturers and wholesalers of key economic goods and services and also for monitoring and validating market information. The Council is a requirement in the Price Act of 1992.
National Statistics Office (NSO)
NSO is the government’s repository of a number of general purpose statistics generated from various surveys and censuses. These include agribusiness-related statistics. Most data collection and processing are done through its field offices nationwide, the lowest level of which is the district. It publishes 29 statistical publication series that provide the main medium for disseminating official statistics. These are prepared and released from the head office. Major statistics are likewise available at the NSO website and some sub-national data could be made available on request and/or for a fee. NSO has also developed public use files containing databases for many of its recurring censuses and surveys such as the Census of Population and Housing, Census of Agriculture and Fisheries and Family Income and Expenditure Survey. In addition, it disseminates monthly statistics on construction, inflation rate, price and production indices, external trade; quarterly statistics on labor force and vital statistics annually from Civil Registration documents.
The Census of Agriculture, which is normally conducted after the decennial Census of Population and Housing is implemented in collaboration with the Bureau of Agricultural Statistics.
3. Private Sector Initiatives
Agribusiness system participants are varied and widespread. Moreover, some are grouped into organizations that are basically venues for policy advocacy with government. However, with regard to market information needs, it is an ‘each to his own’ arena. Large and medium agribusiness firms usually have corporate planning and marketing units that gather production and marketing data to support in planning their own production and project sales. Small firms’ organizational structures may not be as sophisticated as the larger ones; hence their information systems are usually simple that seemed to suit their near-term needs and budget for market intelligence.
With the implementation of the Accelerated Agricultural Production Project (AAPP), the DA strongly promoted private sector cooperation in providing correct statistics inputs in government surveys. In return, DA committed to provide the private sector with feedbacks through its official statistical publications. Moreover, private sector participation/awareness in government statistical operations increased at the onset of the ‘90’s due largely to the USAID support in improving planning capabilities of DA. USAID co-opted with a number of non-government organizations either as principals or co-implementors of its agricultural support programs. Such was the case of the Agribusiness System Assistance Project which was a grant to the Department of Agriculture but whose day-to-day management was awarded to an international consulting firm who in turn farmed out sub-components to NGOs.
The following discussions will present private sector experiences in rendering demand-driven agribusiness statistics and information services. Four cases will be represented namely, a) a non-government professional organization’s experience as a grantee of USAID under the Agribusiness System Assistance Program; b) a university-based agribusiness information service; c) an association of agribusiness participants’ information service; and d) leading agribusiness firm.
Philippine Statistical Association (PSA)
PSA is fifty-year old non-government professional organization of statisticians that is basically concerned with advocating and promoting the statistical profession among the public and private sectors. It has a track record of projects in which it assisted proponents in designing surveys, implementing these and analyzing results via the application of appropriate statistical tools. Currently, it is strongly advocating the integration of statistical efforts through the creation of a Philippine Statistical Authority.
From 1989 to 1997 the PSA was a recipient of two USAID grants in relation to the latter’s project with the Department of Agriculture. These were the Accelerated Agricultural Production Project (AAPP) and Agribusiness Systems Assistance Program (ASAP). Under AAPP (1989-1992), it collaborated with BAS in pilot testing various dissemination strategies for marketing information and in designing and implementing massive statistical training program for BAS personnel. The rationale for the training was the shift of mandate from agricultural economics to agricultural statistics with the same set of human resources.
Under ASAP (1992-1996), PSA rendered technical assistance to BAS in revising survey designs for agricultural crops and livestock, installing a decentralized data processing system, and in enhancing BAS’s market information service. It also assisted the NSO in decentralizing its data processing for commodity flow statistics which is an important information need of the agribusiness sector. The above technical assistance process was never complete without consultations with affected agribusiness groups who became aware of the importance of cooperating with government surveys.
In order to distinguish this grant project, a long-term engagement with USAID, from other short-term projects commissioned to PSA, it was christened Statistical Development and Analysis in Support of the Agribusiness Sector (SDASAS) project. SDASAS started primarily as a facilitating mechanism to improve the statistical services of BAS and make it more responsive to the needs of the agribusiness sector. At mid-project implementation, SDASAS expanded its function into providing direct data services to the private sector through a dissemination outfit that it dubbed as ASSIST. ASSIST is the acronym for Agribusiness System for Statistical Information Services and Technology. ASSIST later became the name of the Foundation that PSA established in order to continue some information services even after the USAID project had terminated. These services were delivered through electronic and print media. (Of the activities that PSA implemented, the EASIBOARD statistical consulting services were among those institutionalized by the Foundation that PSA had established under the name of ASSIST which means Agribusiness Sector Statistics and Information Systems Technology. ASSIST Foundation of the PSA is now on its fourth year of operations.)
EASIBOARD - the electronic on-line information service
EASIBOARD is the corporate nomenclature for this electronically-based on-line system for information services. It stands for Electronic Access to Statistical Information Bulletin Board. The databank has information on production, hectarage, yield, prices, distribution statistics (foreign and domestic) of most agricultural commodities. It is capable of providing these information for commodities like cereals, fruits, vegetables, spices, ornamentals, livestock, poultry, fisheries and inputs like feeds and fertilizers.
Agribusiness information users (about 20 large agribusiness corporations in 1998-1999) availed of EASIBOARD data via a subscription/membership system. A member was assessed a nominal annual fee of P4,000 (USD 80) and P 6,000 (USD 120) in exchange for a set of downloadable pre-paid data. Upon payment of the total of P 10,000 (USD 200), the connection to the subscriber was activated and the downloads were monitored by the system such that the subscriber could no longer download additional data sets the moment the subscribed amount is reached. There were also walk-in clients who merely bought data on retail (the subscriber has to pay additional service charge for every extra set requested beyond his regular subscription quota).
The relationship that developed between PSA and the EASIBOARD clients aroused in the latter a keen interest in statistical analysis. This gave rise to a second generation information service which is statistical consulting.
Information services via the print media
Seven types of publications were conceptualized and statistical data that it was able to access either through its partnership with BAS or as an R & D activity were analyzed, packaged and disseminated to the agribusiness community, government, and researchers. The following are the publications that PSA had produced with brief descriptions of each and insights of PSA-initiated surveys which were the basis of the publications:
This is a publication series that consisted of monthly early warning statistical data on corn, poultry and hogs. It relied heavily on graphs which are the results of statistical models that described the monthly behavior of corn stock, corn wholesale price, volume of dressed chicken, wholesale price of chicken broiler, number of hogs slaughtered and wholesale prices of hogs. The statistical models were able to provide statistical limits such that if the observed phenomenon crosses these limits the graph will signal an alarm point. This was a cue to the user to take appropriate action or preventive measure to reduce whatever anticipated adverse effect of any external factor may have on the industry. AGSTAT.VIEW also provided additional analytical tools for agribusiness entrepreneurs for monitoring stock market. The graphs on stock market behavior were the short-term stock market composite oscillograph, medium and long term indicators of stock market fluctuations. AGSTAT.VIEW gave them a third opinion in their analysis and assessment of the agribusiness situation.
This was the medium for disseminating data from market arrival survey initiated by PSA and implemented in major trading centers in the country. It provided snapshots of the behavior of volume and value of arrivals of fruits and vegetables in major trading centers. The market arrival survey was initiated to achieve a dual objectives of complementing existing price monitoring of BAS and also determining the viability of market arrival data as proxy variable for production estimates for commodities with short production cycles such as fruits and vegetables. The latter however was not achieved because the arrival data failed to provide sharp information on whether the province were the transported commodity originated was the supplying or producing province. Moreover, on account primarily of the high cost of data collection, this survey could not as yet be institutionalized by BAS.
This was a monthly publication for disseminating the results of the monthly survey of florists in Metro Manila and Cebu. It consisted of graphic information on the trends of sales of the most important varieties of cutflowers. Other data were price, volume, imports and exports. The variation in the supply in major production areas was also provided. The survey of Metro Manila and Metro Cebu florists holds the distinction of being the first statistical monitoring system for the increasing cutflower industry. It was developed and implemented by the project for three years. Through this activity, BAS was able to directly touch base with major cutflower growers. In the process, the statisticians gained useful insights on the intricacies of the industry which helped in evolving a more efficient and cost-effective system for monitoring the developments of the cutflower business.
These were capsulized commodity profiles that were generated from extensive marketing assessments done by PSA which later on served as basis for re-engineering BAS’s marketing information system into commodity-focused marketing systems.
This was packaged in response to the demand for this type of information by agribusiness players met by PSA while conducting business promotion and statistical awareness campaigns. Ten directories were produced covering hog and poultry raisers and suppliers, palay and corn sample barangays, socio-economic classification of barangays (villages) in selected major cities, commercial feedmillers, agribusiness establishments, meat establishments and agribusiness importers and exporters. Among the lessons learned is that a directory is developed only upon demand and because publication could be available much later, timeliness suffers. Furthermore, because of high volatility of information, a directory must be updated often and this could be facilitated if kept in soft copy.
These are actually research reports from commissioned researches of the project. Topics included options for developing sampling frames; relationship of climatological phenomena with agricultural production; framework for an agribusiness production account and input-output table; and statistical models for production and marketing forecasting and analysis.
Other Outreach Services of ASSISTThis is another reactive type of publication that responded to queries on what commodities should be profitable agribusiness ventures. Six investment profiles were prepared during the life of the project.
Hand in hand with BAS, this pioneering effort in the Philippine statistical community was a bold attempt to educate farmers on reading and understanding statistical graphs and tables and how to use them to improve their production and marketing decisions. Three pilot provinces were used as the launching pads for this venture. The interpretations/conversion of the statistical graphs and tables into farmer based level of understanding were done through the publication of comics (cartoon) magazines, which is the most readable medium in the rural areas. These were printed every month and delivered to the farmers through the farmer-trainors who were trained on what messages could be gathered from the charts. After six months, the farmer-trainors had already acquired a fairly acceptable level of understanding and interpretation of time series data. As this was not aimed to serve as a revenue generating activity of the PSA, after a while it passed on the methodology to BAS who was able to find funding support through a number of foreign-assisted projects of the Department of Agriculture, particularly those that had marketing information service as one of their many components. BAS was thus able to expand area coverage to a few other provinces.
The same farmer-clientele in the original pilot provinces were also the respondents for another R&D effort that PSA introduced after the LAPAMAS technology had been comfortably assimilated. This supplemental activity was actually a farm-record keeping of costs and returns in which a data processing system was installed in the cooperatives’ computer and the cooperatives’ computer staff were trained on how to generate the data from the farmer-members, input these into the system and generate and interpret the resulting averages. This was a six-month information service improvement effort from which PSA gained the following insights - (a) data would naturally be more accurate if these were recorded soon after the activity or transaction took place; (b) farmer-cooperators felt obligated to participate in the project to show their support for their officials; (c) training was very acceptable to the farmers; and (d) because farmers came to be aware of their expenses and income status majority expressed interest in continuing to keep records although many of them suggested simplifying the recording form. After the project funding from PSA ended, BAS received funding from FAO to continue the project in the original sites and even acquire new computers for the cooperatives. Based on the original design by PSA, this activity was viewed as a cost-effective model strategy to generate more accurate farm-based data.
To a limited extent, PSA achieved its principal objective for initiating this activity. This was to set up a forum that would strengthen linkages with the private sector in order to improve agricultural statistics, in this particular instance, the livestock and poultry industry. Some of the big livestock integrators have willingly given out their company’s growth expectations. Moreover, it was realized that it was not difficult to establish rapport with both the large and small-scale industries.This was a semestral non-probability survey (basically following the delphi technique) of selected agribusiness entrepreneurs that seek to get a reading of their pulse or expectations on current and emerging issues that may affect the growth of the agribusiness sector. A four-page pre-structured questionnaire elicited the following types of information - (a) experts expectations on individual business activities or business-related factors; (b) respondents’ overall expectations on agribusiness growth; (c) macroeconomic indicators affecting agribusiness, i.e., GNP, inflation, peso-US dollar exchange rate; and (d) opinions on issues that are currently of interest to the agribusiness sector. Initially limited to Metro Manila agribusiness players in poultry, animal feeds, grains, food processing, fisheries, horticulture subsectors, the survey was expanded to include agribusiness practitioners in Cebu and Davao Cities.
University of Asia and the Pacific’s (UAP) Center for Food and Agribusiness
This private academic institution is now the most visible among other similar institutions. The Center offers undergraduate and masteral degrees and also non-degree trainings and seminars in various agribusiness topics.
In addition to its academic program, the Center also has its own agribusiness information service. It has the longest-running monthly agribusiness publication which draw support from its corporate patrons in agribusiness. The Food and Agribusiness Monitor is now on its seventeenth year. Unlike its competitor agribusiness publications, the Food and Agribusiness Monitor is more comprehensive in terms of content on marketing information and statistics. The latter are sourced from the NSO, BAS and various issues of business publications. The Center also generates primary data on processed food retail prices, which its personnel based in Metro Manila, Cebu and Davao, gather periodically but without a scientific methodology. Other primary information is sourced through market studies commissioned by corporate clients or through UAP sponsored seminars. Data processing activities involve computerization for indices, averages and economic equations to compute competitiveness or profitability.
Other types of database that the Center maintains are published in the annual agribusiness Factbook and Directory series. The circulation covers about 750 subscribers nationwide.
The Center also conducts regular surveys of its subscribers in order to determine their comments on the publications and other issues of interest and to identify other information needs. However, a low response rate is achieved. Nonetheless, based on their interaction with practitioners who are either their clients in special market studies or were their seminar participants, there is still felt need for marketed volume, sources of supplies, seasonality of various crops, and tariffs among others.
Philippine Food Processors and Exporters Organization, Incorporated (PHILFOODEX)
PHILFOODEX is one of several umbrella associations of the agribusiness sector. Established in 1986, it now has 200 members including those from allied industries. As an umbrella organization of both food processors and exporters, PHILFOODEX focuses on the planning, development and sourcing of raw materials, on research and technology development, on the improvement of the manufacturing efficiency and productivity, and promotion of sound trade practices in order to be competitive and responsive to the changing international food market trends (PHILFOODEX Brochure).
Given this mandate, PHILFOODEX’s activities include market matching, implementation of R&D projects, organizing seminars, and participation in trade shows and exhibits. Agribusiness information service is more of a demand-driven rather than a regular activity. Most data are generated from the DTI’s website, BAS, NSO, the DA’s Agricultural Marketing Assistance Service and Philexport. However, these data sets have not been structured into a statistical database. The Secretariat also had tried several times to compile a profile of the members but every attempt yielded low response rates. The organization does not have a regular publication; information needs of its members are addressed individually.
San Miguel Corporation (SMC)
San Miguel Corporation (SMC) is the largest food and industrial conglomerate in the Philippines with substantial businesses outside the country. It has a central Corporate Planning Department that uses a lot of economic and agribusiness statistics. The types of agribusiness data they often use are cost and returns, prices, crop productions which they input into their economic models which are used in a lot of investment decisions they make. Besides the Corplan Department, SMC also has an agribusiness division that maintains databases for corn and coconut. There are still other divisions like SMC Foods and Poultry and Feeds that have their own databases which mostly come from government and which they update regularly. In addition to the data they already have, they prefer that information on market opportunities, return on investment and others that will facilitate and fast track investment analysis on their part would become readily available.
4. Data Users’ Views About Agribusiness Statistical and Information Systems
In the interviews that this author conducted with a few agribusiness participants, it became evident that their immediate concern about agribusiness statistics and information systems is the need to get the most current and accurate information in a quick and timely fashion in order to make informed and sound day-to-day business decisions. This is a very valid concern since most agricultural commodity production and marketing systems are by nature cyclical and short-term. Two small agribusiness firms interviewed opined that their suppliers remain to be their most reliable sources of current production and marketing situationers. One of the respondents who is an active member of PHILFOODEX even said that they prefer purchasing their requirements from traders rather than producers’ associations because of lower transactions cost.
In the private sector cases cited above, only PSA had a clear and organized statistical information system, largely due to the fact that this is an NGO of statistical experts. They used the project grant as an opportunity for advocacy and to communicate and propagate their vision of the value and importance of statistics in the agricultural sector. They fielded a core group of their members to visit various producers and trade associations in the agricultural sector in order to generate their cooperation in providing accurate data about their production and trade activities. The initial response was encouraging but later in the day data flow started to slow down.
UA&P’s Center for Food and Agribusiness believes that the Department of Agriculture’s Agribusiness Marketing Assistance Service could render a similar information service that caters to medium and small agribusiness firms. PHILFOODEX thinks that associations like them should have a statistical database and information system. Small firms such as two of its members who were interviewed do not maintain databases and address their information needs in any of three ways namely, retrieving government data only when needed, relying on their suppliers who are right in the marketplace and approaching their respective associations. There is still a general sentiment of doubt on government figures particularly production data. Moreover, the comments they gave on government statistics are not as emphatic as what they said about policies and their implementation. Because government statistics predominate San Miguel Corporation’s database, they noted that agribusiness statistics have improved a lot.
The National Information Network (NIN)
This is a key provision of the AFMA of 1997 which will eventually see accelerated implementation within this year as emphasized by President Gloria Macapagal Arroyo in the Joint Session of the 12th Congress. According to the Implementing Rules and Regulations (IRR) of AFMA, the NIN “refers to an information network which links all offices and levels of the Department with various research institutions and local end-users, providing easy access to information and marketing services related to agriculture and fisheries”. The NIN will provide for the electronic exchange of valuable information between DA and its bureaus, regional field units, attached agencies and other government and non-government institutions involved in the production and utilization of agriculture and fisheries data.
Agriculture and fisheries enterprises will also be able to access or use the NIN In this regard, the AFMA also authorizes DA to formulate guidelines and charge fees to the private sector entities that use the NIN. This strategy will allow for cost recovery for further improvement and sustainability without disregarding equity in accessing the network, particularly by small and subsistence farmers and fisherfolks and their associations. Moreover, this information service to the small and medium enterprises would also provide an opportunity to the DA to improve the timeliness of its databases by designing the NIN to be an interactive system. This could yet be the realization of efforts initiated by PSA in getting the private sector particularly trade and industry associations to provide the government with accurate and timely data on their activities. After a decade of continuous interaction with the private sector regarding their needs and sentiments about several agribusiness issues and the “globalization clock” ticking away, the urgency of this information service could not anymore be further emphasized.
References
Global Competitiveness Strategies for Philippine Agribusiness: Market Intelligence and Promotions System Study. Foundation for Resource Linkage and Development. July 2000.
Statistical Development and Analysis in Support of Agribusiness Sector - Agribusiness System for Statistical Information Services and Technology: Process Documentation Report Vol. I and II. Philippine Statistical Association, Inc. December 1997.
Republic Act 8435: The Agriculture and Fisheries Modernization Act of 1997. Implementing Rules and Regulations. Department of Agriculture. July 10, 1998.
Thailand
Harnessing information and communication technology (ICT) facilities to promote a user-responsive agribusiness statistics and information system in Thailand
Apichart Pongsrihadulchai
Secretary-General, Office of Agricultural Economics,
Ministry of Agriculture and Cooperatives
1. Introduction
The agricultural sector in Thailand, although declining in relative terms, still has a significant role in the national economy. During the last two decades, GDP in the agricultural sector, at 1988 prices, increased from 184,576 million baht in 1980 to 298,060 million baht in 2000. Its contribution to the national economy, on the other hand, decreased from 20.2 percent to 10.0 percent. The agricultural population also increased from about 30 million to 37 million while its proportion dropped from about 70 percent to about 60 percent.
Agricultural exports increased almost ten times from 81,642 million baht to 619,927 million baht but its share in total exports fell from 61 percent to 22 percent. It is interesting to note that the balance of international trade in agricultural products remained positive while that in non-agricultural products was negative except during the economic crisis in 1997-1998 when the imports showed a dramatic decrease. Furthermore, many agricultural products exported from Thailand were ranked at the first or the top ten of the world agricultural trade. These included rice, natural rubber, tapioca products, sugar, canned pineapple, frozen shrimps and frozen chickens.
It is not an exaggeration for Thailand to be considered as a “kitchen of the world”. Agribusiness has become important in the economy of the country. Hence the urgent need for the compilation and preparation of agribusiness statistics and information.
National Agricultural Statistics System in Thailand
The statistical system of Thailand is decentralized, with each ministry s collecting statistics to serve its own needs, either through surveys or as products of administration. The principal agencies involved in agricultural and fisheries statistics are the following:
National Statistical Office (NSO), an agency under the Office of the Prime Minister, is responsible for conducting all censuses, relating to population, agriculture and fisheries, and industries and many large-scale surveys, excluding agricultural surveys, such as those on labor force and household socio-economics.
Office of Agricultural Economics (OAE), an office under the Ministry of Agriculture and Cooperatives (MOAC), is the prime agency responsible for collection, compilation, and dissemination of all current agricultural statistics, especially agricultural production statistics. It is the official source of agricultural statistics of the country. Other major functions of the OAE, besides the agricultural data collection and dissemination, include the conduct of agricultural economic researches, analysis of and formulation of appropriate agricultural policies development plans as well as monitoring and evaluating the important programs and projects of the MOAC. OAE has about 1,000 permanent staff members and officials, 300 of whom are attached in 24 agro-economic zone offices. OAE also compiles relevant agricultural statistics based on data collected from other agencies inside and outside the MOAC. These statistics are published in the Agricultural Statistics Yearbook, stored in the database of the OAE, and disseminated to the general public in various forms including the Internet.
Department of Agricultural Extension (DAE), which compiles statistics on area and production of various crops from the reports of its local offices, has agricultural extension officers in every tambon (sub-district). These data are collected mainly for internal uses.
Department of Livestock Development (DLD), which collects and publishes data on number of animals raised and slaughtered, death from epidemic diseases, vaccinated and number of beasts of burden (elephants, horses, mules and asses). These are compiled from the reports of its local officers stationed in every district.
Department of Fisheries (DOF), which collects and publishes all fisheries statistics. The Amphoe (district) Fisheries Office is the lowest administrative level of the DOF.
Department of Business Economics (DBE) of the Ministry of Commerce, which collects and disseminates statistics and information on trade, wholesale and retail prices of all products including agricultural products.
Other Agencies, including several that compile and disseminate agribusiness and related statistics and information, namely, Department of Export Promotion and Department of Foreign Trade, Ministry of Commerce, Customs Department, Ministry of Finance Bank of Thailand, Office of Industrial Economics, Ministry of Industry and National Economic and Social Development Board (NESDB).
2. Major Items of Agribusiness Statistics and Information
Agribusiness and related statistics are required to facilitate domestic and international agricultural trade. In recent years, there has been growing importance in agribusiness statistics and information among commercial crop farmers, traders, exporters, importers, agro-industries, government agencies, and consumers. Although the definition of agribusiness is not clear, in general agribusiness statistics and information system should include at least the following major items:
Whenever possible, data and information on major trading partners should be collected and supplied to the domestic users. However, there may confidentiality in some of the above information in many countries, such as production cost and stock, hence may be difficult to collect.Production quantity by type of grade or quality of the products
It is interesting to note that after the advent of the World Trade Organization (WTO), the emergence of regional trade blocs and the evolving practices under the banner of “trade liberalization,” many important trade issues related to environment, sanitary and phytosanitary (SPS), animal welfare, and the multifunctionality of agriculture have emerged in regard to the tax issue. These issues very often are intentionally designed to protect the domestic producers in importing countries. However, for exporting countries, the same issues are considered as another non-tariff trade barrier (NTB). On the contrary, importing countries emphasise that those issues are important for consumer or environmental protection. These data and information need to be collected and carefully studied to enable negotiation with the concerned trading partner countries or adapt for ourselves to meet the requirements of importing countries.
3. Role of Information and Communication Technology
There is no doubt about the importance of information in any field especially during this period termed as “information era” or the “New Economy Era” as it is called today. The influence of information and communication technology (ICT) on the way of life of all people in all countries around the world including farmers in the very remote area has become greater. Those with access to more detailed and more rapid information will have more advantages than those with limited and outdated information. In this fast-developing world, we are competing with other people not only in “economies of Scale” but also in “economies of speed.” This requires the application of ICT. The major roles of ICT in agribusiness are mainly to search for and disseminate information all over the word. In the past, searching for and dissemination of information was time-consuming and expensive because the information was generally disseminated mostly in paper-based form or through the mass media such as newspapers, radio and television.
The emergence of Internet technology has now made it possible to search for and find the necessary information worldwide and on-demand very easily and quickly. Furthermore, the convenience of advertising or selling products worldwide using e-commerce facilities of the Internet technology has led to the rapid expansion of business activities including agribusiness. In the future the development of e-farmers is also important for farmers who can access agribusiness statistics and information through the ICT. The future network of MOAC is shown as an attachment.
Application of the Internet
Since it’s the beginning of its existence, the Internet has became a popular means of information dissemination in every field, including agribusiness. In Thailand, almost every department has a website to publicize its activities. The names of the relevant and important websites contained agribusiness statistics and information are shown below:
|
Department |
Address |
|
|
A. Office of Agricultural Economics |
http://www.oae.go.th |
|
|
Office of Agricultural Economics |
http://www.thaifarmer.oae.go.th |
|
|
Department of Agricultural Extension |
http://www.doae.go.th |
|
|
Department of Agriculture |
http://www.doa.go.th./ |
|
|
Department of Cooperative Promotion |
http://www.cpd.go.th |
|
|
B. Department of Fisheries |
http://www.fisheries.go.th |
|
|
|
Office of the Permanent Secretary for Agriculture and
Cooperatives |
http://www.moac.go.th |
|
|
Department of Business Economics |
http://www.dbe.moac.go.th |
|
|
Department of Foreign Trade |
http://www.dft.moc.go.th |
|
|
Department of Export Promotion |
http://www.depthai.go.th |
|
|
Department of Internal Trade |
http://www/dit.go.th |
|
|
Bank of Thailand |
http://www.bot.go.th |
|
|
Bank for Agriculture and Agricultural Cooperatives |
http://www.baac.or.th |
|
|
Export-Import Bank of Thailand |
http://www.exim.com/ |
|
|
Office of the National Economic and Social Development
Board |
http://www.nesdb.go.th/ |
|
|
National Statistic Office |
http://www.nso.go.th |
|
|
Kasetsart University |
http://www.ku.ac.th |
|
|
|
http://www.thaiagris.lib.ku.ac.th |
|
|
|
http://www.ifrpd.ku.ac.th/ |
|
|
Private agency |
http://www.thai-frozen.or.th |
|
|
|
|
Furthermore, the government plans to install Internet facilities in all 7,000 Tambons nationwide within 5 years. Already about 100 Tambons already have Internet facilities. This facility will enhance the agribusiness activities within the country and over the world.
4. Problems
The problems of using ICT facilities to promote a user-responsive agribusiness statistics and information system are the following:
Quality of data/information
In many cases, the data and information are not up to date, and sometimes, inconsistent with those of different agencies. Data and information on many needed items such as current stocks and marketing volume have not been collected. Most of the information on Webpages are presented in Thai language, which makes it difficult for foreign users.
Personnel
The operation and improvement of the information system require experienced or qualified personnel. Many government agencies still have limited staff in this field. Furthermore, the response to the questions in BBS was very slow and sometimes non-existent. This is because the information knowledge of the operator is very limited.
Product standards
Lack of product standards is another problem. It makes the adoption of e-commerce very difficult.
Publicity
Traders and agribusiness people are not well-informed on the availability of existing information. Currently, there is no website that is specifically designed for agribusiness purposes.
4. Conclusions and Recommendations
The agricultural sector is very important to the national economy, exports from this sector being a major source of foreign earnings. Agribusiness statistics and information system are a critical factor in rational decision-making among farmers, traders and processors. There is no information system that has been specifically designed for agribusiness purposes. The information is scattered in many agencies and websites. Consequently, it is not convenient for data users. To make the system more effective, the following activities are recommended.
![]()
![]()
 Crop
Estimates
Crop
Estimates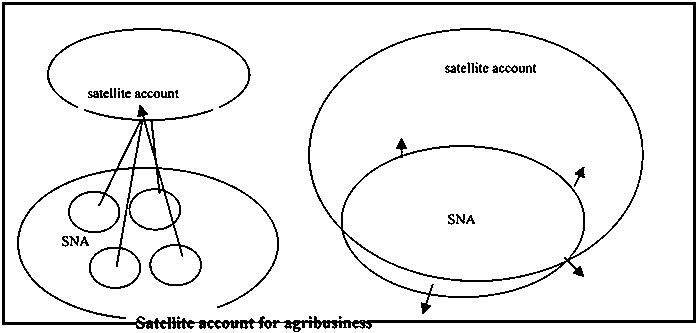
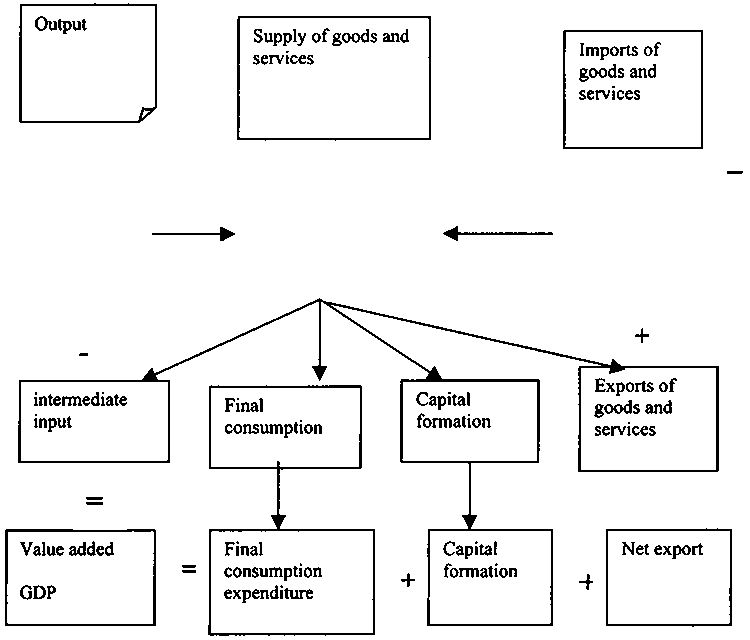
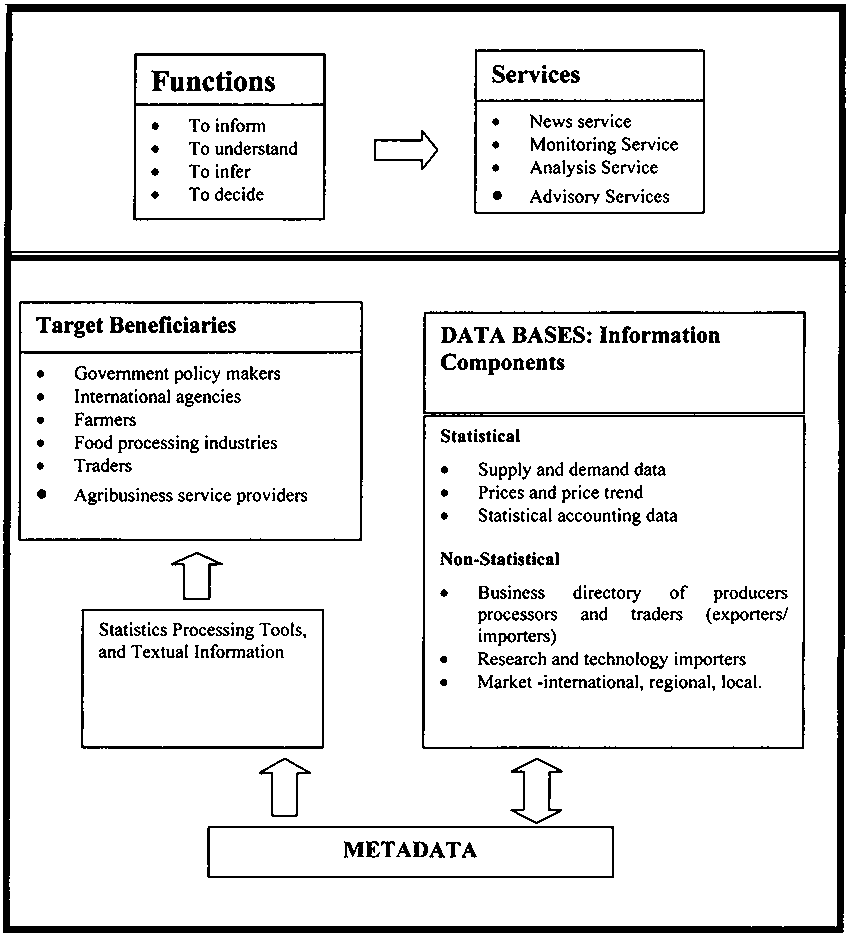
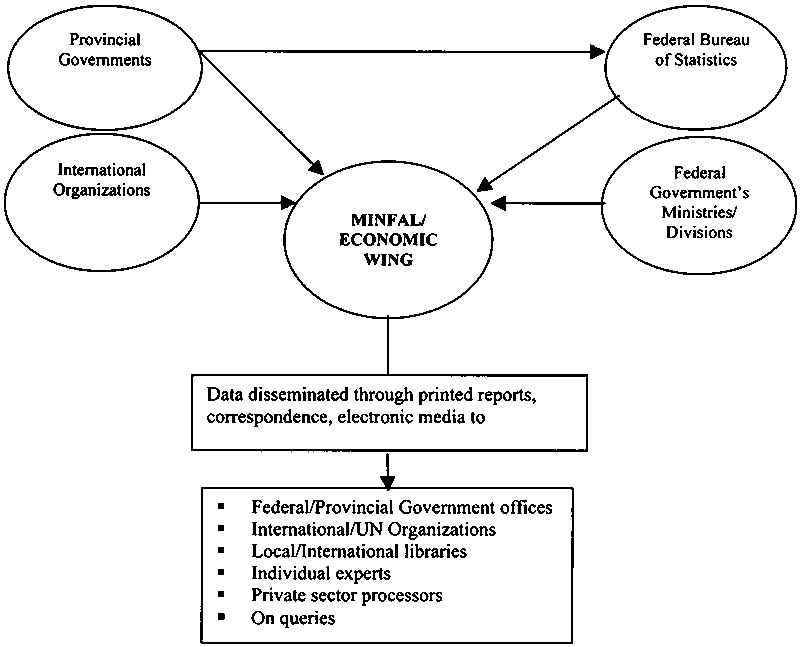
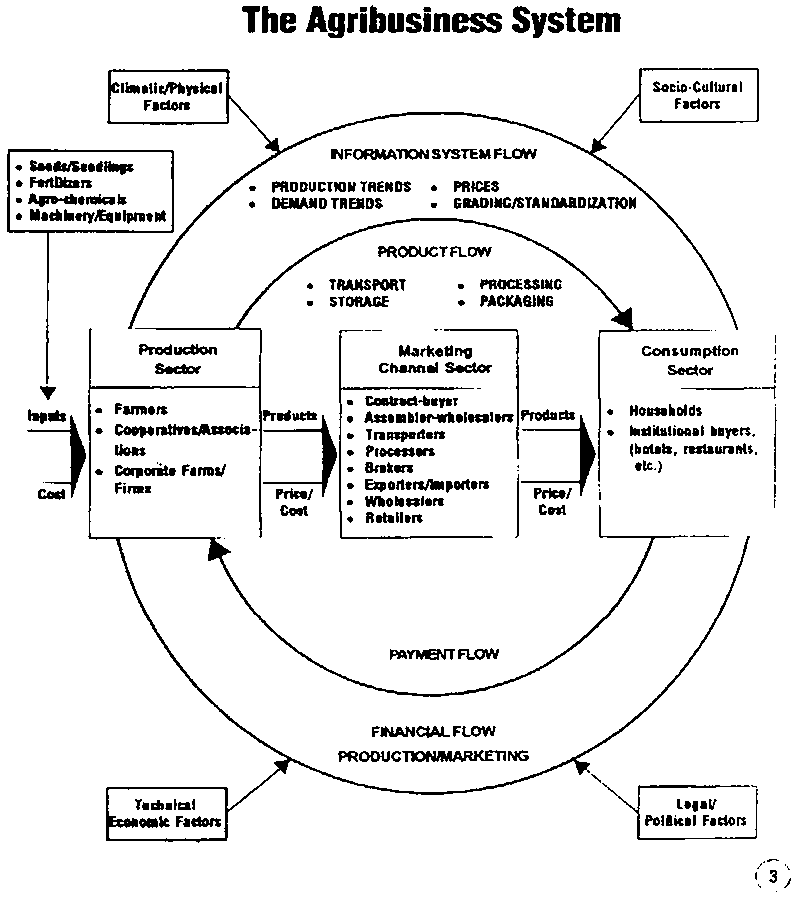