Fishfarming is a business enterprise. Although it does not have the complexities of some other business ventures, its success lies in the owner or manager who must have a complete and clear picture of the business situation at any given period of time. A business must have a complete understanding of its financial situation for guidance in directing future operations.
To have complete understanding of the business situation, the owner or manager must be equipped with all business data and be aware of its activities. Every record of the business must be kept for financial analysis and accounting. Accounting serves to record and compute all the expenses and income which is needed in the preparation of the profit and loss of the business. The process of recording business data is called bookkeeping. The book as it is called, reflects all transactions of the business. However, bookkeeping methods must be simple to be effective and adaptable to fishfarmers.
Expenses and income are opposite. Expenses are monies spent in buying inputs and services for the business. Income results from sales of products like “bangus” and “sugpo”.
For example, let us record the operations in the farm for the month. During
the period, the fishfarmer procured the following inputs: Bangus fry,  600.00;
Fertilizers - organic,
  100.00, inorganic,
  200.00; Lime,
  100.00; Gasoline,
  70.00;
and ice,
  30.00. He then sold marketable sized bangus from one of the rearing ponds
worth
  2,000.00 and paid wages for repairs for
  300.00.
This data can be recorded in a notebook in the following manner:
| Income | Expenses | |
| Purchase of “bangus” fry |  600.00 600.00 | |
| Purchase of fertilizers: | ||
-organic | 100.00 | |
-inorganic | 200.00 | |
| Purchase of lime | 100.00 | |
| Purchase of gasoline | 70.00 | |
| Purchase of ice | 30.00 | |
| Sale of “bangus” |  2,000.00 2,000.00 | |
| Wages | 300.00 | |
| T o t a l |  2,000.00 2,000.00 |  1,400.00 1,400.00 |
This two-column recording of business data is the method commonly used and can be easily adopted by the fishpond operators, fishfarm managers and caretakers. Information which is very important in assessing the business at any given period of time, dates of transactions, quantity of materials procured and price per unit are recorded. As a rule, records must be chronological, dates are recorded as they occur.
A two-column journal, available from any bookstore, is commonly used in recording business transactions. The left-most column is used to record dates of activities, the wider columns for remarks describing the activities, and the two right-side columns for income and expense. (Appendix C)
To illustrate how it is used, let us go back to our earlier example. Let us assume further that this series of transactions was done for the month of March 1979, as follows:
| March 2 | - | The fishfarmer procured 6,000 pieces “bangus” fry at  100.00 per thousand amounting to 100.00 per thousand amounting to  600.00. 600.00. |
| 4 | - | He purchased the following: |
| Fertilizers: | ||
-Organic (100 kgs. chicken manure at  0.10/kg amounting to 0.10/kg amounting to  100.00) 100.00) | ||
-Inorganic (2 bags 16–20–0 at  100.00/bag amounting to 100.00/bag amounting to  200.00) 200.00) | ||
Lime (2 bags at  50.00/bag) amounting to 50.00/bag) amounting to  100.00 100.00 | ||
Gasoline (35 liters at  2.00/liter) amounting to 2.00/liter) amounting to  70.00 70.00 | ||
| 20 | - | Purchased ice worth  30.00 and during the day sold 400 kgs “bangus” at 30.00 and during the day sold 400 kgs “bangus” at  5.00/kg amounting to 5.00/kg amounting to  2,000.00 2,000.00 |
| 30 | - | Paid laborer's wages from March 1–30 amounting to  300.00 300.00 |
When recorded, the journal may appear in this manner:
| Date | Remarks/Activities | Income | Expenses |
| Mar. 2 | Purchase of “bangus” fry (6,000 pcs. at  100.00/thousand) 100.00/thousand) |  600.00 600.00 | |
| 4 | Purchase of fertilizers: | ||
-Organic (chicken manure, 1,000 kg at  0.10/kg) 0.10/kg) | 100.00 | ||
-Inorganic (2 bags 16–20–0 at  100.00/bag) 100.00/bag) | 200.00 | ||
Purchase of lime (2 bags at  50/bag) 50/bag) | 100.00 | ||
Purchase of gasoline (35 lit. at  2/lit) 2/lit) | 70.00 | ||
| 20 | Purchase of ice | 30.00 | |
Sale of bangus (400 kilos at 3–4 pcs. a kilo at  5.00/kg) 5.00/kg) |  2,000.00 2,000.00 | ||
| 30 | Wages for labor (Mar. 1–30) | 300.00 |
The work of the bookkeeper may end in this simple recording of transaction or it may go on even further. It is in fact advisable for a fishfarm owner or manager to know other bookkeeping techniques and making of financial statements, particularly the profit and loss statement. The operation of the fishfarm is composed of series of activities: procurement of inputs, marketing, and other activities are undertaken periodically depending on the scope of its operation. Because of the repetitions of transaction or business activities, the bookkeeper can group together the same activities under one common heading. This group of the same activity or business data is called an account.
Accounts that can be used in a fishfarming business are:
For income: headings can be “bangus” sales, “sugpo”, and sale of miscellaneous fish species
For expenses: the account should be “bangus” fry, repairs, salaries and wages, fuel and oil, marketing cost and incentive allowance.
If these are properly done and organized, the accounts will give the owner or manager accurate information on what has happened in the business as to its income and expense accounts which are needed in preparing the profit and loss statement and other financial statements. At the end of a certain period, these accounts will reflect the following:
Total income derived from:
Expenses incurred for:
Income Statement - Income statement or profit and loss statement is the summary of the income and the expenses of a business for a specific period of time. It is a complete reflection of the business status.
Gross Sales or Gross Income - The total income derived from operating the business.
Operating Expenses - A summary of all the expenses incurred in the direct purchase of fertilizer, “bangus”/“sugpo”, repairs and other related expenditures.
Overhead and Administrative Act. - Expenses incurred which do not directly affect the operation, like salary of the manager, cost of office supplies and materials and traveling expenses.
Marketing Cost - Expenses incurred in marketing of products, market fees and hauling expenses.
Depreciation - Decline in the value of assets caused by wear and tear, action of the elements, obsolesence and inadequacy. The cost of such assets should be charged to expenses in a systematic manner during their useful life. Assets such as buildings and wooden gates depreciate over a period of time. Depreciation is commonly computed by dividing the total cost over the expected life of the asset.
Net Income or Net Profit - The excess of the income over the expenses. If the income is less than the expenses, the business will incur a net loss.
As an example, let us assume that we are preparing an income statement for a year's fishpond operation. The income statement may appear in this format:
| Gross Sales | ||
1. “Bangus” |  50,000.00 50,000.00 | |
2. “Sugpo” | 100,000.00 | |
3. Miscellaneous Species | 20,000.00 | |
| T o t a l |  170,000.00 170,000.00 | |
| Less: | ||
Operating Expenses | 30,000.00 | |
Overhead & Administrative Cost | 25,000.00 | |
Marketing Cost | 5,000.00 | |
Interest & Bank Charges | 30,000.00 | |
Depreciation | 5,000.00 | |
| T o t a l | 95,000.00 | |
| Net Profit Before Tax | 75,000.00 | |
| Provision for Tax (10%) | 7,500.00 | |
| Net Profit After Tax |  67,500.00 67,500.00 | |
Notice that in the example, the owner did have a net income or profit after one year of operation.
The greatest constraint in fishpond development is the initial investment. Experience shows that development of a fishfarm is very costly. One solution is to obtain credit assistance from financing institutions.
This section will discuss the questions, how is loan repaid, amortization, and how amortization is computed.
Amortization is the retirement of a loan through payments of principal and interest. The definition and concept are very simple; the actual payments of amortization may be very difficult.
To know how loans are amortized, it is important to understand the terms used in this discussion:
Principal - The sum of money owed or loaned upon which interest is computed.
Interest - Money paid for the use of money, a charge of a financial loan, the rate of such payments is expressed as a percentage of the amount loaned per unit of time.
Grace period - A period of time granted beyond the date set for the payment of an obligation or loan. A temporary exemption where no payments of the principal is required but interest is added.
The rate of interest charged for a loan depends on existing banking regulations. Supply and demand act on money costs as with other commodity costs. Interest rates also depend on the maturity date of the loan.
In like manner, the rate of annual amortization depends on the amount of interest, the number of years the money required for the repayment and grace periods. If the project is simple, and has almost immediate returns, the period of time before starting repayments can be shortened. If the return is large, the rate of repayment can be increased. Conversely, if the project is expected to take a lengthy time to go into full production, say a new fishpond, amortization can be delayed.
Let us now discuss how amortization is computed at different rates and different grace periods. It is computed by the use of the formula:
 | ||
| Where: | A = | the annual amortization |
| a = | the total amount of loan or principal | |
| f = | a factor taken by the use of a Table (Appendix D). The factor is the point where n (no. of years principal is to be repaid) and i (interest rate) meet in the table. |
For example, let us assume that a fishfarmer availed of a loan amounting to
 100,000.00.
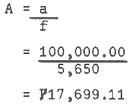
The loan will be repaid in 10 years at 12% interest without grace period.
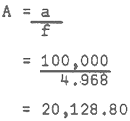
The loan will be repaid in 10 years at 12% interest with 2 years grace period.
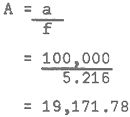
The loan will be repaid in 10 years at 14% interest without grace period.
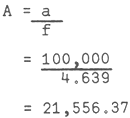
The loan will be repaid in 10 years at 14% interest with 2 years grace period.
Using the formula, the annual amortization will be:
1) The interest rate of 12% is computed using the yearly balance of the loan. Payments of principal is computed by deducting the amount of interest from amortization. This payment of principal is likewise deducted from the balance of loan at the beginning. The schedule of repayments in a 10-year period is shown in Table 1. Using the formula, the annual amortization will be:

| Year | Balance of Loan Beginning | Amortization | Interest (12%) | Payment of Principal |
| 1 |  100,000.00 100,000.00 |  17,699.11 17,699.11 |  12,000.00 12,000.00 |  5,699.00 5,699.00 |
| 2 | 94,300.00 | 17,699.11 | 11,316.11 | 6,383.00 |
| 3 | 87,917.89 | 17,699.11 | 10,550.15 | 7,148.96 |
| 4 | 80,768.93 | 17,699.11 | 9,692.27 | 8,006.84 |
| 5 | 72,762.09 | 17,699.11 | 8,731.45 | 8,967.66 |
| 6 | 63,794.43 | 17,699.11 | 7,655.33 | 10,043.78 |
| 7 | 53,750.65 | 17,699.11 | 6,450.08 | 11,249.03 |
| 8 | 42,501.62 | 17,699.11 | 5,100.19 | 12,598.92 |
| 9 | 29,902.70 | 17,699.11 | 3,588.32 | 14,110.79 |
| 10 | 15,791.91 | 17,699.11 | 1,895.03 | 15,791.91 |
 76,978.93 76,978.93 |  100,000.00 100,000.00 |
The same formula as indicated above is used in computing amortization for loans having a 2-year grace period, however, the payment of amortization will actually be for a duration of 8 years as shown in Table 2. The computed annual amortization will be:

| Year | Balance of Loan Beginning | Amortization | Interest (12%) | Payment of Principal |
| 1 |  100,000.00 100,000.00 | - |  12,000.00 12,000.00 |  - - |
| 2 | 100,000.00 | - | 12,000.00 | - |
| 3 | 100,000.00 |  20,128.80 20,128.80 | 12,000.00 | 8,128.00 |
| 4 | 91,871.20 | 20,128.80 | 11,024.54 | 9,104.00 |
| 5 | 82,765.94 | 20,128.80 | 9,931.91 | 10,196.00 |
| 6 | 72,569.05 | 20,128.80 | 8,708.29 | 11,420.05 |
| 7 | 61,148.54 | 20,128.80 | 7,337.82 | 12,790.90 |
| 8 | 48,357.56 | 20,128.80 | 5,802.91 | 14,325.86 |
| 9 | 34,031.67 | 20,128.80 | 4,083.83 | 16,045.00 |
| 10 | 17,986.67 | 20,144.07 | 2,158.40 | 17,986.67 |
 85,047.67 85,047.67 |  100,000.00 100,000.00 |
Using the same process as in No. 1 Table 3 shows a 10-year amortization schedule for loan bearing 14% interest annually. The annual amortization is computed as:

| Year | Balance of Loan Beginning | Amortization | Interest (14%) | Payment of Principal |
| 1 |  100,000.00 100,000.00 |  19,171.78 19,171.78 |  14,000.00 14,000.00 |  5,171.78 5,171.78 |
| 2 | 94,828.22 | 19,171.78 | 13,275.95 | 5,895.83 |
| 3 | 88,932.39 | 19,171.78 | 12,450.53 | 6,721.25 |
| 4 | 82,211.14 | 19,171.78 | 11,509.96 | 7,661.82 |
| 5 | 74,549.32 | 19,171.78 | 10,436.90 | 9,734.88 |
| 6 | 65,814.44 | 19,171.78 | 9,214.02 | 9,957.76 |
| 7 | 55,856.68 | 19,171.78 | 7,819.93 | 11,351.83 |
| 8 | 44,504.83 | 19,171.78 | 6,230.68 | 12,941.10 |
| 9 | 31,563.73 | 19,171.78 | 4,418.92 | 14,752.83 |
| 10 | 16,810.87 | 19,163.39 | 2,353.52 | 16,810.82 |
 91,710.41 91,710.41 |  100,000.00 100,000.00 |
Table 4 shows the schedule of amortization of loan with 14% interest annually and 2 years grace period.

| Year | Balance of Loan Beginning | Amortization | Interest (14%) | Payment of Principal |
| 1 |  100,000.00 100,000.00 |  - - |  14,000.00 14,000.00 |  - - |
| 2 | 100,000.00 | 21,556.37 | 14,000.00 | - |
| 3 | 100,000.00 | 21,556.37 | 14,000.00 | 7,556.37 |
| 4 | 92,443.63 | 21,556.37 | 12,942.11 | 8,614.26 |
| 5 | 83,829.37 | 21,556.37 | 11,736.11 | 9,820.26 |
| 6 | 74,009.11 | 21,556.37 | 10,361.27 | 11,195.10 |
| 7 | 62,814.01 | 21,556.37 | 8,793.96 | 12,762.41 |
| 8 | 50,051.60 | 21,556.37 | 7,007.22 | 14,549.15 |
| 9 | 35,502.45 | 21,556.37 | 4,970.34 | 16,586.03 |
| 10 | 18,916.42 | 21,564.72 | 2,648.30 | 18,916.42 |
 100,459 31 100,459 31 |  100,000.00 100,000.00 |
Notice that in these series of examples, the amount of yearly amortization is bigger when there is a grace period compared to repayments without grace periods. The total amount of interest likewise becomes bigger when repayments have grace periods.
Cash flow is defined as the amount of money expended, balance against the income, in cash, generated by a project or business over a period of time.
It is axiomatic that in any project, an initial capital outlay is necessary, with returns accruing to the investors over a period of time. The amount of capital outlay required as well as the rate of returns, can be very accurately predicted if sufficient data on costs and benefits are gathered and used. However, an excess of benefit over costs does not indicate that the project is the best that can be designed.
A project can fail simply because the timing of costs and benefits have not been computed and considered. All available equity and credit may be exhausted early in the project before the flow of income becomes large enough to balance the outflow. Most projects require a considerable period of time before they become self-sustaining. If a project has exhausted its equity and credit at an early stage when operating expenses have still to be met, it will fail though it is potentially viable. The solution is to project a cash flow chart showing all requirements before starting the project.
If the preceding discussion the importance of cash flow has been mentioned which is necessary in the preparation of a project feasibility study.