![]()
![]()
1. Rationale
The GTOS Land Network needs to undertake a project which will demonstrate the potential of a relatively sparse network of sites to generate a reliable, useful product with global coverage and local relevance, rapidly and efficiently, by adopting a hierarchical approach and using models to combine in situ and remotely sensed data. The project is designed so that any network or site regardless of its level of sophistication can make a useful contribution to the project.
A set of output products which have Net Primary Productivity (NPP) as their common foundation would serve this purpose, and is achievable within the desired time frame by collaboration with existing initiatives. NPP, which is the amount of new plant growth which occurs within a given area over a specified time period (g m-2 y-1), is a key integrator of ecosystem function. It is the mechanistic basis of harvest yield, whether it be of edible plant products, timber or meat. Deviation of NPP from its expected value is an objective indicator of degradation, which is of direct use to the Convention on Desertification. Net Ecosystem Production (NEP) is a related variable derived from NPP which is of crucial importance in the global carbon cycle, and thus to the Framework Convention on Climate Change.
The calculation of NPP requires the collection of a set of input data which are valuable long-term observations in their own right: rainfall, temperature, soil water holding capacity and nitrogen content, land cover and Leaf Area Index (LAI). Land cover is of direct relevance to the Biodiversity Convention and Climate Change Convention; water holding capacity and nitrogen content of soils are measures of degradation, and nitrogen content correlates closely with soil carbon, of interest in the global carbon cycle.
2. Objectives
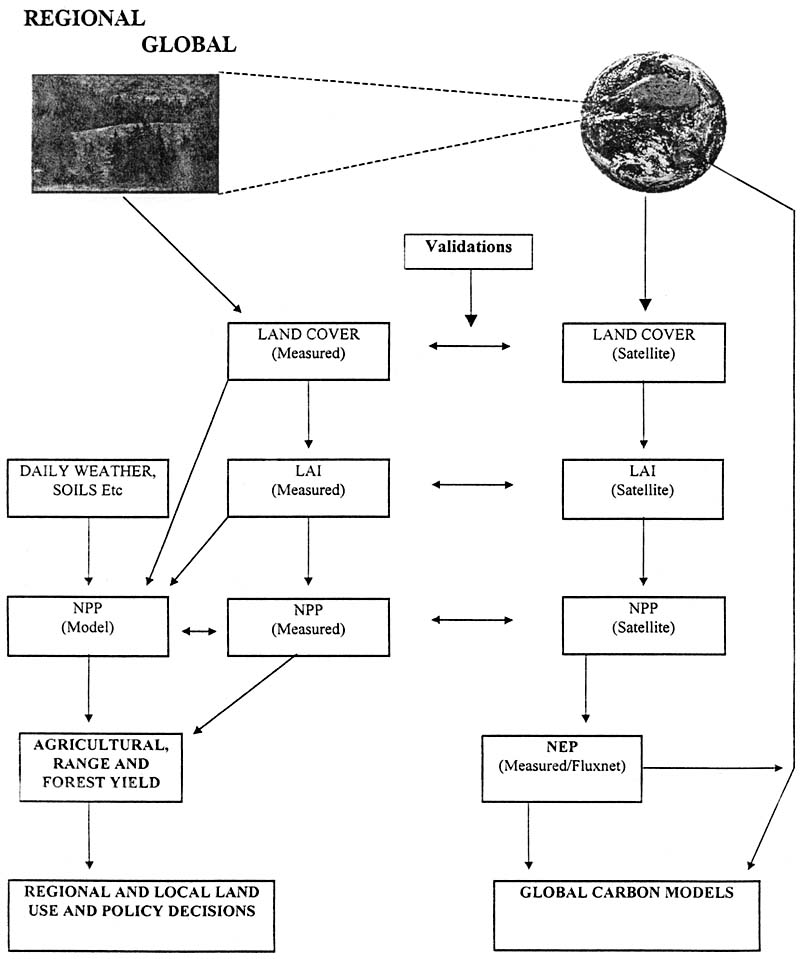
The GTOS-NPP project has two primary goals, first to distribute a global standard NPP product to regional networks for evaluation, and translation of this standard product to regionally specific crop, range and forest yield maps for land management applications. Second, this project will use the FLUXNET global network of eddy covariance flux towers to translate the EOS NPP product into NEP, or total net ecosystem CO2 flux, for use in global climate and carbon cycle models.
In this context, the GTOS-NPP project will inaugurate a globally distributed tracking of NPP and NEP critical to global change monitoring. As the network achieves global distribution, it will quantify any trends in biospheric productivity of significance, including NPP responses to desertification and land degradation trends, interannual climate variability, CO2 fertilisation, pollution effects, etc. This plan also incorporates the principles of GHOST, the global hierarchical observing strategy, in that the regional NPP drivers will be done as a Tier 4 activity, regional NPP validation a Tier 3 activity, and the FLUXNET towers function as Tier 2 intensive continuous NEP study sites. Finally, the plan offers two end products, one of high practical utility at the local level, the other of high global significance at the scientific level.
3. Procedure
Satellite measurements
The project will extract the global weekly NPP product from the US NASA Earth Observing System Data Information System for dissemination to participating GTOS-NPP networks. Specifically, EOS is computing a NPP product at 1 km for the entire global vegetated land surface every 8 days from the MODIS sensor and ancillary data. This EOS product will commence shortly after the June 1998 launch of the AM-1 satellite, probably around September 1998. The EOS NPP algorithm is based on an extensive development of logic relating time integrated absorbed PAR to NPP.
In situ measurements
Each participating site should aim to collect the following input variables. Failure to collect the full set does not render the site useless, since the data, that are available, can be used for independent validation of the default global data sets. The data must be collected to be representative of a 3 km x 3 km square. This is because the calculated NPP product will initially have a resolution of 1 km by 1 km, with a positional error of up to 1 km. Future products could have a 250 m x 250 m resolution. The stratification and sub-sampling procedure necessary to ensure this will depend on the location and homogeneity of the particular site.
Daily precipitation
Daily maximum temperature
Daily minimum temperature
Once-daily absolute humidity (i.e. dewpoint temperature, or wet and dry bulb temp)
Daily wind run
24 hour total incoming radiation
Soil Total Nitrogen 0-30 cm
Soil clay and sand content, 0-30 cm
Soil Profile Water Holding Capacity, 0-30 and 30-bottom of rooting zone[6], which consists of:
Porosity (calculated from bulk density and stone content)
Only for sites where phosphorus may be limiting, for the rooting zoneIn situ drained limit (>field capacity)
In situ wilting point (about -1.5 MPa)
Air dry water content (about 9 MPa)
Total P
Organic P
Extractable P
Only for sites where soil acidity may be limiting,
Only for sites where salinity may be limiting,pH
soil paste conductivity
Land cover, in the IGBP broad land cover classes
Seasonal maximum and minimum LAI[7], more frequently if possible.
Sites should aim to collect at least one of the following sets of output variables:
NEP + soil respiration + harvest yield (Tier 2)
Above-ground NPP + soil respiration + harvest yield (Tier 3)
Harvest yield (Tier 4)
Failure to be able to collect any of the desired information does not limit the utility of other data that are collected. Hence if a site can collect any of the desired variables it will make a useful contribution to the project.
Sites collecting NEP will do so using an eddy covariance system located in the dominant cover type. Soil respiration must be integrated for the year and cover type, which means that it must be collected at a statistically valid number of locations, at least monthly, and be accompanied by the 0-30 cm water content and temperature at the time of measurement. Above-ground NPP would be collected by a method appropriate to the biome, for instance tree wood increment plus litterfall in forests, and sequential harvesting in grasslands.
4. Products
A central GTOS-NPP project office will extract the NPP data stream every 8 days for each participating GTOS network region from the 1.5 x 10{8} global cells. Additionally, the MODIS derived land cover and 8 day LAI/FPAR will also be downloaded from the global data set for each regional network. After development, this should be an automated extraction procedure.
Harvest yield is that fraction of the NPP which is extracted for human use; for instance, the grain yield in cereal crops, timber yield in forests, or forage in range lands. The harvest algorithm is a relationship between NPP and the harvest yield. It is a function of the product type, the site water and nutrient stress, and the age of the plant. It will be determined regionally by combining data from the literature with data emerging from those sites which have both NPP (or NEP) and harvest yield.
5. Roles and responsibilities
In situ site operators
- site-integral data provision to the coordinator within 6 months of collection;
- data quality control and adherence to metadata protocols
Regional networks
- development of transfer functions to convert NPP to an issue-based indicator (e.g. yield);
- identification of capacity-building needs.
GOS-Net Secretariat
- collation of data sets for provision to modelling team within 1 month of receipt;
- coordination of proposals for technical assistance agencies for capacity building;
- collation of methods;
- provision of NPP and LAI fields to network sites in accessible form.
NPP modelling team
- calculation of global NPP fields;
- provision of NPP models to the network in site-unable form.
6. Schedule
|
Jul 1997-Sept 1998 |
Planning, methods validation, capacity building, DIS design and implementation, soil and cover data collection |
|
Oct 1998 |
Southern Hemisphere sites begin to collect data |
|
Mar 1999 |
Northern Hemisphere sites begin to collect data |
|
Dec 1999 |
First NPP surface validation |
|
Jan 2000-Mar 2000 |
Recalibration of models, generation of first pass regional issue-based data sets |
|
Dec 2000 |
Validation of second generation surfaces, second pass regional data sets. |
|
[6] Depth which includes 90% of
the roots [7] Defined as the daily integral fraction of PAR intercepted by photosynthetic tissue |
![]()
![]()