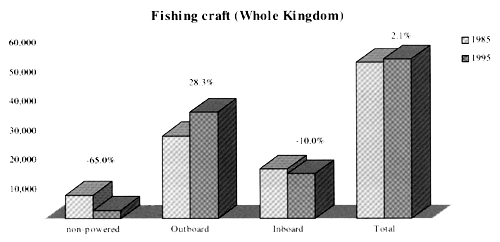
Figure 4.1 Fishing Craft by Type, 1985 and 1995
Source: Table 2.5.
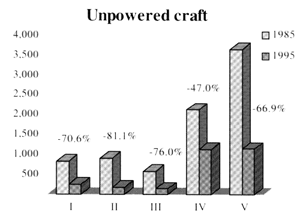 | 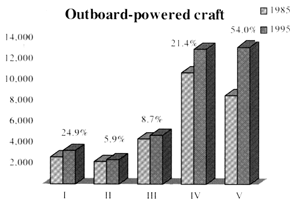 |
Figure 4.2 Unpowered and Outboard-powered Fishing Craft by Coastal Zone, 1985 and 1995
Source: Table 2.5.
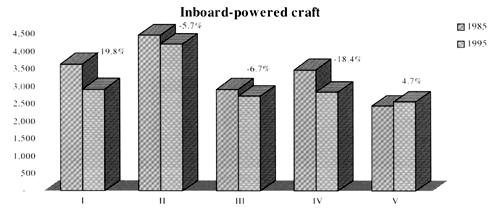
Figure 4.3 Inboard-powered Fishing Craft by Coastal Zone, 1985 and 1995
Source: Table 2.5.
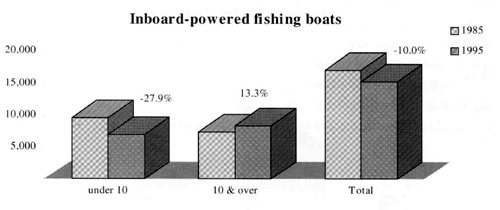
Figure 4.4 Recorded Inboard-powered Fishing Boats by Gross Tonnage, 1985 and 1995
Source: Table 4.1
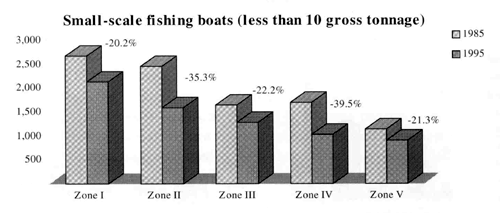
Figure 4.5 Recorded Small-scale Inboard-powered Fishing Boats by Gross Tonnage and Coastal Zone, 1985 and 1995
Source: Table 4.1
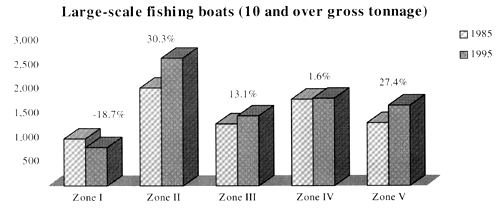
Figure 4.6 Recorded Large-scale Inboard-powered Fishing Boats by Gross Tonnage and Coastal Zone, 1985 and 1995
Source: Table 4.1
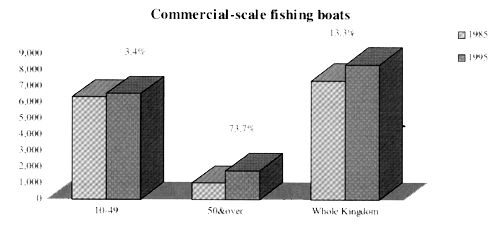
Figure 4.7 Recorded Commercial-scale Inboard-powered Fishing Boats by Gross Tonnage, 1985–1995
Source: Table 4.2
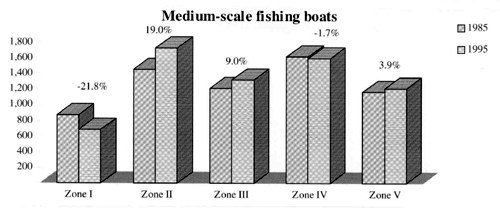
Figure 4.8 Recorded Medium-scale Inboard-powered Fishing Boats by Gross Tonnage and Coastal Zone, 1985–1995
Source: Table 4.2
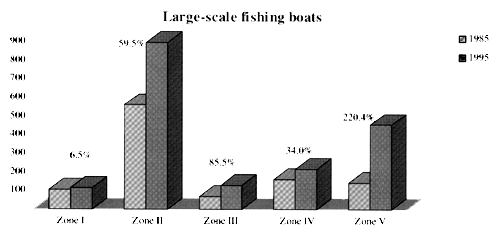
Figure 4.9 Recorded Large-scale Inboard-powered Fishing Boats by Gross Tonnage and Coastal Zone, 1985–1995
Source: Table 4.2
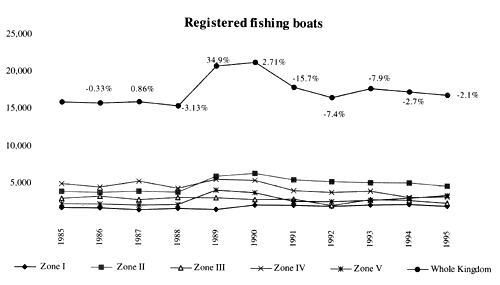
Figure 4.10 Registered Fishing Boats by Year and Coastal Zone, 1985–1995
Source: Table 4.3
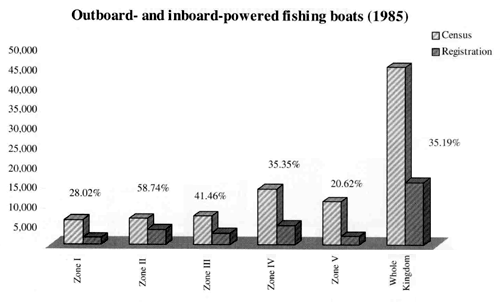
Figure 4.11 Census-recorded and Registered Outboard and Inboard-powered Fishing Boats, 1985
Source: Table 4.4
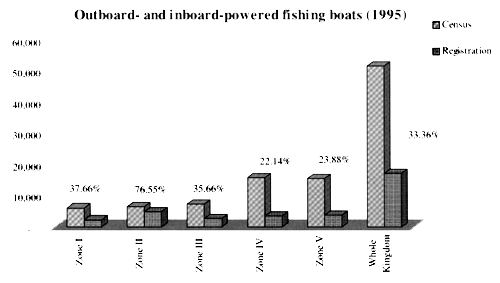
Figure 4.12 Census-recorded and Registered Outboard and Inboard-powered Fishing Boats, 1995
Source: Table 4.4
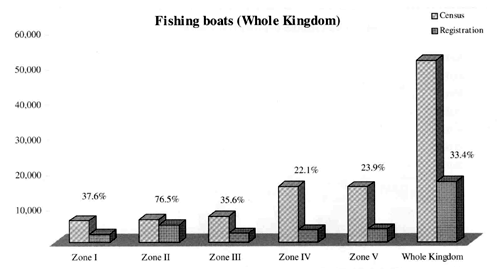
Figure 4.13 Comparison of the Number of Fishing Boats Census-recorded and Registered by Coastal Zone, 1995
Source: Table 4.5
Note: Percentages = number of registered boats as percent of censused boats.
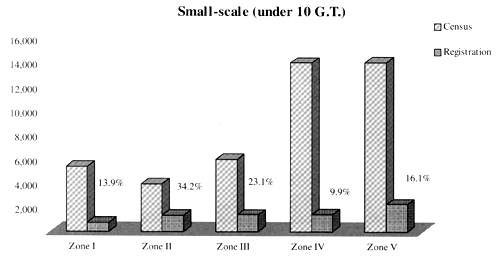
Figure 4.14 Comparison of the Number of Fishing Boats Under 10 GT Census-recorded and Registered by Coastal Zone, 1995
Source: Table 4.5
Note: Percentages=number of registered boats as percent of censused boats.
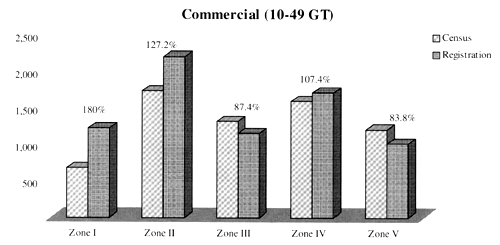
Figure 4.15 Comparison of the Number of Fishing Boats of 10–49 GT Census-recorded and Registered by Coastal Zone, 1995
Source: Table 4.5
Note: Percentages=number of registered boats as percent of censused boats.
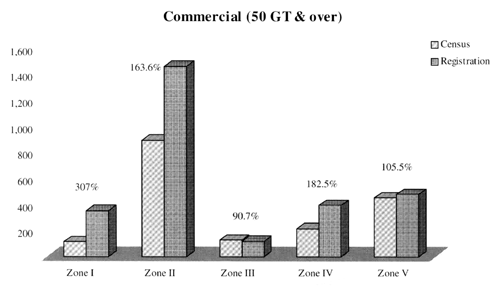
Figure 4.16 Comparison of the Number of Fishing Boats of 50 GT and over Census-recorded and Registered by Coastal Zone, 1995
Source: Table 4.5
Note: Percentages=number of registered boats as percent of censused boats.
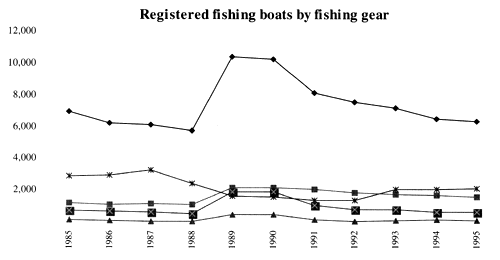
Figure 4.17 Number of Registered Fishing Boats by Type of Fishing Method, 1985–1995
Source: Table 4.6
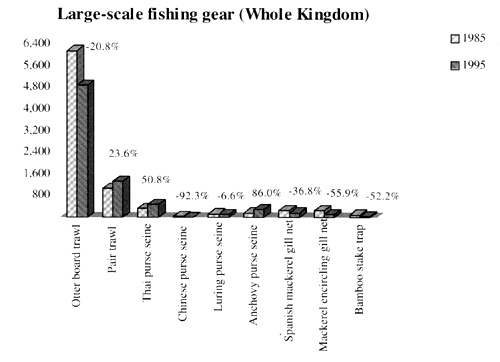
Source: Table 4.7
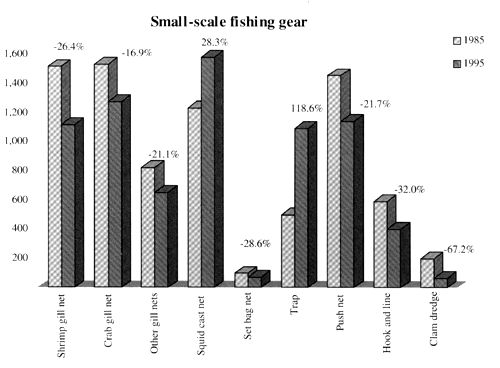
Figure 4.18 Inboard Powered Fishing Boats Using Large-scale and Small-scale Fishing Gears for the Whole Kingdom, 1985 and 1995
Source: Table 4.8
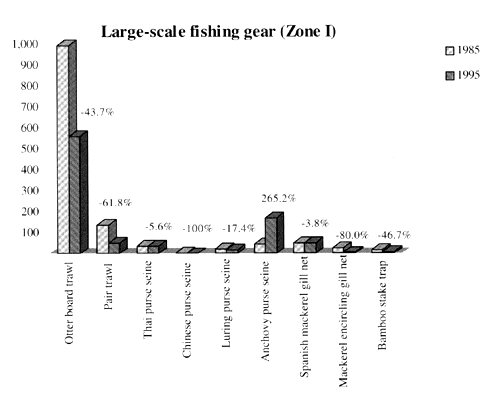
Source: Table 4.7
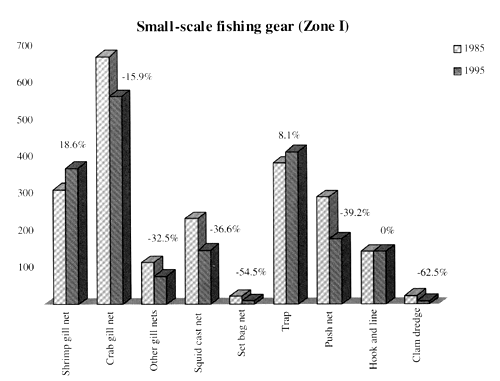
Figure 4.18.1 Inboard Powered Fishing Boats Using Large-scale and Small-scale Fishing Gears for Zone I,1985 and 1995
Source: Table 4.8
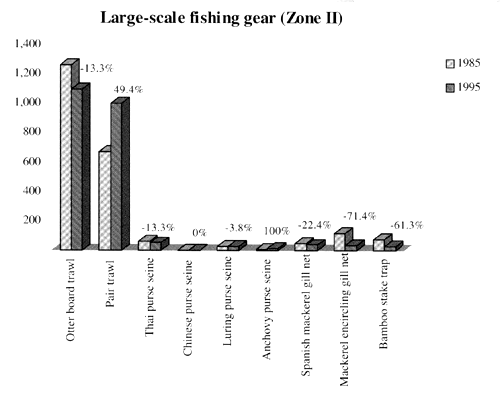
Source: Table 4.7
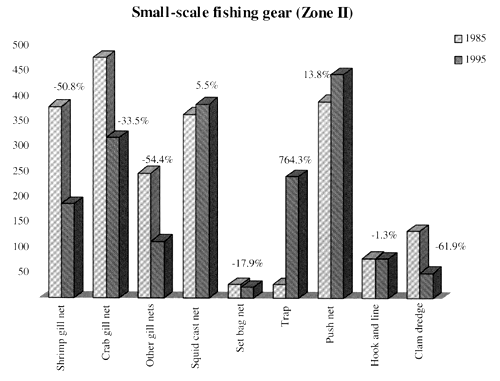
Figure 4.18.2 Inboard Powered Fishing Boats Using Large-scale and Small-scale Fishing Gears for Zone II,1985 and 1995
Source: Table 4.8
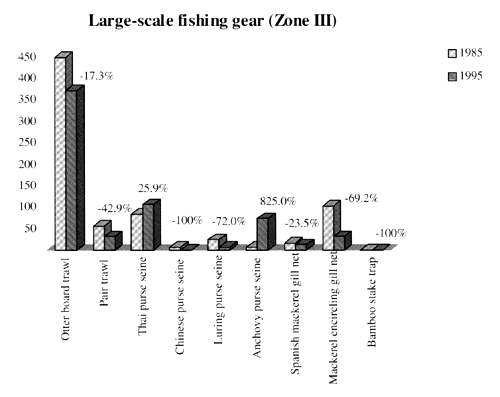
Source: Table 4.7
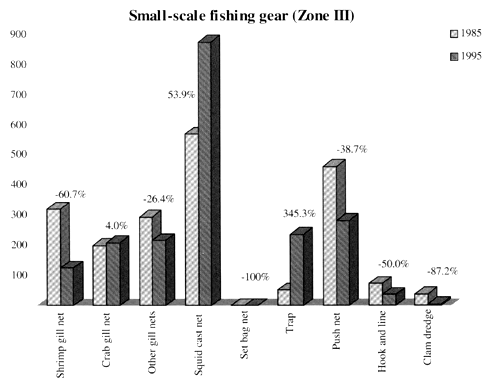
Figure 4.18.3 Inboard Powered Fishing Boats Using Large-scale and Small-scale Fishing Gears for Zone III,1985 and 1995
Source: Table 4.8
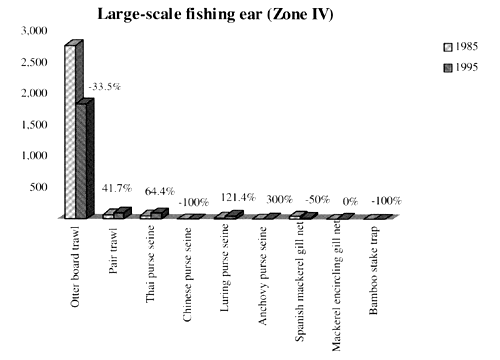
Source: Table 4.7
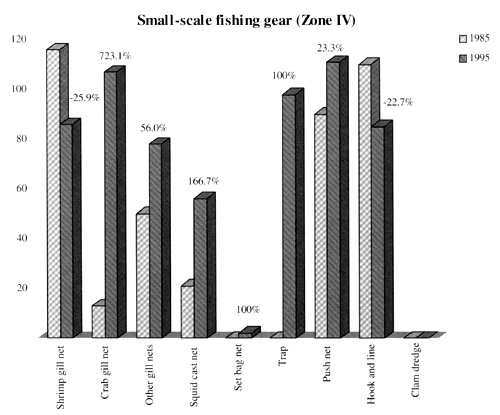
Figure 4.18.4 Inboard Powered Fishing Boats Using Large-scale and Small-scale Fishing Gears for Zone IV,1985 and 1995
Source: Table 4.8
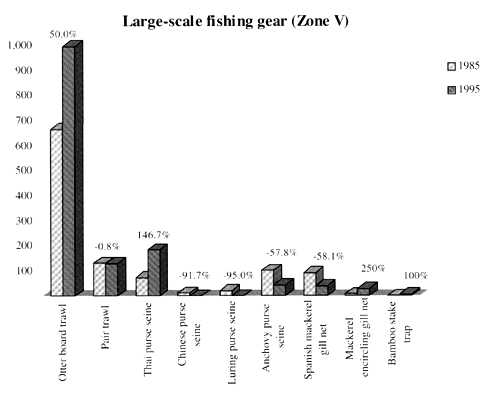
Source: Table 4.7
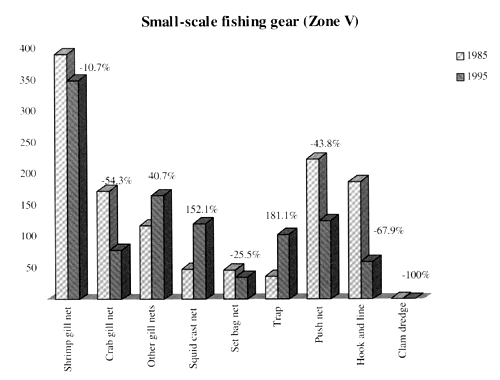
Figure 4.18.5 Inboard Powered Fishing Boats Using Large-scale and Small-scale Fishing Gears for Zone V,1985 and 1995
Source: Table 4.8
Table 4.1 Census-recorded inboard-powered fishing boats by gross tonnage and coastal zone, 1985 and 1995
| Region | Inboard-powered Fishing Boats (1985) | Inbpard-powered Fishing Boats (1995) | ||||||||||
|---|---|---|---|---|---|---|---|---|---|---|---|---|
| <10 G.T. | % | 10&over G.T. | % | Total | % | <10 G.T. | % | 10&over G.T. | % | Total | % | |
| Coastal Zone I | 2,674 | 73.2 | 978 | 26.8 | 3,652 | 100.0 | 2,134 | 72.9 | 795 | 27.1 | 2,929 | 100.0 |
| Coastal Zone II | 2,451 | 54.8 | 2,021 | 45.2 | 4,472 | 100.0 | 1,586 | 37.6 | 2,633 | 62.4 | 4,219 | 100.0 |
| Coastal Zone III | 1,646 | 56.3 | 1,280 | 43.7 | 2,926 | 100.0 | 1,281 | 46.9 | 1,448 | 53.1 | 2,729 | 100.0 |
| Coastal Zone IV | 1,696 | 48.7 | 1,787 | 51.3 | 3,483 | 100.0 | 1,026 | 36.1 | 1,815 | 63.9 | 2,841 | 100.0 |
| Coastal Zone V | 1,141 | 46.6 | 1,308 | 53.4 | 2,449 | 100.0 | 898 | 35.0 | 1,666 | 65.0 | 2,564 | 100.0 |
| Whole Kingdom | 9,608 | 56.6 | 7,374 | 43.4 | 16,982 | 100.0 | 6,925 | 45.3 | 8,357 | 54.7 | 15,282 | 100.0 |
Source: Table 2.7 in Chapter 2 of this report
Note: Small-scale=under 10 gross tonnage; commercial large-scale=10 and over gross tonnage
Table 4.2 Census-recorded commercial-scale inboard-powered fishing boats by gross tonnage and coastal zone, 1985 and 1995
| Region | Commercial-scale Inboard-powered Fishing Boats (1985) | Commercial-scale Inboard-powered Fishing Boats (1995) | % Change | ||||||||||||
|---|---|---|---|---|---|---|---|---|---|---|---|---|---|---|---|
| 10–49 G.T. | % | 50 & over G.T. | % | Total | % | 10–49 G.T. | % | 50 & over G.T. | % | Total | % | 10–49 G.T. | 50 & over G.T. | Total | |
| Coastal Zone I | 870 | 89.0 | 108 | 11.0 | 978 | 100.0 | 680 | 85.5 | 115 | 14.5 | 795 | 100.0 | -21.8 | 6.5 | -18.7 |
| Coastal Zone II | 1,460 | 72.2 | 561 | 27.8 | 2,021 | 100.0 | 1,738 | 66.0 | 895 | 34.0 | 2,633 | 100.0 | 19.0 | 59.5 | 30.3 |
| Coastal Zone III | 1,211 | 94.6 | 69 | 5.4 | 1,280 | 100.0 | 1,320 | 91.2 | 128 | 8.8 | 1,448 | 100.0 | 9.0 | 85.5 | 13.1 |
| Coastal Zone IV | 1,625 | 90.9 | 162 | 9.1 | 1,787 | 100.0 | 1,598 | 88.0 | 217 | 12.0 | 1,815 | 100.0 | -1.7 | 34.0 | 1.6 |
| Coastal Zone V | 1,166 | 89.1 | 142 | 10.9 | 1,308 | 100.0 | 1,211 | 72.7 | 455 | 27.3 | 1,666 | 100.0 | 3.9 | 220.4 | 27.4 |
| Whole Kingdom | 6,332 | 85.9 | 1,042 | 14.1 | 7,374 | 100.0 | 6,547 | 78.3 | 1,810 | 21.7 | 8,357 | 100.0 | 3.4 | 73.7 | 13.3 |
Source: Table 2.7 in Chapter 2 of this report
Note: Medium-scale = 10–49 gross tonnage; commercial large-scale = 50 and over gross tonnage
Table 4.3 Number of registered fishing boats by year and coastal zone, 1985–1995
| Zone | 1985 | 1986 | 1987 | 1988 | 1989 | 1990 | 1991 | 1992 | 1993 | 1994 | 1995 | % Increase 1985–1995 |
|---|---|---|---|---|---|---|---|---|---|---|---|---|
| Coastal Zone I | 1,753 | 1,744 | 1,554 | 1,736 | 1,610 | 2,327 | 2,253 | 2,142 | 2,354 | 2,517 | 2,328 | 32.8 |
| Coastal Zone II | 3,920 | 3,874 | 4,050 | 3,918 | 6,159 | 6,573 | 5,704 | 5,495 | 5,345 | 5,353 | 5,014 | 27.9 |
| Coastal Zone III | 3,008 | 3,362 | 2,898 | 3,172 | 3,229 | 3,007 | 3,086 | 2,281 | 3,061 | 2,981 | 2,651 | -11.9 |
| Coastal Zone IV | 5,010 | 4,601 | 5,366 | 4,424 | 5,696 | 5,628 | 4,264 | 4,052 | 4,277 | 3,449 | 3,502 | -30.1 |
| Coastal Zone V | 2,267 | 2,288 | 2,178 | 2,285 | 4,270 | 3,966 | 2,847 | 2,831 | 3,005 | 3,290 | 3,755 | 65.6 |
| Other Provinces | 10 | 47 | 7 | 15 | 15 | 46 | 16 | 19 | 104 | 67 | 31 | 210.0 |
| Whole Kingdom | 15,968 | 15,916 | 16,053 | 15,550 | 20,979 | 21,547 | 18,170 | 16,820 | 18,146 | 17,657 | 17,281 | 8.2 |
| Annual Increase (%) | - | -0.33 | 0.86 | -3.13 | 34.91 | 2.71 | -15.67 | -7.43 | 7.88 | -2.69 | -2.13 |
Sources: 1) Thai Fishing Vessels Statistics 1989, p.1
2) Thai Fishing Vessels Statistics 1992, p.1
3) Thai Fishing Vessels Statistics 1995, p.1
Table 4.4 Comparison of outboard-powered and inboard-powered fishing boats in the census and in the registration, 1985 and 1995
| Zone | Outboard and Inboard Fishing Boats | |||||
| 1985 | 1995 | |||||
| Census Boats | Registered Boats | Registered Boats as % of Censused Boats | Census Boats | Registered Boats | Registered Boats as % of Censused Boats | |
| Coastal Zone I | 6,256 | 1,753 | 28.02 | 6,182 | 2,328 | 37.66 |
| Coastal Zone II | 6,673 | 3,920 | 58.74 | 6,550 | 5,014 | 76.55 |
| Coastal Zone III | 7,255 | 3,008 | 41.46 | 7,435 | 2,651 | 35.66 |
| Coastal Zone IV | 14,171 | 5,010 | 35.35 | 15,819 | 3,502 | 22.14 |
| Coastal Zone V | 10,995 | 2,267 | 20.62 | 15,726 | 3,755 | 23.88 |
| Whole Kingdom | 45,350 | 15,958 | 35.19 | 51,712 | 17,250 | 33.36 |
Source: Tables 2.5 and 4.3
Note: The total registered boats did not include the 10 & 31 boats registered in 1985 and 1995 in other provinces outside the five Coastal Zones
Table 4.5 Comparison of the number of fishing boats census-recorded and registered by gross tonnage and coastal zone, 1995
| Region | Fishing Boats in the 1995 Census | Fishing Boats in the 1995 Registration Statistics | Registered boats as % of Censused Boats | |||||||||
|---|---|---|---|---|---|---|---|---|---|---|---|---|
| Small-scale | Commercial | Total | Small-scale | Commercial | Total | Small-scale | Commercial | Total | ||||
| <10 G.T. | 10–49 G.T. | 50 & over G.T. | <10 G.T. | 10–49 G.T. | 50 & over G.T. | <10 G.T. | 10–49 G.T. | 50 & over G.T. | ||||
| Coastal Zone I | 5,387 | 680 | 115 | 6,182 | 751 | 1,224 | 353 | 2,328 | 13.94 | 180.00 | 306.96 | 37.66 |
| Coastal Zone II | 3,917 | 1,738 | 895 | 6,550 | 1,340 | 2,210 | 1,464 | 5,014 | 34.21 | 127.16 | 163.58 | 76.55 |
| Coastal Zone III | 5,987 | 1,320 | 128 | 7,435 | 1,381 | 1,154 | 116 | 2,651 | 23.07 | 87.42 | 90.63 | 35.66 |
| Coastal Zone IV | 14,004 | 1,598 | 217 | 15,819 | 1,390 | 1,716 | 396 | 3,502 | 9.93 | 107.38 | 182.49 | 22.14 |
| Coastal Zone V | 14,060 | 1,211 | 455 | 15,726 | 2,260 | 1,015 | 480 | 3,755 | 16.07 | 83.82 | 105.49 | 23.88 |
| Whole Kingdom | 43,355 | 6,547 | 1,810 | 51,712 | 7,122 | 7,319 | 2,809 | 17,250 | 16.43 | 111.79 | 155.19 | 33.36 |
Sources: 1) For 1995 Census: 1995 Marine Fishery Census, Whole Country, p. 154–155
2) For 1995 Registration: Thai Fishing Vessels Statistics 1995, p.5
Notes: 1) The comparison cannot be made by size for 1985 as the registered boats were not classified by gross tonnage
2) Those 31 boats registered in “Other Provinces” outside the coastal zones were excluded, reducing the total from 17,281 to 17,250
3) In the 1995 Census, “small-scale” includes unpowered, outboard-powered, and inboard-powered boats of less than 10 tonnage, while the “small-scale” registered boats do not included non-powered boats
Table 4.6 Registered fishing boats by type of fishing method, 1985–1995
| Types of fishing method | 1985 | 1986 | 1987 | 1988 | 1989 | 1990 | 1991 | 1992 | 1993 | 1994 | 1995 | % Increase 1985–1995 |
|---|---|---|---|---|---|---|---|---|---|---|---|---|
| Otter board trawl | 6,968 | 6,226 | 6,129 | 5,766 | 10,438 | 10,256 | 8,117 | 7,538 | 7,213 | 6,482 | 6,321 | -9.3 |
| Pair trawl | 1,218 | 1,084 | 1,164 | 1,132 | 2,193 | 2,193 | 2,037 | 1,876 | 1,750 | 1,708 | 1,576 | 29.4 |
| Beam trawl | 139 | 97 | 50 | 52 | 482 | 456 | 144 | 51 | 123 | 156 | 98 | -29.5 |
| Push net | 759 | 664 | 624 | 531 | 1,907 | 1,879 | 1,047 | 818 | 808 | 651 | 634 | -16.5 |
| Purse seine | 819 | 836 | 1,043 | 1,241 | 1,079 | 1,250 | 1,243 | 1,128 | 1,173 | 1,163 | 1,022 | 24.8 |
| Chinese purse seine | 17 | 17 | 14 | 16 | 16 | 12 | 24 | - | - | - | - | -100.0 |
| Anchovy purse seine | 197 | 143 | 117 | 199 | 348 | 367 | 347 | 324 | 336 | 348 | 375 | 90.4 |
| King mackerel drift gill net | 269 | 329 | 365 | 461 | 282 | 299 | 338 | 362 | 271 | 280 | 330 | 22.7 |
| Pomfret gill net | 18 | 9 | 17 | 34 | 20 | 33 | 59 | 82 | 134 | 91 | 100 | 455.6 |
| Mackerel encircling gill net | 227 | 203 | 223 | 146 | 114 | 101 | 88 | 72 | 94 | 99 | 82 | -63.9 |
| Mackerel gill net | 179 | 153 | 181 | 156 | 24 | 143 | 107 | 137 | 257 | 328 | 279 | 55.9 |
| Crab gill net | 697 | 1,334 | 985 | 1,008 | 520 | 937 | 1,259 | 817 | 1,131 | 1,371 | 1,564 | 124.4 |
| Sadinellas gill net | 31 | 13 | 22 | 16 | 44 | 44 | 34 | 42 | 21 | 42 | 15 | -51.6 |
| Mullet gill net | 25 | 23 | 16 | 31 | 45 | 40 | 34 | 8 | 45 | 25 | 15 | -40.0 |
| Threadfin gill net | 15 | 24 | 6 | 18 | 5 | 3 | 8 | 24 | 12 | 34 | 52 | 246.7 |
| Shrimp gill net | 2,910 | 2,974 | 3,294 | 2,438 | 1,629 | 1,583 | 1,367 | 1,369 | 2,084 | 2,045 | 2,117 | -27.3 |
| Other gill nets | 401 | 795 | 606 | 770 | 540 | 620 | 474 | 466 | 710 | 665 | 674 | 68.1 |
| Other nets | 362 | 287 | 351 | 222 | 187 | 195 | 33 | 47 | 30 | 74 | 80 | -77.9 |
| Long line | 63 | 51 | 53 | 142 | 50 | 48 | 47 | 68 | 59 | 36 | 53 | -15.9 |
| Squid cast net | 663 | 654 | 794 | 1,171 | 1,056 | 1,088 | 1,363 | 1,591 | 1,895 | 2,059 | 1,894 | 185.7 |
| Total | 15,977 | 15,916 | 16,054 | 15,550 | 20,979 | 21,547 | 18,170 | 16,820 | 18,146 | 17,657 | 17,281 | 8.2 |
Sources: 1) Thai Fishing Vessels Statistics 1989, p.2
2) Thai Fishing Vessels Statistics 1992, p.2
3) Thai Fishing Vessels Statistics 1995, p.2
Table 4.7 Inboard-powered craft by large-scale fishing gear and coastal zone, 1985 and 1995
| Types of Fishing Method | 1985 | 1995 | % Change | |||||||||||||||
|---|---|---|---|---|---|---|---|---|---|---|---|---|---|---|---|---|---|---|
| Coastal Zone | Coastal Zone | |||||||||||||||||
| I | II | III | IV | V | Total | I | II | III | IV | V | Total | I | II | III | IV | V | Total | |
| Otter board trawl | 998 | 1,264 | 450 | 2,784 | 666 | 6,162 | 562 | 1,096 | 372 | 1,851 | 999 | 4,880 | -43.7 | -13.3 | -17.3 | -33.5 | 50.0 | -20.8 |
| Pair trawl | 136 | 670 | 56 | 72 | 132 | 1,066 | 52 | 1,001 | 32 | 102 | 131 | 1,318 | -61.8 | 49.4 | -42.9 | 41.7 | -0.8 | 23.6 |
| Thai purse seine | 36 | 60 | 85 | 59 | 75 | 315 | 34 | 52 | 107 | 97 | 185 | 475 | -5.6 | -13.3 | 25.9 | 64.4 | 146.7 | 50.8 |
| Chinese purse seine | 4 | 1 | 8 | 1 | 12 | 26 | - | 1 | - | - | 1 | 2 | -100.0 | 0.0 | -100.0 | -100.0 | -91.7 | -92.3 |
| Luring purse seine | 23 | 26 | 25 | 28 | 20 | 122 | 19 | 25 | 7 | 62 | 1 | 114 | -17.4 | -3.8 | -72.0 | 121.4 | -95.0 | -6.6 |
| Anchocy purse seine | 46 | 6 | 8 | 2 | 102 | 164 | 168 | 12 | 74 | 8 | 43 | 305 | 265.2 | 100.0 | 825.0 | 300.0 | -57.8 | 86.0 |
| Spanish mackerel gill net | 52 | 49 | 17 | 50 | 93 | 261 | 50 | 38 | 13 | 25 | 39 | 165 | -3.8 | -22.4 | -23.5 | -50.0 | -58.1 | -36.8 |
| Mackerel encircling gill net | 25 | 119 | 104 | - | 8 | 256 | 5 | 34 | 32 | 14 | 28 | 113 | -80.0 | -71.4 | -69.2 | 250.0 | -55.9 | |
| Bamboo stake trap | 15 | 75 | 1 | 1 | - | 92 | 8 | 29 | - | - | 7 | 44 | -46.7 | -61.3 | -100.0 | -100.0 | -52.2 | |
| Mackerel purse seine | - | - | - | - | - | - | 14 | 37 | 31 | 13 | 47 | 142 | ||||||
| Anchocy stick held box net | - | - | - | - | - | - | 50 | 4 | 61 | 2 | 5 | 122 | ||||||
| Whole Kingdom | 1,335 | 2,270 | 754 | 2,997 | 1,108 | 8,464 | 898 | 2,288 | 637 | 2,159 | 1,434 | 7,416 | -32.7 | 0.8 | -15.5 | -28.0 | 29.4 | -12.4 |
Sources: 1) 1985 Marine Fishery Census of Thailand, p. 204–207
2) 1995 Marine Fishery Census, Whole Kingdom, p. 166–167
Notes: 1) The classification by SEAFDEC (1976) of small and large-scale fisheries is based on types of fishing gear. The first nine types of gear in this table are listed under large-scale fishery
2) The outboard-powered and unpowered boats were not cross-tabulated with fishing gear in the 1985 census