![]()
![]()
![]()
The results of both surveys are not aggregated because responses are sometimes not directly comparable, and in the case of the Sesotho questionnaires, some questions were misunderstood or not answered.
Of the 92 interviews conducted 79 (86%) of the respondents were female and 13 (14%) were male.
The results obtained on household size and composition for both areas indicate that the sample was biased in favour of larger households compared to the average household size and composition of the lowland areas (Area 1) and other urban areas (Area 2) estimated in the 1986/87 Household Budget Survey.
Table 2: Household Size and Composition
| SAMPLE SOCIO-ECONOMIC SURVEY | HOUSEHOLD BUDGET SURVEY 1986/87 | |||
|---|---|---|---|---|
| Area 1 | Area 2 | Rural Lowland | Urban Other | |
| Household Size: Average no. of person | 6.5 | 7 | 5.27 | 4.48 |
| Household Size by No. of Members (%) | ||||
| 1–2 members | 10.5 | 9.6 | 16.8 | 22.9 |
| 3–4 members | 7.5 | 11.5 | 25.4 | 23.3 |
| 5–6 members | 32.5 | 19.2 | 27.3 | 24.4 |
| 7–8 members | 27.5 | 34.6 | 18.1 | 15.6 |
| 9 members | 22.5 | 25.0 | 11.4 | 12.2 |
| Information missing | 0.3 | 2.4 | ||
| TOTAL | 100.0 | 100.0 | 100.0 | 100.0 |
Household composition by household head reflects the similar trend found elsewhere in Lesotho. Figure 1 below illustrates the aggregated results of the survey.
Figure 1: Household Composition by Type of Household Head
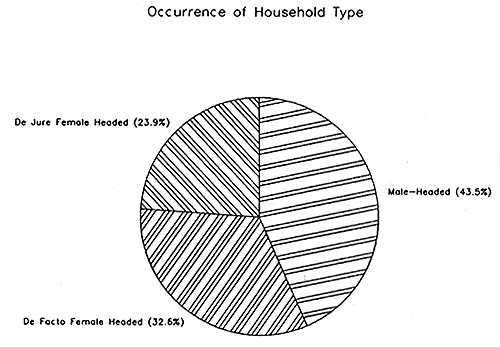
The results show that 76% of households are headed by males but that over 40% of these households (or 33% of total surveyed households) are de facto female headed because the male heads are migrant workers. The remaining 24% of the total number of households are primarily households of elderly widows. Other studies have also showed similar proportions.1 A breakdown of household heads by the two areas surveyed show, however, a higher proportion of male headed households in Ramapepe/Thaba Patsoa and a lower number of de facto female headed households in the Roma Valley.
| Male-headed | De Facto Female-headed | De Jure Female-Headed | |
|---|---|---|---|
| Area 1 | 55% | 22% | 23 % |
| Area 2 | 35% | 40% | 25 % |
| All Areas | 43% | 33% | 24 % |
1 see Gay,J.S. Women and development in Lesotho, USAID, Maseru, 1982
The main and secondary/subsistence economic activities of all households surveyed is consistent with households in the rural lowlands of Lesotho and as expected show marked differences based on the type of household head. Figure 2 below summarises these results:
Figure 2: Main Economic Activities by Type of Household Head
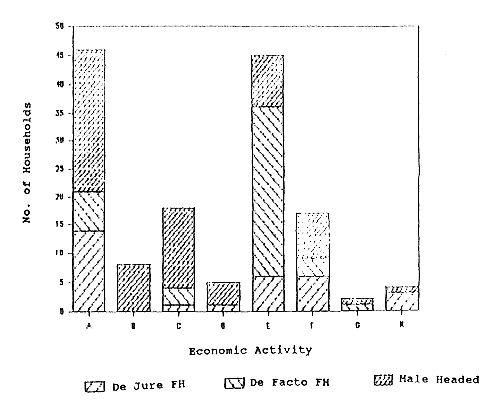
A = Crop Production
B = Vegetable & Fruit Production
C = Livestock
D = Handicrafts
E = Wages, RSA
F = Wages, Lesotho
G = Joala Brewing
H = Other
In de facto female headed households, the main source of income comes from remittances from migrant worker husbands. However, the household also undertakes a variety of economic activities mainly vegetable and fruit production to supplement this income. In male headed households, the main source of income comes from crop production and livestock. Poultry-keeping, sewing and knitting and joala (beer) brewing are the main secondary economic activities. In de jure female headed households, main and secondary sources of income are similar to that of male headed households.
Non-farm employment is also important to rural households as much of the income generated in the informal sector sustains the very poor, including small female-headed households with limited or no agricultural assets and no migrant workers.
The main uses of the reservoirs/dams for both areas is shown in Table 3.
Table 3: Uses of the Reservoirs/Dams by Number of Households
| Uses | Area 1 | Area 2 | All Areas | |||
|---|---|---|---|---|---|---|
| Livestock Drinking | 11 | ( 20%) | 28 | ( 48%) | 39 | ( 34%) |
| Domestic Water | 3 | ( 5%) | 1 | ( 2%) | 4 | ( 4%) |
| Clothes Washing | 17 | ( 30%) | 5 | ( 9%) | 22 | ( 19%) |
| Fishing | 8 | ( 14%) | 4 | ( 7%) | 12 | ( 10%) |
| None | 17 | ( 30%) | 20 | ( 34%) | 37 | ( 32%) |
| Total No. of Responses | 56 | (100%) | 58 | (100%) | 114 | (100%) |
40 % of all households claim not to use the reservoirs at all. Households that use the dams may use them for one or two reasons, the most common combination is livestock drinking and clothes washing. The dams/reservoirs are rarely used for fishing.
The main reason the reservoirs are not used as a source of domestic water or for clothes washing, is that there are water sources nearer and therefore more convenient. It is only in times of drought that the dams have been used by these households.
Only 17 households claim to have members who catch fish: 21% in Area 1 and 15% in Area 2. Four households catch fish in rivers only. Fish is caught primarily for household consumption. Most use hook and line, although one household uses this method and sometimes a small spear. Households responses on the fishing gear they use is given in Table 4.
Table 4: Type of Fishing Gear Used by Number of Households
| Fishing Gear | Area 1 | Area 2 | All |
|---|---|---|---|
| Hook and Line | 3 | 8 | 11 |
| When reservoir overflows | 2 | 0 | 2 |
| Netted vegetable bags sewn together/wire netting | 3 | 0 | 3 |
| Spear (Tsenene) | 0 | 1 | 1 |
| No. response | 1 | 1 | 2 |
| Total Number of Responses | 9 | 10 | 19 |
Eleven (65%) households fish very occasionally, with 3 claiming to fish once a week including migrant workers only when they are at home. Only one household claims to fish more than once a week. The infrequency of fishing activity by fishing households indicates that fishing is considered a minor economic activity, possibly because the current returns per hour spent fishing are very low.
All those who catch fish are male, falling into two main categories, herdboys or adult males. It is likely that the adult males once fished when they were herdboys. One household in area 2 reported that it used to hire men to fish with hook and line, but has since abandoned fishing. Eleven fishermen come from maleheaded households, two from de jure female-headed households (both of whom are sons of the household head working in salaried employment), and three from de facto female headed households.
All households were asked about any other people seen fishing and the results of the responses are given in Table 5:
Table 5: Other People not in the Household who Catch Fish
| Area 1 | Area 2 | All | ||||
|---|---|---|---|---|---|---|
| Other people in the village | 18 | ( 44%) | 27 | ( 41%) | 45 | ( 43%) |
| People from neighbouring villages | 10 | ( 24%) | 10 | ( 16%) | 20 | ( 19%) |
| Herdboys | 1 | ( 3%) | 3 | ( 5%) | 4 | ( 4%) |
| School children | 0 | 1 | ( 1.5%) | 1 | ( 1%) | |
| People from town | 0 | 1 | ( 1.5%) | 1 | ( 1%) | |
| No response/none | 12 | ( 29%) | 22 | ( 35%) | 34 | ( 32%) |
| Total No. of Responses | 41 | (100%) | 64 | (100%) | 105 | (100%) |
Seventy-five households (82%) say they eat fresh fish, and have done so for a long time and 17 households ( 18%) say they do not eat fresh fish, of which 2 are in Area 1 and 15 in Area 2. The main reason given by households as to why they do not eat fish is that they do not know how to catch it. The second reason given is that they simply do not like eating fish (Table 6). There appear to be no common socio-economic characteristics of members that do not eat fresh fish.
Table 6: Reasons for Not Eating Fresh Fish by Household Response
| Area 1 | Area 2 | All | ||||
|---|---|---|---|---|---|---|
| Do not know how to catch | 6 | ( 75%) | 6 | ( 30%) | 12 | ( 43%) |
| Not available to buy | 0 | 2 | ( 10%) | 2 | ( 7%) | |
| Too expensive | 1 | (12.5%) | 1 | ( 5%) | 2 | ( 7%) |
| Do not like taste | 0 | 3 | ( 15%) | 3 | ( 11%) | |
| Do not like smell | 0 | 2 | ( 10%) | 2 | ( 7%) | |
| Do not like | 0 | 4 | ( 20%) | 4 | ( 14%) | |
| Do not like bones | 1 | (12.5%) | 2 | ( 10%) | 3 | ( 11%) |
| Total No. of Responses | 8 | (100%) | 20 | (100%) | 28 | (100%) |
For fish-eating households, questions on the frequency of their fish consumption (Table 7) indicate that approximately 50% of all households eat fresh fish only very rarely. However, no question was asked on the last time fresh fish was eaten.
Table 7: Frequency of Fresh Fish Consumption
| Area 1 | Area 2 | All | ||||
|---|---|---|---|---|---|---|
| 2 – 3 times a month | 8 | ( 20%) | 5 | ( 10%) | 13 | ( 14%) |
| Once a month | 6 | ( 15%) | 6 | ( 11%) | 12 | ( 13%) |
| Very rarely | 22 | ( 55%) | 22 | ( 42%) | 44 | ( 48%) |
| Never | 2 | ( 5%) | 15 | ( 29%) | 17 | ( 18%) |
| No response | 2 | ( 5%) | 4 | ( 8%) | 6 | ( 7%) |
| No. of Households: | 40 | (100%) | 52 | (100%) | 92 | (100%) |
Who eats fresh fish?
In 76% of all fresh-fish eating households, all household members eat fresh fish, remaining households say that only one or two members do not eat fish.
Type of Fish Eaten
91% of fish-eating households were unable to name the type of fish consumed and were therefore unable to state a preference. Four households said they ate catfish and three households said they ate carp. No household indicated that they ate more than one type of fish.
The likelihood is that fish caught in the rivers is catfish whilst fish obtained or bought locally may be carp, as this species was stocked in the fish ponds in Ramapepe/Thaba Patsoa as well as some dams and fish ponds in the Roma Valley.
Most households thought they ate fresh fish most often in summer. The responses were as follows:
| Area 1 | Area 2 | All | ||||
|---|---|---|---|---|---|---|
| Spring | 7 | ( 18%) | 0 | 7 | ( 9%) | |
| Summer | 17 | ( 45%) | 20 | ( 52%) | 37 | ( 48%) |
| Autumn | 13 | ( 34%) | 6 | ( 15%) | 19 | ( 25%) |
| Winter | 0 | 4 | ( 10%) | 4 | ( 5%) | |
| No Response | 1 | ( 3%) | 9 | ( 23%) | 10 | ( 13%) |
| Total No. of Responses | 38 | (100%) | 39 | (100%) | 77 | (100%) |
The main supply of fresh fish in Area 1 is the local market, whereas in Area 2, the main supply comes from sales made by neighbours and friends. Table 8 illustrates the results from the survey:
Table 8: Sources of Fresh Fish
| Area 1 | Area 2 | All | ||||
|---|---|---|---|---|---|---|
| Household members who catch | 9 | ( 21%) | 7 | ( 16%) | 16 | ( 18%) |
| Bought from friends/neighbours | 7 | ( 16%) | 14 | ( 32%) | 21 | ( 24%) |
| Bought from town market | 2 | ( 5%) | 0 | 2 | ( 2%) | |
| Bought from local market | 13 | ( 30%) | 6 | ( 14%) | 19 | ( 22%) |
| Bought from traders | 4 | ( 9%) | 6 | ( 14%) | 10 | ( 11%) |
| Given away by friends/neighbours | 5 | ( 12%) | 9 | ( 20%) | 14 | ( 16%) |
| Bought from fishermen | 3 | ( 7%) | 0 | 3 | ( 3%) | |
| Other | 0 | 2 | ( 5%) | 2 | ( 2%) | |
| Total No. of Responses | 43 | (100%) | 44 | (100%) | 87 | (100%) |
In all fish-eating households, fresh fish has arrived at the household whole, i.e. not headed, scaled or gutted. The main methods of cooking reported by households are presented in Table 9.
Table 9: Methods of Cooking by Household Responses
| Area 1 | Area 2 | All | ||||
|---|---|---|---|---|---|---|
| Method: | ||||||
| Frying | 35 | ( 80%) | 26 | ( 76%) | 61 | ( 78%) |
| Roasting | 8 | ( 18%) | 8 | ( 24%) | 16 | ( 21%) |
| Baking | 1 | ( 2%) | 0 | 1 | ( 1%) | |
| Total No. of Responses | 44 | (100%) | 34 | (100%) | 78 | (100%) |
| Learnt from: | ||||||
| Seen from others | 14 | ( 38%) | 19 | ( 66%) | 33 | ( 50%) |
| Nutritionist | 9 | ( 25%) | 0 | 9 | ( 14%) | |
| No one | 8 | ( 22%) | 2 | ( 7%) | 10 | ( 15%) |
| Relatives | 2 | ( 5%) | 2 | ( 7%) | 4 | ( 6%) |
| School | 2 | ( 5%) | 2 | ( 7%) | 4 | ( 6%) |
| Other | 2 | ( 5%) | 4 | ( 13%) | 6 | ( 9%) |
| Total No. of Responses | 37 | (100%) | 29 | (100%) | 66 | (100%) |
Although respondents said that fish is often sun-dried first before frying in order to ‘take away the smell’, this process is not accurately reflected in the responses. The main reasons that households gave for first drying fresh fish was that they did not like the smell and/or appearance of freshly caught fish and the process is thought to soften the bones. Sun-drying of fish, often accompanied by sprinkling the fish with salt, flour and spices is also the main method used by households who have too much fish for one meal (see Table 10). It has been suggested that the origin of this process has come from herdboys, who, when looking after livestock, often kill and then dry animals/fish in order to preserve the meat.
Table 10: Utilization of Surplus Fish by Household Response
| Area 1 | Area 2 | All | ||||
|---|---|---|---|---|---|---|
| Sun-drying | 32 | ( 67%) | 9 | ( 24%) | 41 | ( 48%) |
| Sell to neighbours/friends | 3 | ( 6%) | 1 | ( 3%) | 4 | ( 5%) |
| No surplus | 4 | ( 8%) | 11 | ( 29%) | 15 | ( 17%) |
| Refrigerator | 0 | 1 | ( 3%) | 1 | ( 1%) | |
| No response | 9 | ( 19%) | 16 | ( 42%) | 25 | ( 29%) |
| Total No. of Responses | 48 | (100%) | 38 | (100%) | 86 | (100%) |
The main reasons why households do not eat more fresh fish were that they did not have access to the reservoir (33%), that fish was not available for sale (32%) and that they did not know how to catch fresh fish (31%). Some households gave more than one reason, the most common dual response being that they did not have access to the reservoir and fish was not available for sale. Although suggestions had been made before the start of the survey that people are reluctant to eat very bony fish, there was no evidence of this in the survey results.
The following reasons were given for why fresh fish is not eaten more often:
Table 11: Reasons for not eating more fresh fish by Household Response
| Area 1 | Area 2 | All | ||||
|---|---|---|---|---|---|---|
| Do not have access to reservoir | 12 | ( 27%) | 13 | ( 28%) | 25 | ( 28%) |
| Do not know how to catch fish | 6 | ( 14%) | 17 | ( 36%) | 23 | ( 25%) |
| Fishing equipment not available | 5 | ( 12%) | 0 | 5 | ( 6%) | |
| Fishing equipment too expensive | 0 | 1 | ( 2%) | 1 | ( 1%) | |
| Fish not available for sale | 18 | ( 41%) | 6 | ( 13%) | 24 | ( 26%) |
| Do not like the taste | 0 | 3 | ( 6%) | 3 | ( 3%) | |
| Too many bones | 0 | 1 | ( 2%) | 1 | ( 1%) | |
| Price | 1 | ( 2%) | 0 | 1 | ( 1%) | |
| Difficult to catch | 1 | ( 2%) | 0 | 1 | ( 1%) | |
| No response | 1 | ( 2%) | 6 | ( 13%) | 7 | ( 8%) |
| Total No. of Responses | 44 | (100%) | 47 | (100%) | 91 | (100%) |
Responses regarding access to the reservoir can be interpreted in two ways. Some respondents, particularly in Area 1, probably meant that they did not have access to the membership of the Fish Farm Associations, although the majority understood it to mean access to the reservoirs. In this respect not having access did not necessarily mean physical, but social access. The respondents felt that as females, they were not able to go to the reservoir. This was compounded by fishing equipment being unavailable and lack of fishing skills. The most common reason given by female respondents for not eating more fish was not having access to the reservoir whilst the few male respondents gave their main reason as not being able to catch fish.
Tinned fish is by far the most commonly eaten fish in both areas. 90% of all households reported eating tinned fish, 73% reported eating cooked fish (fish and chips), 32% reported eating frozen fish (although there may be some overlap in this response as cooked fish is often frozen) and 25% reported eating salted fish (snoekfish). The much higher consumption of cooked fish in Area 2 could be accounted for by the fact that fish is readily available in food shops in Roma. Tables 12–15 show the reported frequency of consumption of different types of fish. Consumption of dried and preserved fish has been omitted as their responses were few, and the availability of such products in Lesotho, limited.
Where preferences were states, cooked fish (42 households) and then tinned fish (34 households) were the most preferred types of fish, predominantly because of the taste. Only 3 households said they preferred tinned fish because it was easily available, and only 3 households preferred tinned fish because it was cheap. Taste was therefore the main reason for any preference.
Table 12: Frequency of Consumption of Tinned Fish
| Area 1 | Area 2 | All | ||||
|---|---|---|---|---|---|---|
| More than once a week | 2 | ( 6%) | 0 | 2 | ( 3%) | |
| Once a week | 2 | ( 6%) | 0 | 2 | ( 3%) | |
| 2–3 times a month | 22 | ( 62%) | 26 | ( 65%) | 48 | ( 64%) |
| Once a month | 7 | ( 20%) | 10 | ( 25%) | 17 | ( 22%) |
| Very rarely | 2 | ( 7%) | 4 | ( 10%) | 6 | ( 8%) |
| Total No. of Households: | 35 | (100%) | 40 | (100%) | 75 | (100%) |
Table 13: Frequency of Consumption of ‘Pre-cooked’ Fish
| Area 1 | Area 2 | All | ||||
|---|---|---|---|---|---|---|
| More than once a week | 0 | 1 | ( 4%) | 1 | ( 2%) | |
| Once a week | 1 | ( 5%) | 1 | ( 4%) | 1 | ( 2%) |
| 2–3 times a month | 0 | 3 | ( 13%) | 3 | ( 7%) | |
| Once a month | 1 | ( 5%) | 12 | ( 50%) | 12 | ( 27%) |
| Very rarely | 20 | ( 90%) | 7 | ( 29%) | 27 | ( 62%) |
| Total No. of Households: | 22 | (100%) | 24 | (100%) | 46 | (100%) |
Table 14: Frequency of Consumption of Frozen Fish
| Area 1 | Area 2 | All | ||||
|---|---|---|---|---|---|---|
| More than once a week | 0 | 1 | ( 8%) | 1 | ( 4%) | |
| Once a week | 0 | 0 | 0 | |||
| 2–3 times a month | 1 | ( 7%) | 1 | ( 8%) | 2 | ( 7%) |
| Once a month | 0 | 6 | ( 46%) | 6 | ( 22%) | |
| Very rarely | 13 | ( 93%) | 5 | ( 38%) | 18 | ( 67%) |
| Total No. of Households: | 14 | (100%) | 13 | (100%) | 27 | (100%) |
Table 15: Frequency of Consumption of Salted Fish
| Area 1 | Area 2 | All | ||||
|---|---|---|---|---|---|---|
| 2–3 times a month | 1 | ( 6%) | 0 | 1 | ( 4%) | |
| Once a month | 2 | ( 13%) | 0 | 2 | ( 7%) | |
| Very rarely | 13 | ( 81%) | 11 | ( 100%) | 24 | ( 89%) |
| Total No. of Households: | 16 | (100%) | 11 | (100%) | 27 | (100%) |
The survey results indicate that fish is part of weaning food; very few households reporting that particular types of fish are not given. Ten households reported that they do not give tinned fish to babies mainly because it is too oily or because of the smell. Four households reported that they only gave fresh fish to children from two years because they were worried about bones.
Table 16: Age when Children Start Eating Fish (all types)
| Area 1 | Area 2 | All | ||||
|---|---|---|---|---|---|---|
| Less than 6 months | 3 | ( 7%) | 16 | ( 31%) | 19 | ( 20%) |
| 6–12 months | 16 | ( 40%) | 22 | ( 42%) | 38 | ( 41%) |
| 1–2 years | 6 | ( 15%) | 2 | ( 4%) | 8 | ( 9%) |
| Over 2 years | 15 | ( 38%) | 4 | ( 8%) | 19 | ( 21%) |
| No response | 0 | 8 | ( 15%) | 8 | ( 9%) | |
| Total No. of Responses | 40 | (100%) | 52 | (100%) | 92 | (100%) |
51 households reported that they ate ducks, and of those, 80% reported that they ate them very rarely. The main reason why households did not eat ducks was that they were not available (46%), although for some households the appearance was unattractive or they just did not like the thought of them (39%). Most households that eat ducks, rear them themselves. A list of the stated sources of ducks is given in Table 17:
Table 17: Source of Ducks by Household Response
| Area 1 | Area 2 | All | ||||
|---|---|---|---|---|---|---|
| Rear Ducks | 6 | ( 25%) | 11 | ( 38%) | 17 | ( 32%) |
| Bought from traders | 0 | 2 | ( 7%) | 2 | ( 4%) | |
| Bought from neighbours/friends | 4 | ( 17%) | 10 | ( 35%) | 14 | ( 26%) |
| Bought from town market | 2 | ( 8%) | 2 | ( 7%) | 4 | ( 8%) |
| Given by neighbours/friends | 11 | ( 46%) | 3 | ( 10%) | 14 | ( 26%) |
| Other | 1 | ( 4%) | 1 | ( 3%) | 2 | ( 4%) |
| Total No. of Responses | 24 | (100%) | 29 | (100%) | 53 | (100%) |
Just over 75% of all fish-eating households stated that they preferred chicken to fish mainly because of the taste. Only 5 households said they preferred fish to chicken, but just over 16% (15 households) said that they liked both equally. Just under 60% of all duck-eating households said they liked both duck and chicken equally and 33% preferred the taste of chicken. Only 2 households said they preferred duck, one because they liked the taste and the other because they thought it had more meat. All households ate chicken and 65% reported eating chicken 2 – 3 times a month, usually on weekends.
Only 7% of respondents indicated that there were any cultural taboos preventing certain people from eating fish or ducks. Except for one respondent who said that unmarried Matabele women are not allowed to eat fish, all the remaining respondents said that the consumption of fish and/or ducks by pregnant women will affect the appearance of the child. Eating ducks will cause the child to have a long neck/webbed feet/look like a snake, whilst eating fish will give the child a large mouth. However, the very low response to the question suggests that these taboos are not well known, and are therefore not insurmountable.
There were a number of difficulties with the results from the Sesotho questionnaire. Some questions were clearly not understood and therefore the responses are unreliable, whilst the more straightforward answers had a high response rate.
The questionnaire was only distributed in Ramapepe/Thaba Patsoa. The results should therefore be compared with those households interviewed in that area only.
To a large extent, where questions have been answered, they reflect the findings described in Section 4.1. Results indicate that all households eat fresh fish, and that one-third of households reported having members (unidentified) who catch fish very occasionally for auto-consumption, using hook and line.
Slightly different responses were given when asked about other people outside the household who fished (Table 18), traders were mentioned as one of the main group of people that fish -traders were not mentioned at all by interviewed respondents.
Table 18: Other People Outside the Household Who Fish
| Other people in the village | 4 |
| People from neighbouring villages | 3 |
| Herdboys | 12 |
| Traders | 9 |
| Tourists | 1 |
| No response | 6 |
| Total No. of Responses | 35 |
Sixteen households said that they learnt how to cook fish from a women's group, no interviewed household had done so. Regarding utilization of the fresh fish in excess of that required for one meal, 18 households said they sun-dried the surplus and 10 households said they sold the extra fish to friends/neighbours.
Whilst only one interviewed household in Area 1 gave price as the reason for not eating more fish, four households gave price as a reason in the questionnaire.
When asked about preferences for chicken or fish, 75% of the responses indicated that they liked both equally, compared to the 5% of households who were interviewed. All except one household said that they ate ducks, with 64% of those saying that they liked chicken and duck equally. The main source of ducks was the household itself, with 67% of duck-eating households claiming that they reared ducks themselves.
![]()
![]()
![]()