The fishery at Sebaboleng Dam is a part-time activity for all persons included in the survey. A total of 240 part-time fishermen were identified during the survey period. Regular part-time fishermen make up 94% (225 persons) of the total number of fishermen identified, with the remaining 6% (15 persons) being occasional part-time fishermen. It is likely that the proportion of occasional fishermen is higher than that viewed over the whole survey year, as fishermen tended to reply that they went fishing several times a month, but were met only during a couple of months. The turnover of individuals at the dam is very high, making the total number of different persons identified also high. Meanwhile, the number of fishermen at any single day would rarely exceed 20.
Among regular part-time fishermen, the most common practice is to go fishing at only one reservoir, in this case Sebaboleng. 214 (95%) of these fishermen fish in that way. Fishing at two or more reservoirs is rare, with only 11 (5%) of the regular part-time fishermen reportedly doing so.
All the persons identified during the survey were men. It appears that women do not go out fishing, but take part in the processing and marketing of catches. Processing of fish mainly consists of sun-drying whole fish. Furthermore, marketing activities are few, as the amounts of fish sold are small.
None of the respondents cites fishing as his main economic activity, although some unemployed persons spend a lot of time fishing. Figure 3.1 below presents the main economic activities of the respondents.
A large number of the employed respondents are day-labourers who go fishing whenever they do not manage to secure a job. Many of these respondents work in the building sector. The group of unemployed persons fishing is almost as large as that of employed persons. Primary and secondary school attendants make up the group of students fishing at the dams.
Few of the respondents are members of fishermen's associations. Only eight respondents (6%), out of the 128 who replied to this particular question, reported such membership. Only one fishermen's association currently exists at Sebaboleng and it is headed by a local businessman.
| Figure 3:1 Main economic activity of respondents | 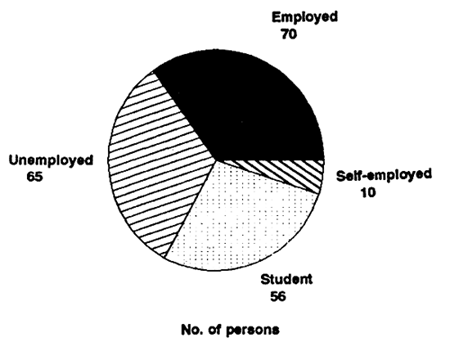 |
Figure 3.2 below describes the age structure of fishermen. It is clear that men below 40 years of age dominate the fishery, and many of them are actually below 20. The average age of the respondents is 29.
| Figure 3:2 Age structure of respondents | 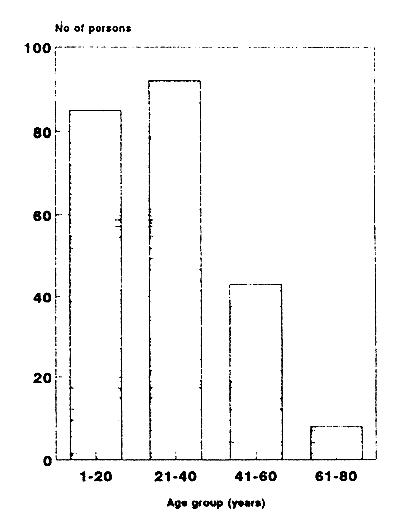 |
Most respondents started fishing during the 1980s and in the early 1990s, as indicated in Table 3.1 below. They may not have started at Sebaboleng dam, but elsewhere. This fact partly reflects the age structure of the fishermen. Many of the respondents had started fishing very recently: 46 (36%) of those who replied to this question, actually started fishing during 1991 or early 1992.
Table 3:1
Respondents' history of fishing
| When they started fishing | Number of persons | Percentage |
|---|---|---|
| 1921–40 | 1 | 1% |
| 1941–60 | 4 | 3% |
| 1961–80 | 19 | 15% |
| 1981–February '92 | 105 | 81% |
| Total no of responses | 129 | 100% |
Note: Number of responses low because question included only in second version of key sheet.
The most common way of learning how to fish is from friends (84%); the second-most common way is from relatives (16%).
The fishery at Sebaboleng is done mainly with handlines of different types, most of them displaying a low level of technology. The most common type, here referred to as hook and line, normally consists of a short piece of steel or aluminium wire stuck into the ground, to which one fishing line is attached. One or several hooks are attached to the line, as well as a sink. The use of floats or tackle was not observed on handlines during the survey period, except in the case of people who use manufactured rods and reels.
Rod and line is most commonly made of a rod of cane or wood, to which one fishing line is attached, and is otherwise similar to hook and line. Rod and reel is here used as the denomination for manufactured rods with reels of the type commonly used by sports fishermen.
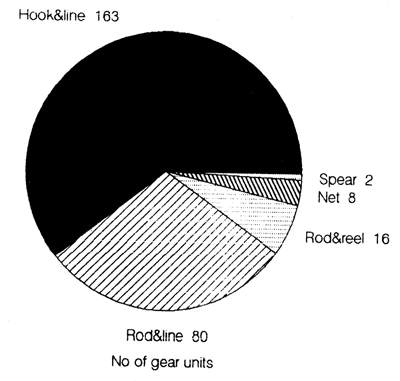
Figure 3:3 below provides a picture of the gear types used at Sebaboleng. By far the most common type used is hook and line, followed by rod and line. Rod and reels are reportedly used only in 16 units, and nets made of twine in 8 units. One person is also reported to use two spears. No other gear types, such as traps for example, are said to be used, and the enumerators did not observe any other gear either.
The fishing gear used at the reservoirs is mainly home-made with local materials and scrap: a few parts are bought. 150 respondents (62%) indicated that they had costs for their fishing gear when it was acquired. The average cost per gear unit was Maloti 23.43 (US$ 7.84). The lowest gear unit cost reported was M.20 (US$ 0.07) and the highest was M 500.00 (US$ 167.22). By way of comparison, the current retail price in Maseru (1993) for 100 metres of monofilament line plus 2 hooks of size either 1 or 2 is approximately M9.50 (US$ 3.17).2
2 Exchange rate used US$ 1.00 = Maloti 2.99
Figure 3:3
Gear types used
It is usual for hooks and lines to be bought: the rest of the gear (rod/wire stand and sink) consists of recycled material. In the case of rod and reel, the entire gear is bought. The nets used were made of nylon twine. The average cost indicated for a net was reported to be M61 (US$ 20.40). However, some of the respondents using nets do not indicate any cost at all. What mesh size was used, and whether multifilament or monofilament twine, is unknown, as it was not recorded by enumerators. However, some nets seen during the survey period were not manufactured fishing nets, but other net-like material used as seine nets. Nets were observed very few times during the survey.
Table 3:2
Use of different gear types
| No of gear types used | No of persons | Percentage |
|---|---|---|
| One type | 191 | 84% |
| Two types | 37 | 16% |
| Three types | 1 | <1% |
| Total no of responses | 229 | 100% |
The most common fishing practice is that of using only one gear type. Only 37 (16%) respondents combine different kinds of gear, as shown in Table 3:2 above.
The combination of gear types by far the most common is hook and line plus rod and line, followed by hook and line plus rod and reel. Apart from the results shown in Table 3:3, one fisherman combined three different gears. These were: hook and line, rod and line and rod and reel.
Table 3:3
Combinations of two gear types
| Gear combinations | No of persons | Percentage |
|---|---|---|
| Hook & line + Rod & line | 28 | 76% |
| Hook & line + Rod & Reel | 3 | 8% |
| Hook & line + Net | 2 | 5% |
| Rod & line + Rod & Reel | 3 | 8% |
| Rod & line + Net | 1 | 3% |
| Total no of responses | 37 | 100% |
It has been observed that the most frequently used line sizes are 0.4 mm and 0.6 mm (monofilament). The practice of attaching several hooks to the same line is common, although few individuals attach more than two hooks to one single line, as shown in Table 3:4 below. The size of the hooks used was not surveyed, but size number 2 has been observed to be very common.
Table 3:4
Number of hooks per handline
No of hooks/line
| 1 | 2 | 3 | 4 | Total no of responses | |
|---|---|---|---|---|---|
| No of persons | 75 | 83 | 25 | 2 | 185 |
| Percentage | 40 | 45 | 14 | 1 | 100 |
Questions on bait were not included in the survey. Nevertheless, observations indicate that brown bread is the most common bait. Flour (wheat or maize) mixed with water, and in some cases also with artificial colouring, is also commonly used. Bread and/or flour are also mixed with sour eggs and made into a compact ball, which does not dissolve in the water. Some fishermen use insects -- species unknown -- as well, which are said to be an efficient bait for catfish. Small frogs and meat are also used as bait for catfish.
198 (86%) of the respondents are gear owners. The practice of having an assistant/helper for the fishing is rare, which of course relates to the nature of gear used. Only 6 persons (3%) said they were assistants to gear owners.
Fishermen have cited a variety of reasons for fishing (Table 3.5 below). 152 (67%) respondents cite household consumption as the sole reason, making it by far the most common reason for fishing. This reflects the part-time character of the fishery and the low efficiency of the gear used. No structured market channels exist, although fish is said to be easy to sell to passers-by. However, since the size of the catches is highly variable, sales are made at random and do not give the fishermen any major incentive. Only 3.5% of the respondents fish exclusively for cash income. But household consumption in combination with cash is the second most frequent reason for fishing (21%).
Recreation is not a major reason for fishing: only 6.1% of the respondents say it is their sole reason for fishing. No respondent said he was fishing to use the catch for barter transactions. Only one respondent gave three different reasons for fishing.
Table 3:5
Reasons for fishing
| Reason for fishing | No of persons | Percentage |
|---|---|---|
| Household consumption | 152 | 66.7% |
| Household consumption + cash | 48 | 21.1% |
| Recreation | 14 | 6.1% |
| Cash sale | 8 | 3.5% |
| Household consumption + recreation or gift | 3 | 1.3% |
| Gift | 2 | 0.9% |
| Household consumption+cash+recreation. | 1 | 0.4% |
| Total no of responses | 228 | 100% |
From Figure 3:4 below, it can be deduced that a majority (71%) of fishermen go fishing four or more times a month. However, there is quite a high turnover of people fishing at the reservoirs. Many of those interviewed in the early phases of the survey had stopped fishing by the end of the survey; a lot of newcomers had taken up fishing.
Respondents were asked to name the two fish species they preferred to catch, and the size of the fish, in the order of importance. Table 3.6 lists the species of first preference and Table 3:7 the species of second preference. From these tables, it is clear that the most preferred species is common carp (Cyprinus carpio), followed by catfish (Clarias gariepinus) and mud mullet (Labeo umbratus). Smallmouth yellowfish (Barbus holubi) is not much preferred: nor is largemouth bass (Micropterus salmoides). None of the respondents preferred the bluegill sunfish (Lepomis macrochirus).
Figure 3:4
Frequency of fishing
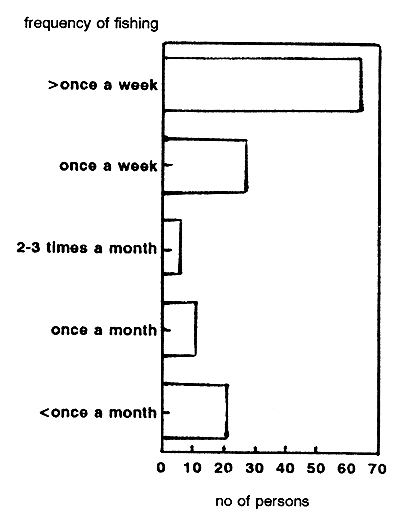
Note: The number of responses was low (129) because the question about fishing frequency was included only in the second version of the keysheet.
As for size preferences, only one fisherman said that he preferred the smallest size of fish, 0–10 cm long, and that was for catfish. Otherwise, the size class most commonly preferred size class was fish more than 31cm long, regardless of the species.
The average time needed for respondents to walk to the dams from their home is 20 minutes. The slowest reported walking time was two-and-a-half hours and the quickest was just one minute. Most of the fishermen live very close to the dam, as the map below indicates.
As many as 179 (78%) of the respondents report that they live in Motimposo, Lower or Upper Thamae, Ha Tsiu or Tsenola, which are the neighbourhoods closest to Sebaboleng.
Table 3:6
First preference of fish species
| Species/length class | 0–10 cm | 11–20 cm | 21–30 cm | >31 cm | Number of responses |
|---|---|---|---|---|---|
| Common carp | 0 | 1 | 3 | 166 | 170 (75%) |
| Catfish | 0 | 0 | 0 | 28 | 28 (12%) |
| Mud mullet | 0 | 1 | 3 | 22 | 26 (12%) |
| Smallmouth yellowfish | 0 | 0 | 0 | 2 | 2 (1%) |
| Largemouth bass | 0 | 0 | 0 | 0 | 0 (0%) |
| Total no of responses | - | - | - | - | 226(100%) |
Note: Percentages of total in brackets.
Table 3:7
Second preference of fish species
| Species/length class | 0–10 cm | 11–20 cm | 21–30 cm | >31 cm | Number of responses |
|---|---|---|---|---|---|
| Common carp | 0 | 1 | 3 | 41 | 45 (21%) |
| Catfish | 1 | 0 | 0 | 92 | 93 (43%) |
| Mud mullet | 0 | 0 | 8 | 65 | 73 (34%) |
| Smallmouth yellowfish | 0 | 0 | 0 | 2 | 2 (1%) |
| Largemouth bass | 0 | 0 | 0 | 3 | 3 (1%) |
| Total no of responses | - | - | - | - | 216 (100%) |
Note: Percentages of total in brackets.
| Map 1. Sebaboleng Dam and neighbourhoods | 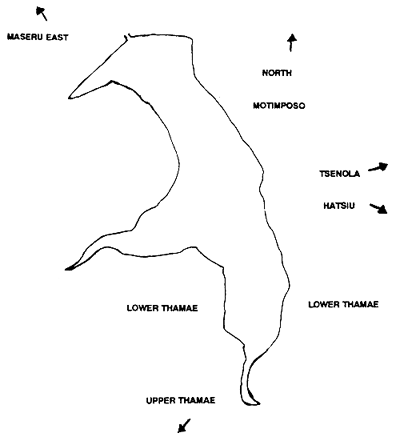 |