Three Chambo species are identified in Lake Malawi; O. lidole, O. squamipinnis and O. karongae. These species form the basis of important commercial fisheries (both industrial and small scale artisanal fisheries) in the south east arm of the Lake, which is the most productive part. There is considerable overlap in the exploitation of the different species of Chambo by the different gears. The industrial gears are midwater trawls, pair trawls, bottom trawls and ringnets whereas the traditional gears are gillnets, chambo seines, kambuzi seines, nkacha nets and chirimila nets. Each takes the three Chambo species in different proportions.
In Lake Malombe the three species of Chambo have also been identified but the dominant species are O. squamipinnis and O. karongae. These species are exploited entirely by traditional gears: gillnets, chambo seines, kambuzi seines and nkacha nets.
For a judicious exploitation and management of the Chambo resources, information on the dynamics of the stocks and biology of the species is essential. The present study estimates the population parameters of the stocks in the south east arm of Lake Malawi and Lake Malombe and uses the length frequency data collected during 1990/91 in a predictive analysis.
The length frequency data of the different species of Chambo collected from all chambo exploiting gears in the south east arm of Lake Malawi and in Lake Malombe between August 1990 and September 1991 form the main data base of this study. The total length of individual fish was measured to the nearest 0.5 cm and the samples were grouped into 1.0 cm class intervals.
Samples were not measured at the beach because of the taxonomic problem of separating the Chambo species and most samples collected from the traditional fisheries were preserved in formalin before processing. The sample weight for each species of Chambo from each gear was obtained on a monthly basis from the length frequency sample using a length weight relationship. Kambuzi seines and nkacha nets have been sampled less than adequate, as Kasawala (juvenile Chambo) was sometimes overlooked and fishermen tended to hide their catches during the closed season.
On a monthly basis for each gear Chambo samples were sorted by species and measured. Lengths were converted to weight to obtain the sample weight. A raising factor was obtained for each gear by dividing the total catch and the sample weight. This factor was then used to raise the length frequency of the sample to one for the total catch.
Monthly total catches by gear in the traditional fisheries are produced by Malawi Traditional Fisheries (MTF) catch-effort data collection system.
2.1. Estimation of growth parameters
Each length frequency sample was resolved into normally distributed cohort components (Table 1) using the Bhattacharya method (LFSA package, Sparre et al., 1987).
The Gulland and Holt plot and Von Bertalanffy non-linear least square regression method were used (using the Paper and Pencil approach) to estimate growth parameters (Table 2). The Gulland and Holt plot was applied after the mean lengths of the cohort components were linked in a modal progression analysis in a way thought to represent the growth pattern. This compared well with aged fish (Banda, 1992). The resulting growth increments in length, based on a chosen time interval, were used to estimate growth parameters K and Linf. The Von Bertalanffy plot provided another set of K, Linf and to estimates.
2.2. Estimation of mortality rates
Total mortality rate (Z) was estimated using Jones' linearized length converted catch curve method. The method assumes Z to remain constant for a range of length groups, and it provides estimates of Z for these length groups only. Natural mortality (M) is usually a difficult parameter to estimate in the absence of an unexploited resource.
Based on the knowledge of the biology of the different species of Chambo, a qualified quess of M was made. Chambo is a mouth brooder, giving great care to its fry. It is expected that once the juveniles are beyond parental care natural mortality initially is relatively high, becoming less with increasing size as no major fish predators, apart from man, exist for the larger fish.
Pauly (1983) gives the following formula for estimation of M:
Ln M = -0.0152 - 0.279 Ln Linf + 0.6543 Ln K + 0.463 Ln T
However it is felt that Pauly's formula over-estimates M (values as high as 0.78 were obtained).
Gunderson and Dygert (1988) relate M to gonad and somatic weights in the following formula:
M = 0.03 + 1.68 * (wet weight of gonad/somatic weight)
This method gives very low values of M for Chambo (as low as 0.04). Like Pauly's it was mainly based on marine fish with comparatively huge egg production and no parental care.
The Rikhter and Efanov (1976) method relate M to age at 50 % maturity (Tm50%):
M = 1.521/(Tm50%^0.720) - 0.155 per year
which gives M values between 0.40 and 0.53 when Tm50% is taken to be 3 and 4 years.
A sensitivity analysis using intermediate values of M ranging from 0.04 to 0.8 were carried out. The best fit was obtained when M was allowed to vary, being largest (M=0.4) for 0–15 cm fish and smallest (M=0.2) for 25–40 cm fish and of intermediate value (M=0.3) for the 15–25 cm fish. Fry and Kimsey (1960) determined M as 0.1 for the unexploited adult population of Tilapia niloticus in Lake George in Uganda. This species can grow to more than 46 cm in total length. With Linf in the range of 39–43 cm, it is thought the choice of 0.2 for the adult Chambo is a reasonable approximation.
2.3. Estimation of stock size and fishing mortality from cohort analysis
Jones' (1984) length cohort analysis was used to estimate stock size and fishing mortalities using a standard SUPERCALC spreadsheet. This method uses a constant M for all length groups, whereas F may vary and the length composition data is assumed to represent an average situation. Fundamental assumptions are that fishing effort and recruitment remain constant thereby affecting all age classes in the same way.
The use of a spreadsheet allowed M to be varied on various lengths. The terminal exploitation rate (E = F/Z) was chosen so that the exploitation rate for the last 4 length-groups became approximately equal as they all are fully exploited. The values chosen were obtained by iterative trials. Input data are M, K, Linf and a and b of the length\weight relationship.
2.4 Partitioning of total fishing mortality and yields from Chambo fishery into an artisanal and an industrial component
The total fishing mortality and yields can be partitioned between artisanal and industrial fleets in the same proportions as the numbers of fish caught in either fisheries (see Garcia and Van Zalinge (1982), method cited in Sparre et al, 1989). Separate components for pair trawls were not attempted as there were only four months of length frequency data from this gear, which were combined with the industrial fisheries. The total annual Chambo production from pair trawls was insignificant.
2.5. Predictive analysis of equilibrium yield and stock biomass (Thompson and Bell, 1934, cited in Sparre et al., 1989).
Yield (catch in weight) and stock biomass were predicted for various levels of fishing effort, using the length based Thompson and Bell analysis, which was relevant only for the southeast arm Chambo species since the stocks are in steady state but not Lake Malombe Chambo stocks. Input data are the fishing mortalities per length group and average number recruited to the smallest length group (= actual recruitment). The analysis then assesses the effect of increasing or decreasing the fishing pressure (the F at length array). It computes the expected yield at present as well as the mean biomass for different effort levels, relative to the present level of fishing. The method assumes constant recruitment and predicts average long-term catches.
Chambo prices per Kg are regularly collected by the MTF catch-effort data collection system and are also obtained from Maldeco fisheries:
South East Arm of Lake Malawi:
MK1.04 per kg for lengths between 3 – 15 cm
MK1.92 per kg for lengths between 16 – 40 cm
Lake Malombe
MK0.64 per kg for lengths between 3 – 15 cm
MK1.55 per kg for lengths between 16 – 40 cm
2.6. Fo.1 (F nought point one) target.
This analysis is only used for the south east arm of Lake Malawi Chambo species. This is defined as the level of fishing mortality (F) at which the increase in yield for one unit of effort is one tenth of the increase experienced at very low levels of effort. It is often approximated by using 10% of the F at the maximum rate of yield-per-recruit. At the start of a fishery, F is low, and an increase in F brings increased catches. At higher F, the curve flattens out and at the maximium yield-per-recruit no increase in yield can be achieved by increasing F further, as recruitment becomes negatively affected. The Fo. 1 target lies at lower effort levels than Fmsy derived from Surplus Yield, Thompson and Bell or Beverton and Holt models. Thus it allows for improved profitability in the fishery and will not lead so easily to growth or recruitment overfishing. A detailed description of this target is given by Gulland (1984).
2.7. Mesh selectivity
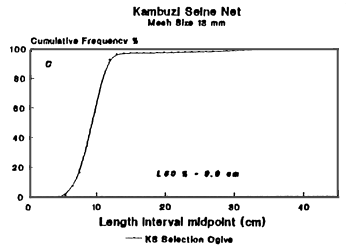
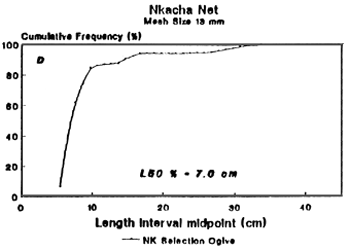
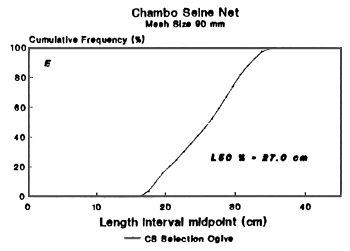
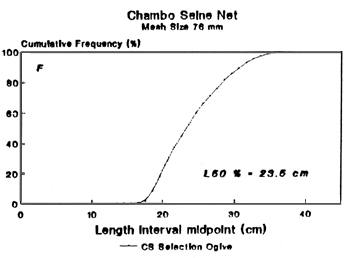
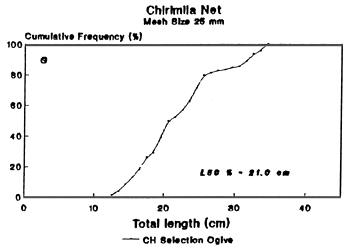
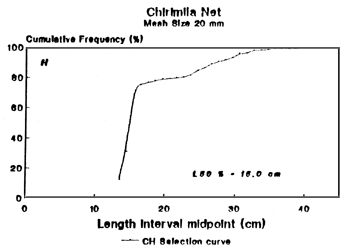
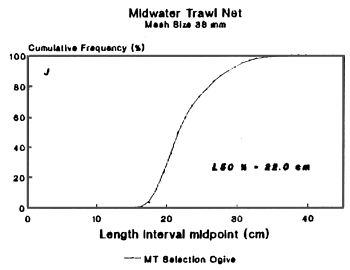
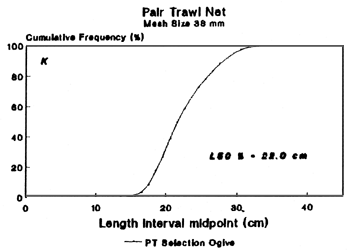
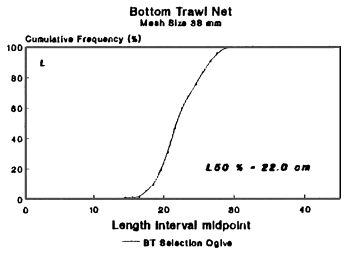
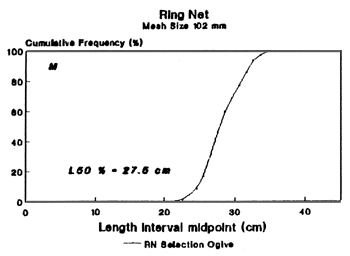
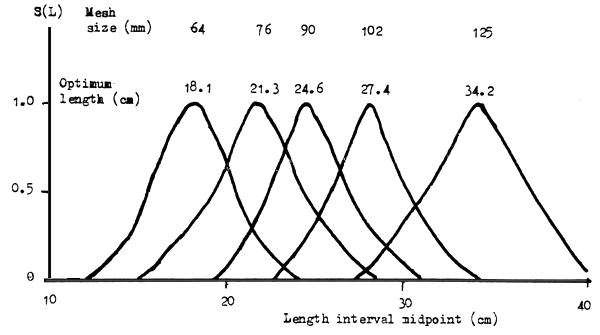
The mesh selectivity of various gears exploiting the Chambo stocks in the project region was investigated using length frequency samples of the commercial catches of different mesh sizes. For chambo seines, kambuzi seines, nkacha nets, chirimila nets, pair trawls, midwater trawls, bottom trawls and chambo ringnet a cumulative selection curve (assuming a trawl-type selection) was estimated for each mesh and the 50% retention point (optimum length) was obtained from the curve. For gillnets, the optimum length for five different meshes was estimated from experimental gillnet data (collected by Traditional Fisheries Assessment Project, 1986–91). The selectivity of different meshes of gillnets was determined by taking each pair of successive meshes under the assumption that they have the same fishing power. Data for the analysis are numbers by length group caught by each mesh size of the fleet (see Sparre et al., 1989 for details).
The effect of increase in mesh size on gear selectivity for Chambo was investigated for the various gears.
3.1 Population parameter and stock estimates
Table 1 shows that in most cases five components can be successively separated from the length frequency distribution of the different species of Chambo. The resolution of the mean lengths of cohort components becomes uncertain for older age groups. In general the Gulland and Holt plot over-estimates K compared to the Von Bertalanffy method (Table 2a). The choice of Linf and K for use in catch curve analysis with the aim of estimating the overall mortality was made by comparing the resultant growth curves (Phi prime) with those of other Tilapia species. Moreau et al (1986) stated that the best growth performance index was in O. niloticus from river Kainje in Nigeria with a Phi value of 2.65 (see Table 2a for Chambo values).
During its life cycle Chambo is exploited by different fisheries in a sequential order: small meshed seine net fisheries (in particular kambuzi seines and nkacha nets) exploit the juvenile stages (0+, 1+ years of age) in the shallow near-shore waters, while the large meshed gillnet fisheries exploit the older fish (3+ and older fish) that has moved into deeper waters. The 2+ fish apparently escapes heavy exploitation. The proportions of the juvenile population of the different species of Chambo caught by seine nets was difficult to estimate accurately since taxonomic problems precluded species separation.
The total mortality rates (Z) for the different species of Chambo are given in Table 2b. The largest length groups are not used in the estimation of Z since relationship between length and age becomes unreliable for large fish. The smallest length groups were also not used because of sampling problems and they may also not be fully exploited.
Tables 3a to 3e and Figure 2 give the results of the length based cohort analysis. For each length the estimated numbers of fish caught, the size of the population and fishing mortality (F) are given. Figure 2 shows the distribution of the F at length for the Chambo species. Particularly in the south east arm fishing pressure appears to be highest on the adult Chambo with a length range >= 28 cm (which corresponds to the age of entry (tc = 3 or 4 yr) into the industrial fisheries in the south east arm and the gillnet fishery in Lake Malombe. In Lake Malombe Fmax is at 10 cm. Sequential fisheries have a more pronounced effect on the Chambo stocks in Lake Malombe than on those in Lake Malawi. This is mainly due to the abundance of seine nets in Lake Malombe.
Tables 4a-d and Figure 3 give the results of length based Thompson and Bell yield per recruit analysis, value of yield and average biomass per recruit. For O. lidole the maximum sustainable yield (MSY) of this species is at a lower effort level than presently exerted. For O. squamipinnis the MSY is estimated at 60% of the present effort level. For O. karongae the MSY and MSE (maximum sustainable economic yield) are at 70% of the present effort level. Combined analysis for Oreochromis spp in the south east arm gave current annual yield and average biomass as 3379 tonnes and 9713 tonnes respectively. The value for the current yield is MK 6,426,000. The MSY and MSE are at 70% of the current effort. Certainly O. squamipinnis is harder hit than O. karongae and O. lidole.
In lake Malombe, the situation is different. Present recruitment is very low due to a severely depleted parent stock and continuous exploitation of juveniles and spawners.
3.2 Mesh size selection
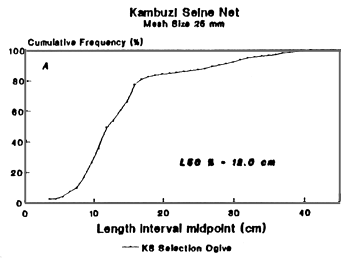
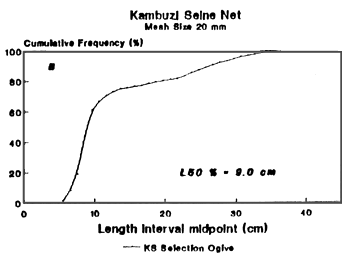
The estimated optimum lengths (L50%) for different meshes in various Chambo exploiting gears are given and shown in Table 6 and Figure 4. Only 90 mm chambo seine, 90 mm, 102 mm, 125 mm gillnet and 102 mm ringnet take either mature or post spawning Chambo.
The present analysis suggests that in the south east arm, for O. lidole, around 70% of the fishing mortality (F) is caused by industrial fishery. For O. squamipinnis about 53% of the F is caused by industrial fisheries. For O. karongae over 73% of the F is caused by the artisanal fishery. Cohort analysis under-estimated juvenile population of Oreochromis spp. because of difficulties sampling this population.
In Lake Malombe, the juvenile Chambo are heavily exploited by small meshed nets (kambuzi seine and nkacha nets) and this has resulted in severe recruitment and growth overfishing with the consequent collapse of the Chambo stocks from catch levels of around 5000 t to less than 500 t (Van Zalinge et al, 1991). Whereas effort in the gillnet fishery remained fairly constant, recruitment was dramatically affected by the decrease in the parental stock size (noticeable by the rapid decline in the gillnet CPUE from 1984–91) caused by the capture of large numbers of juvenile Chambo.
The Thompson and Bell analysis and the Fo.1 target suggest a reduction in effort for the south east arm Chambo species to achieve both the MSY and MSE in the longterm. For example for O. lidole a 30% reduction in effort is suggested but the Fo.1 strategy gave a management target of 1550 t with a 62% reduction in current effort (Table 5). It can be seen from Table 5 that the Fol.1 management strategy is clearly more feasible here since it advocates a reduction in current effort by a significant amount to achieve a targetted yield.
In Lake Malombe the gillnet fishery is on the decline, but the current effort exploiting the parent stock is still too high for the fishery to be sustainable in the longterm given the current fishing regime with seine nets also exerting an excessive fishing pressure on the inshore juvenile population. The Lake Malombe situation could serve as a lesson for the protection of the south east arm Chambo stocks by instituting without delay strong regulatory action on the inshore seine net fishery in that lake.
The Thompson and Bell analysis and the Fo.1 target show that a higher yield per recruit and thus a higher yield would be achieved by reducing fishing effort (or F), and/or by increasing the age of recruitment by management measures such as an increase in mesh size. This suggests that with reduced effort, especially of the inshore gears, recruitment into the fish stocks would be increased resulting in a higher biomass. Juvenile and immature fish would now be allowed to grow to adult fish. It may thus be confirmed here that the collapse of the Lake Malombe Chambo stocks has been due to growth and recruitment overfishing. The rapid decline in biomass curve (Figure 3) for all species of Chambo after the current fihery suggests that no increase in effort can be accommodated. Biomass in an equilibrium fishery is proportional to CPUE.
It is impossible to state accurately what gillnet mesh size would give an increase in age of recruitment to 3 years but its likely that a 95 mm mesh size increase for gillnet throughout Lakes Malawi and Malombe and a ban on kambuzi seine and nkacha net would be needed. The change in selection parameters after mesh change can be investigated in the following manner. The increase in mesh size of kambuzi seine from 25 mm (with L50% = 12 cm of Chambo) to 38 mm would result in an increase in optimum length to 18.2 cm. This is also applicable to the nkacha net. This is based on the following rough relationship:

With this relationship, the increase in mesh size of Maldeco's Midwater Crystal Lake from 38 mm to 102 mm would result in an increase in optimum length to 59.1 cm, which is obviously wrong. A global increase in mesh size for midwater trawls, pair trawls and bottom trawls to 52 mm would give an optimum length of 30.1 cm.
There are a number of problems with an analysis of this nature, as it has been influenced by annual recruitment fluctuations and is based on a ‘pseudo-cohort’ with data from only one year available, which are assumed to resemble a single cohort during its life span. As a matter of fact different cohorts have been lumped together and treated as one. Thus the influence of varying recruitment and a different fishing regime greatly affected the outcome of the present study. The introduction on a large scale of the nkacha nets in Lake Malombe and the consequent reduction of the spawning biomass has changed the size of recruitment since 1985.
Another major draw-back for an indepth analysis of this nature is the problem of estimating correctly the natural mortality. All analytical models in fish stock dynamics include as a parameter the natural mortality coefficient. Unfortunately, estimating M is not easy, particularly where a population is heavily exploited. The value of M greatly affects the behaviour of the yield function of an exploited fish population (Beverton and Holt, 1957). Over-estimating M will underestimate the fishing mortality and overestimate stock sizes and the reverse is to be expected if M is underestimated. The choice of M in this study is therefore a subject of discussion and further research should be undertaken to estimate this parameter.
Banda, M. C. 1992. Age and growth determination of Chambo species from opercular bone. GOM/FAO/UNDP Chambo Fisheries Research Project. FI:DP/MLW/86/013, Field Document in prep.
Beverton, R. J. H and S. J. Holt, 1957. On the dynamics of exploited fish populations. Fish. Invest., Lond., Ser. 2, 19. 533 pp.
Fry, D. H. and J. B. Kimsey, 1960. Report on the fisheries in Lake George, Uganda (unpublished FAO Report).
Garcia, S. and N. P. van Zalinge, 1982. Shrimp fishing in Kuwait: methodology for a joint analysis of the artisanal and industrial fisheries. In Report on the workshop on assessment of the shrimp stocksof the west coast of the Gulf between Iran and the Arabian peninsula. Fisheries development in the Gulf. Rome, FAO, FI:DP/RAB/80/015/1: 119–42
Gulland, J. A. 1984. Advice on target fishing rates. Fishbyte 2(1):8–11.
Gunderson, D. R and P. H. Dygert, 1988. Reproductive effort as a predictor of natural mortality rate. J. cons. CIEM., 44:200–9.
Jones, R. 1984. Assessing the effect of changes in exploitation pattern using length composition data (with notes on VPA and cohort analysis). FAO Fish. Tech. Pap., 256:118p.
Mesnil, B. 1989. Computer programs for fish stock assessment. ANACO: Software for the analysis of catch data by age group on IBM-PC and compatibles. FAO Fish. Tech. Pap. No. 101, Suppl. 3. Rome, FAO. 1989. 73p.
Moreau, J., C. Bambino and D. Pauly. 1986. Indices of overall growth performance off 100 tilapia (cichlidae) populations, P. 201– 206. In J. L. Maclean, L. B. Dizon and L. V. Hosillos (eds.). The First Asean Fisheries Forum. Asean Fishreies Society, Manila, Philippines.
Pauly, D. 1980. On the inter-relationships between natural mortality, growth parameters and mean environmental temperature in 175 fish stocks. J. cons. CIEM., 39(2):175–92.
Sparre, P., E. Ursin and S. C. Venema. 1989. Introduction to tropical fish stock assessment Part 1. Manual. FAO Fish. Tech. Pap. no. 306(1). Rome FAO. 337 p.
Rikhter, V. A. and V. N. Efanov. 1976. On one of the approaches to estimation of natural mortality of fish populations. ICNAF Res. Doc., 76/VI/8:12.
Van Zalinge, N. P. et al. 1991. Preliminary note on the decline of Chambo catches in Lake Malombe. GOM/FAO/UNDP Chambo Fisheries Research Project. FI:DP/MLW/86/013, Field Document 9.
Table 1. Mean lengths of components identified in Bhattacharya analysis
| Area: South East Arm | 1(a) Species: O. lidole | ||||||
| Month/year | Components | ||||||
| 1 | 2 | 3 | 4 | 5 | 6 | 7 | |
| Aug/90 | 21.7 | 25.7 | 28.7 | 32.2 | - | - | - |
| Sep | 12.3 | 21.1 | 27.4 | 31.3 | - | - | - |
| Oct | 28.6 | 32.6 | - | - | - | - | - |
| Nov | 19.2 | 27.0 | 32.1 | - | - | - | - |
| Dec | 17.0 | 19.1 | 23.8 | 28.1 | - | - | - |
| Jan/91 | 19.8 | 27.5 | - | - | - | - | - |
| Feb | 17.4 | 21.4 | 24.7 | 31.9 | - | - | - |
| Mar | 18.8 | 24.9 | 27.9 | 31.7 | - | - | - |
| Apr | 19.7 | 22.6 | 25.0 | 28.7 | 31.7 | - | - |
| May | 18.8 | 23.6 | 26.7 | 31.3 | 32.8 | - | - |
| Jun | 6.3 | 20.0 | 24.2 | 29.1 | - | - | - |
| Jul | 8.0 | 19.0 | 21.0 | 25.2 | 28.6 | - | - |
| Area: South East Arm | 1(b) Species: O. squamipinnis | ||||||
| Month/year | Components | ||||||
| 1 | 2 | 3 | 4 | 5 | 6 | 7 | |
| Aug/90 | 20.1 | 21.7 | 26.2 | 31.1 | - | - | - |
| Sep | 21.1 | 24.7 | 27.8 | 32.8 | 35.6 | 38.0 | - |
| Oct | 21.9 | 27.4 | 32.4 | - | - | - | - |
| Nov | 20.0 | 25.1 | - | - | - | - | - |
| Dec | 17.9 | 20.1 | 22.0 | 25.2 | 31.2 | - | - |
| Jan/91 | 19.9 | 24.6 | 29.5 | - | - | - | - |
| Feb | 21.1 | 24.3 | 30.0 | - | - | - | - |
| Mar | 16.9 | 19.9 | 24.9 | 26.9 | 32.2 | - | - |
| Apr | 11.2 | 18.1 | 31.4 | - | - | - | - |
| May | 6.9 | 20.8 | 23.8 | 25.8 | - | - | - |
| Jun | 6.3 | 20.8 | 24.1 | 26.7 | 30.0 | - | - |
| Jul | 7.9 | 21.3 | 25.0 | 27.0 | 32.1 | - | - |
| Area: South East Arm | 1(c) Species: O. karongae | ||||||
| Month/year | Components | ||||||
| 1 | 2 | 3 | 4 | 5 | 6 | 7 | |
| Aug/90 | 19.1 | 23.8 | 26.6 | 30.2 | - | - | - |
| Sep | 16.9 | 23.1 | 31.4 | 33.2 | - | - | - |
| Oct | 21.7 | 24.7 | 27.0 | 32.0 | - | - | - |
| Nov | 14.8 | 16.9 | 19.0 | 20.9 | 23.6 | 25.7 | 28.1 |
| Dec | 13.7 | 16.0 | 19.6 | 22.0 | 25.9 | 30.1 | 32.5 |
| Jan/91 | 18.8 | 23.5 | - | - | - | - | - |
| Feb | 19.5 | 22.0 | 24.6 | 30.1 | - | - | - |
| Mar | 18.3 | 25.1 | 32.3 | - | - | - | - |
| Apr | 14.6 | 19.5 | 23.6 | 31.4 | 35.2 | - | - |
| May | 18.0 | 20.7 | 24.0 | 30.5 | - | - | - |
| Jun | 6.3 | 21.1 | 24.2 | 26.6 | - | - | - |
| Jul | 7.1 | 16.0 | 21.9 | 25.9 | 28.6 | - | - |
| Area: Lake Malombe | 1(d) Species: Oreochromis spp. | ||||||
| Month/year | Components | ||||||
| 1 | 2 | 3 | 4 | 5 | 6 | 7 | |
| Oct/90 | 12.3 | 17.8 | 22.1 | 26.3 | 29.9 | 35.4 | - |
| Nov | 11.9 | 13.9 | 15.7 | 23.5 | 29.5 | 34.9 | - |
| Dec | 18.0 | 22.2 | 25.6 | 28.9 | 32.0 | - | - |
| Jan/91 | 23.2 | 27.4 | 30.0 | - | - | - | - |
| Feb | 23.4 | 27.4 | 30.7 | - | - | - | - |
| Mar | 7.9 | 13.5 | 22.6 | 28.0 | 32.6 | - | - |
| Apr | 9.0 | 15.3 | 18.0 | 24.2 | 28.8 | 33.6 | - |
| May | 9.6 | 23.6 | 28.9 | 31.5 | 34.4 | - | - |
| Jun | 9.3 | 14.5 | 17.7 | 20.0 | 24.3 | 28.1 | - |
| Jul | 7.0 | 13.5 | 19.9 | 24.9 | 29.2 | - | - |
| Aug | 9.5 | 18.7 | 24.8 | 28.8 | 30.5 | - | - |
| Sep | 21.7 | 24.2 | 28.0 | 31.2 | - | - | - |
Table 2. Estimated population parameters and growth performance indices
2(a) Area: South East Arm of Lake Malawi (SEA)
| Species: O. lidole | |||||
| Linf cm | K/yr | to/yr | Phi prime | r | Method |
| 36.8 | 0.67 | - | 2.96 | - 0.822 | Gulland and Holt plot Least square non-linear regression method (Von Bertalanffy) |
| 43.1 | 0.18 | -2.26 | 2.52 | 0.993 | |
| Species: O. squamipinnis | |||||
| 40.4 | 0.63 | - | 3.01 | - 0.757 | Gulland and Holt plot Least square non-linear regression method (Von Bertalanffy) |
| 38.5 | 0.26 | -1.86 | 2.58 | 0.998 | |
| Species: O. karongae | |||||
| 39.4 | 0.50 | - | 2.89 | - 0.780 | Gulland and Holt plot Least square non-linear regression method (Von Bertalanffy) |
| 39.8 | 0.24 | -1.58 | 2.58 | 0.996 | |
| Species: Oreochromis spp | |||||
| 40.5 | 0.23 | - | 2.58 | Average from Von Bertalanffy Growth parameters above | |
Area: Lake Malombe
Species: Oreochromis spp
| Linf cm | K/yr | to/yr | Phi prime | r | Method |
| 42.0 | 0.32 | - | 2.75 | - 0.477 | Gulland and Holt plot Least square non-linear regression method (Von Bertalanffy) |
| 36.6 | 0.29 | -1.23 | 2.59 | 0.922 | |
2(b) Estimated total mortality rates (Z)
| Spp | Area | Z | 95 % CL | r |
| O.lidole | SEA | 0.85 | (0.65, 1.05) | -0.931 |
| O. squam. | SEA | 1.09 | (0.86, 1.32) | -0.940 |
| O. karon. | SEA | 0.81 | (0.74, 0.87) | -0.991 |
| Oreochro. | SEA | 0.87 | (0.80, 0.93) | -0.994 |
| Oreochro. | Malombe | 1.18 | (0.96, 1.39) | -0.967 |
Table 3a. Length cohort analysis of commercial catches of O. lidole in the south east arm of Lake Malawi, August 1990–July 1991.
| Length class(cm) | C | Ftot | Fcf | Ftf | Ytot | Ycf | Ytf | B |
| 3–5 | 0 | 0.000 | 0.000 | 0.000 | 0.0 | 0.00 | 0.00 | 7.9 |
| 5–7 | 66398 | 0.012 | 0.000 | 0.012 | 0.3 | 0.00 | 0.30 | 22.7 |
| 7–9 | 399191 | 0.078 | 0.000 | 0.078 | 3.8 | 0.00 | 3.80 | 48.2 |
| 9–11 | 75983 | 0.016 | 0.000 | 0.016 | 1.4 | 0.00 | 1.40 | 85.4 |
| 11–13 | 13635 | 0.003 | 0.000 | 0.003 | 0.4 | 0.00 | 0.40 | 135.8 |
| 13–15 | 9555 | 0.002 | 0.001 | 0.001 | 0.5 | 0.10 | 0.40 | 198.8 |
| 15–17 | 21187 | 0.006 | 0.004 | 0.002 | 1.5 | 0.92 | 0.58 | 277.7 |
| 17–19 | 91494 | 0.025 | 0.015 | 0.010 | 9.4 | 5.75 | 3.65 | 374.6 |
| 19–21 | 198658 | 0.058 | 0.034 | 0.024 | 28.0 | 16.37 | 11.63 | 479.5 |
| 21–23 | 267126 | 0.086 | 0.064 | 0.022 | 50.0 | 37.04 | 12.96 | 583.9 |
| 23–25 | 369602 | 0.133 | 0.095 | 0.038 | 90.0 | 64.37 | 25.63 | 674.7 |
| 25–27 | 603563 | 0.251 | 0.178 | 0.073 | 185.6 | 131.95 | 53.65 | 740.7 |
| 27–29 | 875254 | 0.459 | 0.322 | 0.137 | 335.8 | 235.58 | 100.22 | 731.4 |
| 29–31 | 691784 | 0.528 | 0.369 | 0.159 | 326.0 | 227.99 | 98.01 | 617.5 |
| 31–33 | 566643 | 0.752 | 0.550 | 0.202 | 323.8 | 236.97 | 86.01 | 430.8 |
| 33–35 | 284850 | 0.920 | 0.686 | 0.234 | 190.0 | 142.36 | 47.64 | 212.1 |
| 35–37 | 76141 | 0.957 | 0.797 | 0.160 | 61.8 | 51.45 | 10.35 | 64.6 |
| 37plus | 8335 | 0.800 | 0.326 | 0.475 | 7.9 | 3.21 | 4.69 | 9.9 |
| Total | 4619399 | 1621.2 | 1157.1 | 464.19 | 5696.2 | |||
| Linf = 43.1 cm K = 0.18/year Terminal exploitation rate = 0.80 W = 0.018 L ^2.99 (g, cm) | ||||||||
3(b). Length cohort analysis of commercial catches of O. squamip. in the south east arm of Lake Malawi, Aug 1990–Jul 1991.
| Length class(cm) | C | Ftot | Fcf | Ftf | Ytot | Ycf | Ytf | B |
| 3–5 | 0 | 0.000 | 0.000 | 0.000 | 0.0 | 0.00 | 0.00 | 4.6 |
| 5–7 | 264045 | 0.089 | 0.000 | 0.089 | 1.2 | 0.00 | 1.20 | 13.6 |
| 7–9 | 240238 | 0.086 | 0.000 | 0.086 | 2.5 | 0.00 | 2.50 | 29.4 |
| 9–11 | 12366 | 0.005 | 0.000 | 0.005 | 0.2 | 0.00 | 0.20 | 53.6 |
| 11–13 | 12902 | 0.005 | 0.000 | 0.005 | 0.4 | 0.00 | 0.40 | 88.1 |
| 13–15 | 26907 | 0.011 | 0.003 | 0.008 | 1.5 | 0.35 | 1.15 | 132.8 |
| 15–17 | 50009 | 0.021 | 0.013 | 0.008 | 4.0 | 2.43 | 1.57 | 190.6 |
| 17–19 | 215781 | 0.095 | 0.071 | 0.024 | 24.7 | 18.44 | 6.26 | 261.1 |
| 19–21 | 509873 | 0.242 | 0.162 | 0.080 | 79.8 | 53.39 | 26.41 | 329.1 |
| 21–23 | 745183 | 0.416 | 0.226 | 0.190 | 154.8 | 83.98 | 70.82 | 372.2 |
| 23–25 | 987184 | 0.744 | 0.313 | 0.431 | 265.8 | 111.87 | 153.93 | 357.4 |
| 25–27 | 861906 | 1.072 | 0.522 | 0.549 | 294.6 | 143.62 | 150.98 | 274.9 |
| 27–29 | 449470 | 1.144 | 0.690 | 0.454 | 191.6 | 115.55 | 76.05 | 167.4 |
| 29–31 | 162423 | 1.003 | 0.593 | 0.410 | 85.1 | 50.30 | 34.80 | 84.8 |
| 31–33 | 47089 | 0.741 | 0.487 | 0.254 | 29.9 | 19.65 | 10.25 | 40.4 |
| 33–35 | 12291 | 0.456 | 0.254 | 0.202 | 9.4 | 5.23 | 4.17 | 20.5 |
| 36plus | 5156 | 0.467 | 0.366 | 0.100 | 4.7 | 3.69 | 1.01 | 10.0 |
| Total | 4602823 | 1150.2 | 608.5 | 541.7 | 2430.4 | |||
| Linf = 38.5 cm K = 0.26/year Terminal exploitation rate = 0.70 W = 0.020 L ^2.99 (g, cm) | ||||||||
3(c). Length cohort analysis of commercial catches of O. karongae in the south east arm of Lake Malawi, Aug 1990–Jul 1991.
| Length class(cm) | C | Ftot | Fcf | Ftf | Ytot | Ycf | Ytf | B |
| 3–5 | 0 | 0.000 | 0.000 | 0.000 | 0.0 | 0.00 | 0.00 | 2.8 |
| 5–7 | 21981 | 0.011 | 0.000 | 0.011 | 0.1 | 0.00 | 0.10 | 8.4 |
| 7–9 | 386427 | 0.203 | 0.000 | 0.203 | 3.7 | 0.00 | 3.70 | 18.1 |
| 9–11 | 86738 | 0.049 | 0.000 | 0.049 | 1.6 | 0.00 | 1.59 | 32.3 |
| 11–13 | 45598 | 0.027 | 0.000 | 0.027 | 1.4 | 0.00 | 1.43 | 52.4 |
| 13–15 | 77695 | 0.050 | 0.004 | 0.046 | 3.9 | 0.30 | 3.58 | 78.0 |
| 15–17 | 133357 | 0.091 | 0.027 | 0.064 | 9.9 | 2.94 | 6.99 | 109.5 |
| 17–19 | 387044 | 0.288 | 0.068 | 0.220 | 41.0 | 9.63 | 31.37 | 142.4 |
| 19–21 | 317511 | 0.271 | 0.105 | 0.166 | 46.2 | 17.88 | 28.32 | 170.5 |
| 21–23 | 325420 | 0.325 | 0.112 | 0.214 | 63.1 | 21.62 | 41.48 | 193.8 |
| 23–25 | 411515 | 0.521 | 0.147 | 0.374 | 103.6 | 29.19 | 74.41 | 198.8 |
| 25–27 | 357909 | 0.630 | 0.163 | 0.467 | 114.7 | 29.63 | 85.07 | 182.1 |
| 27–29 | 218541 | 0.554 | 0.176 | 0.379 | 87.5 | 27.73 | 59.77 | 157.9 |
| 29–31 | 118497 | 0.430 | 0.131 | 0.299 | 58.4 | 17.75 | 40.65 | 135.9 |
| 31–33 | 84479 | 0.448 | 0.105 | 0.343 | 50.6 | 11.89 | 38.71 | 112.9 |
| 33–35 | 49432 | 0.432 | 0.029 | 0.403 | 35.5 | 2.40 | 33.10 | 82.2 |
| 35–37 | 19384 | 0.313 | 0.005 | 0.308 | 16.6 | 0.28 | 16.32 | 52.9 |
| 38plus | 7933 | 0.300 | 0.000 | 0.300 | 8.0 | 0.00 | 8.00 | 26.6 |
| Total | 3049461 | 645.8 | 171.3 | 474.58 | 1757.2 | |||
| Linf = 39.8 cm K = 0.24/year Terminal exploitation rate = 0.60 W = 0.017 L ^3.02 (g, cm) | ||||||||
3(d). Length cohort analysis of commercial catches of Oreochromis spp. in the south east arm of Lake Malawi, Aug. 1990–Jul 91.
| Length class(cm) | C | N | F | Y | B | |
| 3–5 | 0 | 44340000 | 0.000 | 0.0 | 13.8 | |
| 5–7 | 317740 | 40310000 | 0.033 | 1.3 | 40.6 | |
| 7–9 | 586018 | 36140000 | 0.064 | 5.7 | 87.8 | |
| 9–11 | 69769 | 31920000 | 0.008 | 1.3 | 159.3 | |
| 11–13 | 69030 | 28410000 | 0.008 | 2.2 | 258.9 | |
| 13–15 | 109417 | 25080000 | 0.014 | 5.5 | 386.0 | |
| 15–17 | 204553 | 21890000 | 0.028 | 15.3 | 547.4 | |
| 17–19 | 694319 | 19480000 | 0.099 | 73.6 | 739.9 | |
| 19–21 | 1026042 | 16690000 | 0.159 | 148.9 | 934.82 | |
| 21–23 | 1337729 | 13740000 | 0.234 | 258.0 | 1103.7 | |
| 23–25 | 1768301 | 10680000 | 0.371 | 442.3 | 1191.5 | |
| 25–27 | 1823378 | 7483166 | 0.492 | 579.4 | 1177.0 | |
| 27–29 | 1543264 | 4919024 | 0.576 | 612.1 | 1063.5 | |
| 29–31 | 972704 | 2839498 | 0.545 | 474.3 | 870.6 | |
| 31–33 | 698211 | 1509693 | 0.658 | 413.0 | 628.0 | |
| 33–35 | 346573 | 599168 | 0.708 | 245.8 | 347.3 | |
| 35–37 | 100681 | 154679 | 0.623 | 84.8 | 136.0 | |
| 38plus | 16268 | 21691 | 0.600 | 16.1 | 26.8 | |
| Total | 11683998 | 3379.5 | 9712.9 | |||
| Linf = 40.5 cm K = 0.23/year N = Population number Terminal exploitation rate = 0.75 W = 0.018 L ^3.00 (g, cm) | ||||||
3(e). Length cohort analysis of commercial catches of Oreochromis spp in Lake Malombe, Oct. 1990 –Sep. 1991.
| Length class(cm) | C | N | F | Y | B | |
| 3–5 | 16855 | 8395643 | 0.010 | 0.1 | 2.4 | |
| 5–7 | 74937 | 7698069 | 0.045 | 0.3 | 7.2 | |
| 7–9 | 668343 | 6962584 | 0.439 | 6.7 | 15.2 | |
| 9–11 | 1147889 | 5685267 | 0.914 | 21.9 | 24.0 | |
| 11–13 | 365533 | 4035097 | 0.358 | 11.9 | 33.4 | |
| 13–15 | 152308 | 3261240 | 0.166 | 7.9 | 47.2 | |
| 15–17 | 62009 | 2742985 | 0.072 | 4.7 | 66.2 | |
| 17–19 | 36047 | 2421710 | 0.043 | 3.9 | 91.76 | |
| 19–21 | 85139 | 2132445 | 0.104 | 12.7 | 121.4 | |
| 21–23 | 220773 | 1802287 | 0.297 | 43.6 | 146.9 | |
| 23–25 | 311619 | 1358160 | 0.515 | 79.7 | 154.7 | |
| 25–27 | 192301 | 865087 | 0.410 | 62.4 | 152.1 | |
| 27–29 | 144953 | 579087 | 0.387 | 58.7 | 151.8 | |
| 29–31 | 129474 | 359183 | 0.469 | 64.4 | 137.5 | |
| 31–33 | 85086 | 174438 | 0.504 | 51.3 | 101.9 | |
| 33plus | 38890 | 55557 | 0.467 | 28.0 | 60.2 | |
| Total | 3732156 | 458.3 | 1313.7 | |||
| Linf = 36.6 cm K = 0.29/year N = Population number Terminal exploitation rate = 0.70 W = 0.019 L ^2.99 (g, cm) C = Catch in numbers (average) Ftot = Total fishing mortality Fcf = Fishing mortality due to industrial fishery Ftf = Fishing mortality due to artisanal fishery Ytot = Total yield in tonnes Ycf = Yield in tonnes from industrial fishery Ytf = Yield in tonnes from artisanal fishery B = Average biomass in tonnes | ||||||
Table 4(a). Yield, Biomass and Value of Yield for O. lidole in the South East Arm of Lake Malawi
| XX-Factor | Ytotal (t) | Ycf (t) | Ytf (t) | Mean Biomass (t) | Value (MK,000) |
| 0.0 | 0 | 0 | 0 | 21164 | 0 |
| 0.2 | 1287 | 885 | 402 | 12012 | 2470 |
| 0.4 | 1566 | 1077 | 489 | 8856 | 3005 |
| 0.6 | 1632 | 1123 | 509 | 7286 | 3130 |
| 0.7 | MSY 1639 | 1127 | 512 | 6762 | 3142 MSE |
| 0.8 | 1637 | 1126 | 511 | 6340 | 3138 |
| 1.0 | 1621 | 1115 | 506 | 5696 | 3106 |
| 1.2 | 1598 | 1099 | 499 | 5221 | 3061 |
| Current production = 1621 t at XX = 1.0 Current biomass = 5696 t Current value = MK 3,106,000 Recruitment input = 22850000 fish from cohort analysis | |||||
4(b). Yield, Biomass and Value of Yield for O. squamipinnis in the South East Arm of Lake Malawi
| XX-Factor | Ytotal (t) | Ycf (t) | Ytf (t) | Mean Biomass (t) | Value (MK,000) |
| 0.0 | 0 | 0 | 0 | 15961 | 0 |
| 0.2 | 970 | 510 | 460 | 7769 | 1861 |
| 0.4 | 1180 | 620 | 560 | 4815 | 2264 |
| 0.6 | 1206 MSY | 634 | 572 | 3507 | 2312 MSE |
| 0.8 | 1184 | 622 | 562 | 2830 | 2264 |
| 1.0 | 1150 | 604 | 545 | 2430 | 2203 |
| 1.2 | 1116 | 586 | 530 | 2168 | 2137 |
| Current production = 1150 t at XX = 1.0 Current biomass = 2430 t Current value = MK 2,203,000 Recruitment input = 14460000 numbers | |||||
4(c). Yield, Biomass and Value of Yield for O. karongae in the South East Arm of Lake Malawi
| XX-Factor | Ytotal (t) | Ycf (t) | Ytf (t) | Mean Biomass (t) | Value (MK,000) |
| 0.0 | 0 | 0 | 0 | 10250 | 0 |
| 0.2 | 464 | 126 | 338 | 6026 | 889 |
| 0.4 | 619 | 167 | 452 | 3966 | 1184 |
| 0.6 | 662 | 179 | 483 | 2845 | 1265 |
| 0.7 | 665 MSY | 180 | 485 | 2472 | 1270 MSE |
| 0.8 | 662 | 179 | 483 | 2180 | 1263 |
| 1.0 | 646 | 174 | 471 | 1757 | 1230 |
| 1.2 | 624 | 169 | 455 | 1472 | 1188 |
| Current production = 646 t at XX = 1.0 Current biomass = 1757 t Current value = MK 1,230,000 Recruitment input = 9521825 numbers | |||||
4(d). Yield, Biomass and Value of Yield for Oreochromis spp in the South East Arm of Lake Malawi
| XX-Factor | Yield (t) | Mean Biomass (t) | Value (MK,000) |
| 0.0 | 0 | 46862 | 0 |
| 0.2 | 2648 | 26062 | 5081 |
| 0.4 | 3298 | 17908 | 6327 |
| 0.6 | 3447 | 13765 | 6609 |
| 0.7 | 3453 MSE | 12401 | 6620 MSE |
| 0.8 | 3439 | 11318 | 6592 |
| 1.0 | 3379 | 9713 | 6475 |
| 1.2 | 3304 | 8579 | 6327 |
| Current production = 3339 t at XX = 1.0 Current biomass = 9713 t Current value = MK 6,475,000 Recruitment input = 44340000 numbers | |||
5. Table of management options
Area: South East Arm
| Thompson and Bell prediction | Fo.1 target | |||
| Species | MSY (t) | XX | Target (t) | XX |
| O. lidole | 1639 | 0.7 | 1550 | 0.38 |
| O. squami. | 1206 | 0.6 | 1170 | 0.38 |
| O. karong. | 665 | 0.7 | 640 | 0.48 |
| Chambo | 3453 | 0.7 | 3280 | 0.38 |
XX = Multiplication factor of effort in relation to current effort (XX = 1.0)
Table 6. Optimum length (L50%) of Chambo caught in different mesh sizes of chambo exploiting commercial gears
| Gear | Mesh size (mm) | L50% (cm) |
| Chambo seine | 76 | 23.5 |
| 90 | 27.0 | |
| Kambuzi seine | 13 | 9.0 |
| 20 | 9.0 | |
| 25 | 12.0 | |
| Nkacha net | 13 | 7.0 |
| Chirimila net | 19 | 15.0 |
| 25 | 21.0 | |
| Gillnet | 64 | 18.1 |
| 76 | 21.3 | |
| 90 | 24.6 | |
| 102 | 27.4 | |
| 125 | 34.2 | |
| Pair trawl net | 38 | 22.0 |
| Midwater trawl net | 38 | 22.0 |
| Bottom trawl net | 38 | 22.0 |
| Ringnet | 102 | 27.5 |
Length converted catch curve for
O. lldole in the south east arm
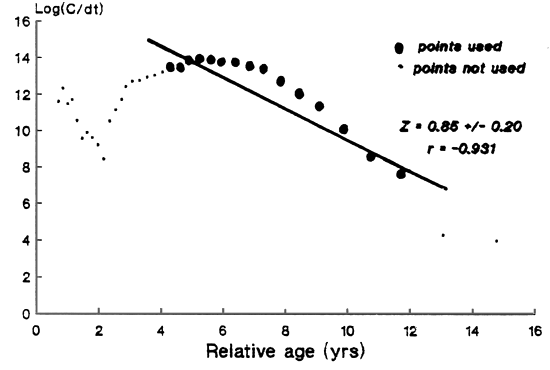
Figure 1a
Length converted catch curve for
O. squamipinnis in the south east arm
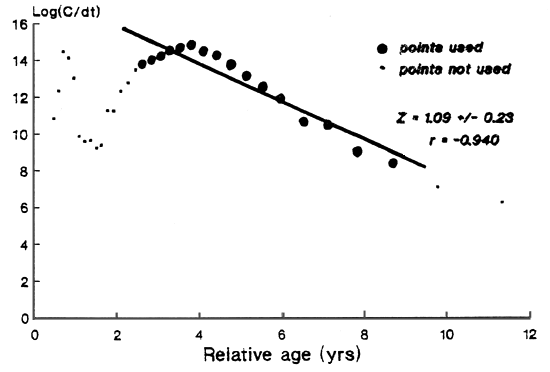
Figure 1b
Length converted catch curve for
O. karongae in the south east arm
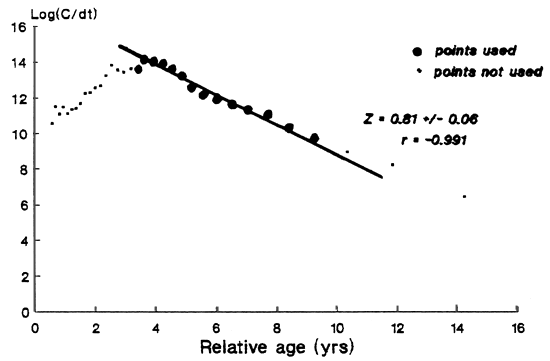
Figure 1c
Length converted catch curve for
Oreochromis spp in the south east arm
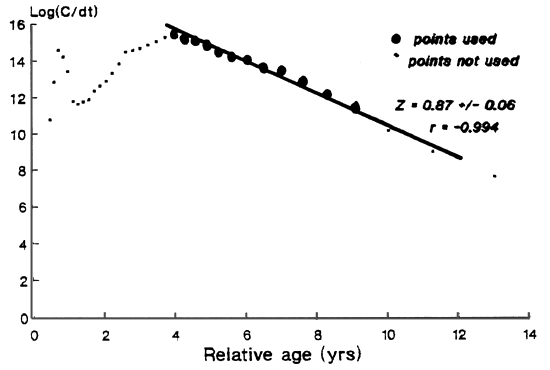
Figure 1d
Length converted catch curve for
Oreachromis spp in L. Malombe
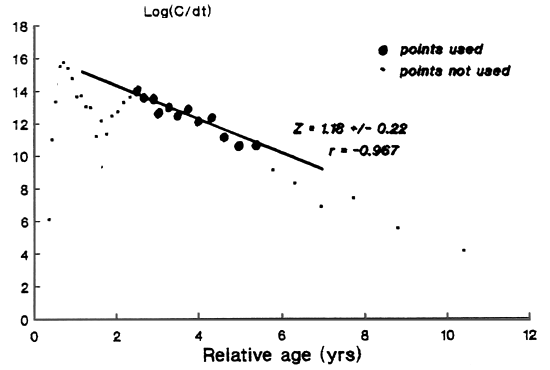
Figure 1e
Length cohort analysis of O. lidole
in the south east arm of Lake Malawi
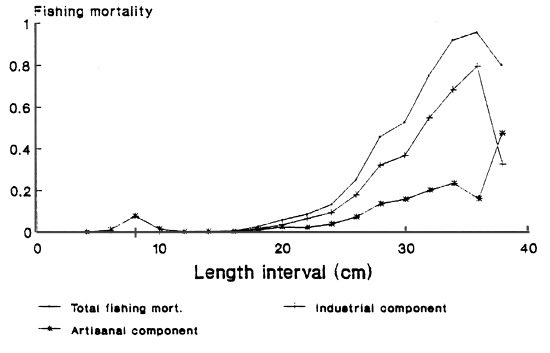
Figure 2a
Length cohort analysis of O. squamip.
in the south east arm of Lake Malawi
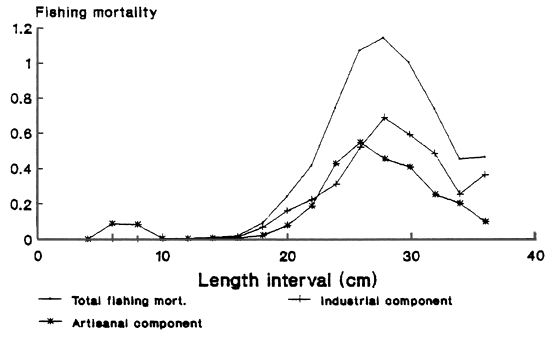
Figure 2b
Length cohort analysis of O. karongae
in the south east arm of Lake Malawi
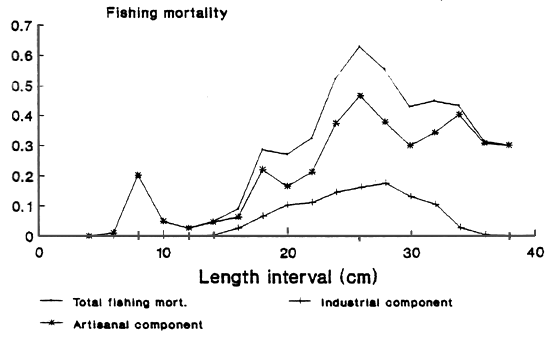
Figure 2c
Length cohort analysis of Oreochromis sp
in the south east arm of Lake Malawi
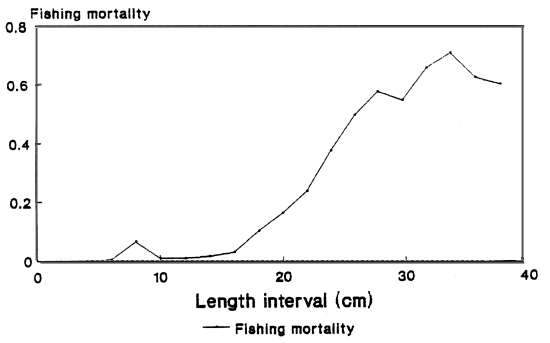
Figure 2d
Length cohort analysis of Oreochromis sp
in Lake Malombe
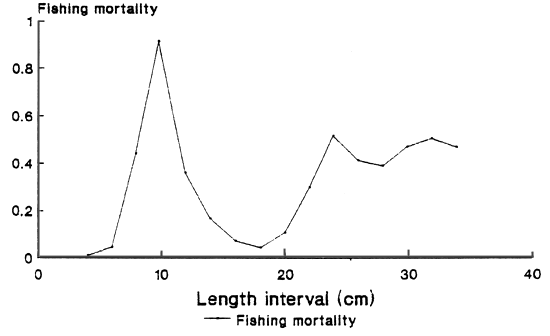
Figure 2e
Yield and biomass curves for
O. lidole in the south east arm
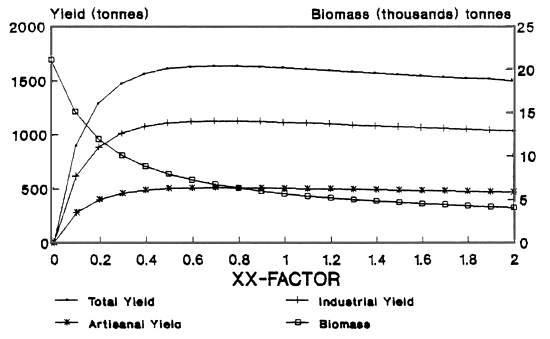
Figure 3a
Yield and biomass curves for
O. squamipinnis in the south east arm
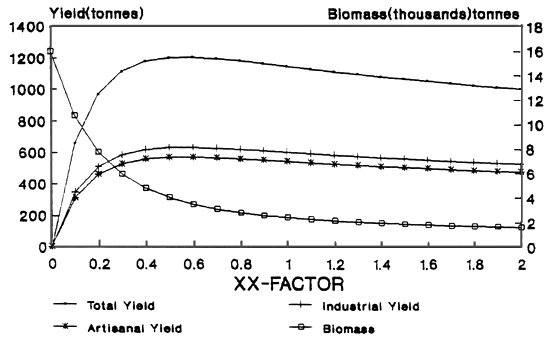
Figure 3b
Yield and biomass curves for
O. karongae in the south east arm
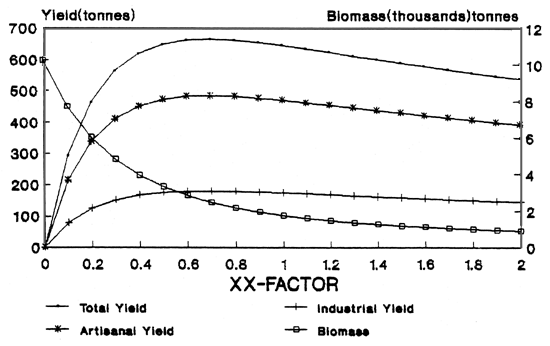
Figure 3c
Yield, value of yield and biomass curve
for Oreochromis sp in the south east arm
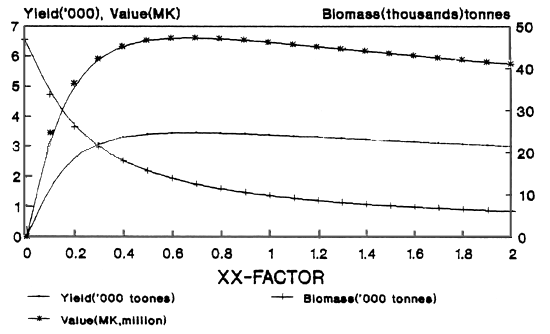
Figure 3d
Figure 4a-m. Mesh selection ogives in various Chambo exploiting gears.
 |  |
 |  |
 |  |
 |  |
 |  |
 |  |
I. Gill Net
Mesh Selection Ogives
LIST OF CHAMBO FISHERIES RESEARCH REPORTS
Field Documents
STATISTICAL AND COMPUTING ASPECTS IN DEVELOPING STATISTICAL SYSTEMS IN MALAWI by C. Stamatopoulos. Field Document 1, July 1989.
PREPARATION OF A BASELINE SURVEY OF THE ARTISANAL FISHERIES ON LAKE MALAWI by B. Horemans. Field Document 2, February 1990.
STATISTICAL AND COMPUTING ASPECTS OF THE CHAMBO FISHERIES by R. Mahon. Field Document 3, June 1990.
A DATABASE FOR THE TRADITIONAL CHAMBO FISHERIES STATISTICAL SURVEY by R. Mahon., S. Alimoso, C. Stamatopoulos, and N.P. van Zalinge. Field Document 4, June 1990.
FRAME SURVEY OF THE SOUTH EAST ARM OF LAKE MALAWI, THE UPPER SHIRE RIVER AND LAKE MALOMBE by S.B. Alimoso, M.B.D. Seisay, N.P. van Zalinge, M. Mdaihli and S. Donda. Field Document 5, July 1990.
AN EFFICIENT METHOD FOR CATCH-EFFORT SAMPLING OF THE ARTISANAL CHAMBO FISHERIES OF THE SOUTH EAST ARM OF LAKE MALAWI, THE UPPER SHIRE RIVER AND LAKE MALOMBE by S.B. Alimoso, M.B.D. Seisay and N.P. van Zalinge. Field Document 6, March 1991.
MTF - MALAWI TRADITIONAL FISHERIES, COMPUTER USER MANUAL by C. Stamatopoulos. Field Document 7, March 1991.
ESTIMATION OF CONVERSION FACTORS FOR CONTAINERS USED IN TRADITIONAL FISHERIES FOR CHAMBO by M.B.D. Seisay and J. Phiri. Field Document 8, July 1991.
PRELIMINARY NOTE ON THE DECLINE OF THE CHAMBO CATCHES IN LAKE MALOMBE by N.P. van Zalinge, S.B. Alimoso, S.J. Donda, M. Mdaihli, M.B.D. Seisay and G.F. Turner. Field Document 9, March 1991.
FISH MARKETING IN THE MANGOCHI AREA OF MALAWI by D.S. Liao. Field Document 10, November 1990.
FISHERMAN ENTERPRENEURS - A BASELINE SURVEY by M. Mdaihli and S. Donda. Field Document 11, July 1991.
THE ECONOMIC STATUS OF CREW MEMBERS by M. Mdaihli and S. Donda. Field Document 12, June 1991.
THE ROLE OF WOMEN IN CHAMBO FISHERIES by M. Mdaihli and S. Donda. Field Document 13, June 1991.
AN EVALUATION OF THE MALAWI CATCH ASSESSMENT SURVEY SYSTEM FOR TRADITIONAL FISHERIES by G.F. Turner, M.B.D. Seisay and N.P. van Zalinge. Field Document 14, March 1992.
VALIDITY CHECK IN CATCH EFFORT SAMPLING IN THE TRADITIONAL CHAMBO FISHERIES IN THE SOUTH-EAST ARM OF LAKE MALAWI, THE UPPER SHIRE RIVER AND LAKE MALOMBE by M.B.D. Seisay, H.J. Phiri and P.K. Mpezeni. Field Document 15, October 1991.
FISH MARKETING IN LAKE MALOMBE, THE UPPER SHIRE RIVER AND THE SOUTH-EAST ARM OF LAKE MALAWI by M. Mdaihli, M.M. Hara and M.C. Banda. Field Document 16, March 1992.
PROFITABILITY OF FISHING IN LAKE MALOMBE, THE UPPER SHIRE RIVER AND THE SOUTH-EAST ARM OF LAKE MALAWI by M. Mdaihli and S.J. Donda. Field Document 17, July 1992.
RELATIONSHIPS BETWEEN CHAMBO STOCKS OF LAKE MALOMBE, THE UPPER SHIRE RIVER AND LAKE MALAWI by M.B.D. Seisay, G.F. Turner and N.P. van Zalinge. Field Document 18, July 1992.
POPULATION DYNAMICS AND STOCK ESTIMATES OF CHAMBO (OREOCHROMIS SPP.) IN THE SOUTH-EAST ARM AND LAKE MALOMBE - LENGTH BASED APPROACH by M.B.D. Seisay, N.P. van Zalinge and G.F. Turner. Field Document 19, July 1992.
AGE AND GROWTH PARAMETERS OF CHAMBO (OREOCHROMIS SPP.) IN THE SOUTH-EAST ARM OF LAKE MALAWI, AS DETERMINED FROM OPERCULAR BONES by M.C. Banda. Field Document 20, July 1992.
DISTRIBUTION AND BIOLOGY OF CHAMBO (OREOCHROMIS SPP.) IN LAKES MALAWI AND MALOMBE by G.F. Turner and N.C. Mwanyama. Field Document 21, July 1992.
BIOECONOMIC MODELS FOR SOME OF THE FISHERIES OF SOUTHERN LAKE MALAWI by M. Mdaihli and G.F. Turner. Field Document 22, July 1992.
COMMERCIAL FISHERIES OF LAKE MALAWI by G.F. Turner. Field Document 23, July 1992.
PREDICTIVE MODEL FOR THE LAKE MALOMBE FISHERIES by N.P. van Zalinge, M. Mdaihli, G.F. Turner, and M.B.D. Seisay. Field Document 24, July 1992.
REPORT ON FISHERIES LEGISLATION IN MALAWI by A. van Houtte. Field Document 25, July 1992.
Technical Papers
FISHERIES MANAGEMENT IN THE SOUTH-EAST ARM OF LAKE MALAWI, THE UPPER SHIRE AND LAKE MALOMBE, WITH PARTICULAR REFERENCE TO THE FISHERIES ON CHAMBO (OREOCHROMIS SPP.). REPORT ON THE WORKSHOP HELD AT MANGOCHI, 8–11 JULY 1992. Technical Paper 1, August 1992.
Other Reports
IDENTIFICATION OF OREOCHROMIS SPECIES FROM LAKE MALAWI USING MITOCHONDRIAL DNA by D.M. Reid, R.N. Zaba and T.J. Pitcher, FAO, Rome 1990.
