Previous PageTable Of ContentsNext Page


Annex: Summary Sheets of Case Studies


Indonesia

1. Large-scale reduction in pesticide use in rice

Project:

National IPM Program

Year:

1993

Crop:

Rice

Level:

Self-evaluation by a project

Scope:

Immediate impact of training

Objective:

Evaluation of project influences on pesticide use

Methods:

  1. Tool: Semi-structured questionnaires by field trainers
  2. Design: Longitudinal comparison before and after training; 1-year time lag
  3. Parameters: Pesticide use (with various sub-parameters)
  4. Sample size: Very large (3335 individual farmers), from 7 provinces

Results:

  1. 61% reduction in insecticide applications due to training; reduction was highest for banned (class I and II) chemicals (Figure A-1)
  2. 70% increase reported for rodenticides
  3. 60% reduction in total pesticide expenditure
  4. Reported change in farmer pest management behavior from prevention-based to observation-based

Figure A-1. Mean pesticide applications per field, before and after training


Comments:

  1. Temporal changes in conditions could have influenced the before-after comparison, although price changes had been considered.
  2. Paired data involving the same respondents may to some extent have induced overstated or understated reporting.

Conclusion:

The Farmer Field School changed pest management behavior of farmers, resulting in better-informed decision-making and a clear overall reduction in the use of insecticides. In addition, increased awareness about the role of rats prompted trained farmers to spend more on rat control. The scale and coverage of the study suggested a convincing pattern. Unfortunately, the durability of training effects was not tested in this study, nor was a cost-benefit analysis included.

Source:

Monitoring and Evaluation Team (1993). The impact of IPM training on farmers’ behavior: A summary of results from the second field school cycle. IPM National Program, Indonesia


2. Detailed studies on community-level impact

Project:

National IPM Program

Year:

1997-98

Crop:

Various

Level:

Self-evaluation by a project

Scope:

Immediate & developmental impact of training

Objective:

Objective: To describe the development of spontaneous community programs

Background:

A national strategy was established in 1996 to integrate new project activities (in some places this meant intensification) in selected sub-districts with high potential for community-based IPM (approx. 10% of all project sub-districts). Project staff monitored the subsequent development of local programs with farmer-funded or locally funded non-project activities. National Program prioritized IPM sub-districts; however, project implementation in other project sub-districts was continued.

Methods:

  1. Tool: First-hand field visits and unstructured interviews by project staff and group discussions
  2. Design: Six IPM sub-districts of particular interest were selected for intensive case studies. A mix of quantitative and qualitative analytical frameworks (the latter describing the degree of participation, farmer relationships to their world, and social gains) were used to measure impact. The focus of study was at the community and village level, not at the farm level.
  3. Parameters: Mostly qualitative parameters, such as: roles, relationships, actions, reasons, social gains, policies; to some extent economics, pesticide sales and field-level variables
  4. Sample size: 6 IPM sub-districts from 6 separate provinces

Results:

  1. The case studies, with their quotations from farmers, provide a detailed description of local development processes that took place among FFS alumni groups, among larger farming communities and among other stakeholders and local government within sub-districts.
  2. Farmers reported strengthened relationships, group formation, and increased group cohesion, with an increase in frequency and regularity of meetings, and an improvement in quality of meetings involving more in-depth analysis of field conditions and group planning.
  3. Farmers reported improved skills of field observation, analysis and interpretation, skills of experimentation and improved field practices, and examples of innovations. Farmers also reported new skills to present data, to hold discussions and to make plans with budgets.
  4. Indications of increased critical thinking capacity to make independent analyses of situations, and increased self-confidence and awareness about positions and rights were recorded among farmers; for example, with FFS alumni testing or questioning government recommendations or countering pesticide promotions.
  5. An increased status was recorded for FFS alumni, who assumed new roles as consultants, planners and organizers, who became group leaders, or gained control over local funding.
  6. FFS training provided new opportunities to learn (e.g. through experimentation), to exchange knowledge (e.g. through new relationships or forums), to increase income (through new innovations or information, e.g. intercropping, hydroponics), and to take action (e.g. through rat control drives).
  7. An increase in leverage was reported that allowed farmers to reject certain rules (e.g. pesticide-inclusion in credit packages) to protest against inconsistencies in agricultural policies towards pesticides, to resist pressure (e.g. from pesticide salesmen), and to successfully negotiate their way (e.g. to obtain local funds for field activities).
  8. Farmers acquired access to government and agriculture officials to voice their concerns, and an access to official discussions regarding allocation of village funds or the planning of agricultural development.
  9. Several local policies were changed due to the efforts of FFS alumni, for example regarding the stocking of pesticides at cooperatives, and the channeling of village funds to support local agriculture.
  10. Anecdotal evidence suggested a diffusion effect of a reduced pesticide use in rice. Also, interviews with pesticide salesmen indicated a recent decline in sales.

Comments:

  1. Most of the information is qualitative and anecdotal. Hence, it is possible that the degree of impacts has been overstated.
  2. Locations had not been randomly selected.

Conclusion:

The case studies explained how local programs developed after project activities were introduced, how local people experienced a change in self-regard, status and leverage position, how these changes were translated into action, and how local government and agricultural officials became actively involved as supporters and sponsors.

Source:

FAO Technical Assistance Team (1998) Community IPM: Six cases from Indonesia. 260 pp.


3. The FFS triggers spontaneous local programs (sub-study of Case 2)

Project:

National IPM Program

Year:

1997-98

Crop:

Various

Level:

Self-evaluation by a project

Scope:

Immediate & developmental impact of training

Objective:

To describe the development of spontaneous community programs

Background:

This study was connected to Case 2.

Methods:

  1. Tool: First-hand field visits and interviews by project staff.
  2. Design: Extensive studies were conducted in a large number of IPM sub-districts; the occurrence of spontaneous (i.e. non-project) activities was recorded. The focus of study was at the community level, not at the farm level.
  3. Parameters: Non-project activities, degree of participation, relationships, social gains, policies, economics.
  4. Sample size: 182 IPM sub-districts in the nation’s major rice-growing areas.

Results:

  1. The study showed that spontaneous programs were commonplace. Spontaneous (i.e. farmer-funded or locally funded) activities were reported from all 182 IPM sub-districts. The available information was interpreted, categorized and summarized for the purpose of this summary, and is presented in Table A-1 and Figure A-2. Table A-1 shows the occurrence of as many as 62 types of spontaneous activities in 182 sub-districts. Field studies were found in practically every sub-district. Also, associations of alumni groups were reported from the majority of sub-districts. Collectively, the results indicate a wide variety of spontaneous activities, contributing to the natural, human, social, physical and financial assets of farming communities.
  2. Figure A-2 presents a snapshot of activities by IPM sub-district, showing spontaneous programs on all islands and illustrating the variation in the number of developmental impacts. Two to fourteen types of spontaneous activities were reported per IPM sub-district, roughly representing the state of progress. The graph further indicates that progressive IPM sub-districts were most common in West Java.
  3. The diversity of spontaneous activities was largely unrelated to the intensity of project-funded activities, as measured by the number of alumni. In other words, large training efforts did not automatically result in many types of spontaneous activities. Human factors (e.g. the motivation of the sub-district trainer) were likely important.

Table A-1. Spontaneous activities reported from 182 IPM sub-districts,
as extracted from the original information, with the number
and the percentage of sub-districts in each category.


Type of spontaneous activity

Asset

Sub-districts

Percentage

1

Field studies

Human

180

98.9%

2

Reactivating of alumni groups

Social

75

41.2%

3

Alumni association organized

Social

121

66.5%

4

Farmer trainer association organized

Social

35

19.2%

5

Farmer trainer monthly meetings

Social

20

11.0%

6

Information network created for farmers

Social

28

15.4%

7

Forums for sharing studies organized

Social

8

4.4%

8

Field observation teams organized

Social

23

12.6%

9

Meeting place for association constructed

Physical

9

4.9%

10

Areal planning organized

Natural

4

2.2%

11

Capitalize alumni groups; saving & loan program

Financial

32

17.6%

12

Capitalize association; saving & loan program

Financial

19

10.4%

13

Irrigation maintenance program organized

Natural

12

6.6%

14

Water users groups organized

Social

9

4.9%

15

Crop rotation schedule organized

Natural

7

3.8%

16

Pesticide-free rice produced

Natural

28

15.4%

17

Pesticide-free rice marketed

Financial

9

4.9%

18

Vegetable production project

Financial

6

3.3%

19

Pesticide-free vegetables produced

Natural

5

2.7%

20

Organic fertilizer project

Natural

2

1.1%

21

Seedling sales organized

Financial

9

4.9%

22

Inputs sales program organized

Financial

14

7.7%

23

Marketing project

Financial

3

1.6%

24

Labelled seed sales organized

Financial

7

3.8%

25

Innovative agronomic methods developed

Natural

9

4.9%

26

Non-toxic pest control methods tested

Natural

36

19.8%

27

Rats control methods tested

Natural

6

3.3%

28

Rat control program organized

Natl., social

61

33.5%

29

Stemborer control program organized

Natl., social

5

2.7%

30

Owl conservation/raising organized

Natural

3

1.6%

31

Apple snail control methods tested

Natural

13

7.1%

32

Apple snail control program organized

Natl., social

5

2.7%

33

Pesticide sales off, or kiosks reported partly closed

Natural

17

9.3%

34

Producing IPM calendars/bulletin boards

Social

6

3.3%

35

Regular newsletter by alumni/farmer trainers

Social

14

7.7%

36

Radio broadcast by alumni/farmer trainers

Social

5

2.7%

37

Traditional arts by alumni/farmer trainers

Social

12

6.6%

38

Demonstration field / promotional exhibition by alumni

Human

19

10.4%

39

Pest clinic or library established

Physical

2

1.1%

40

Rice-fish culture project

Natural

12

6.6%

41

Tractor cooperation organized

Physical

2

1.1%

42

Other income generating activities organized

Financial

2

1.1%

43

Miscellaneous activities

n/a

5

2.7%

44

Participatory planning training by farmers

Human

4

2.2%

45

Media training conducted

Human

0

0.0%

46

Farmers trained to conduct Vegetable FFS

Human

1

0.5%

47

Public school IPM organized by farmers

Human

3

1.6%

48

Forestry FFS with university

Human

1

0.5%

49

Local govt staff trained by farmer trainers

Human

3

1.6%

50

Farmers (co-) funding FFS

Financial

46

25.3%

51

Village owned lands given for IPM

Physical

8

4.4%

52

Village govt sponsors IPM activities

Financial

66

36.3%

53

(Sub-) District sponsors IPM activities

Financial

51

28.0%

54

Farmers reject policy on tungro because of alternative

Human

2

1.1%

55

Farmers reject instructions to plant var. IR64

Human

2

1.1%

56

Pesticides removed from village credit package, due to farmers’ protests

Human

33

18.1%

57

District policy to promote IPM

Financial

3

1.6%

58

District policy for stemborer, due to farmers

Natural

1

0.5%

59

Sub-district policy on FFS funding

Financial

3

1.6%

60

Policy on credit packages

Financial

1

0.5%

61

Crop rotation policy changed due to farmers

Human

6

3.3%

62

Sub-district policy authorizing trainers to change farmer groups

Social

1

0.5%

Figure A-2. The number of types of spontaneous activities in 182 IPM sub-districts,
arranged according to approximate geographical position, from West to East.


Comments:

  1. When attempting to capture the wealth of available information into superficial summaries, such as Table A-1 and Figure A-2, much structural and contextual information is lost.
  2. Most of the information is anecdotal.
  3. The selection of IPM sub-districts was biased.

Conclusion:

Substantial and widespread evidence from Indonesia suggests that FFS-related project activities provide an impetus for spontaneous local programs with multiple impacts. The diversity of activities is indicative of farmer creativity and situational differences.

Source:

FAO Technical Assistance Team (1998) Community IPM: Six cases from Indonesia. Annex I: IPM sub-district summaries, 54 pp.


4. Trends in pesticide sales in IPM areas (sub-study of Case 2)

Project:

National IPM Program

Year:

1997-98

Crop:

n/a

Level:

Self-evaluation by a project

Scope:

Developmental impact of training

Objective:

Impact of local IPM programs on pesticide sales

Methods:

  1. Tool: Yearly sales data per insecticide formula
  2. Design: Actual insecticide sales data were obtained directly from owners and managers of pesticide kiosks and village cooperatives operating within the boundaries of IPM sub-districts, i.e. areas selected by the program for intensified implementation of training and follow-up activities.
  3. Parameters: Yearly sales of insecticides by pesticide kiosks and village cooperatives; yearly number of sales outlets
  4. Sample size: One pesticide outlet in each of 8 IPM sub-districts; in one IPM sub-district the yearly number of sales outlets were recorded

Table A-2. Summary of changes in yearly sales data obtained from eight IPM sub-districts


Sales volume (litre)

Store

IPM sub-district

Province

Start of IPM

At onset

1997/8

Decline

"Toko tani"

Bantaeng

S.Sulawesi

1993

2555

535

79%

"Apik"

Tanah Merah

E.Java

1992

156

18

88%

"Bina Tani"

Bongas

W.Java

1990

2725

834

70%

5 stores combined

Tunjungan

C.Java

1993

1781

744

58%

Village coop.

Batang Toru

N.Sumatra

1993

1495

390

74%

Village coop.

Beringin

N.Sumatra

1992

5385

1132

79%

Petani Pestisida

Denpasar Timor

Bali

1992

2551

198

92%

Village coop.

Papar

E.Java

1994

85690

378

99%

Results:

  1. A considerable 70-99% reduction in insecticide sales by outlets in IPM sub-districts (Table A-2).
  2. The combined sales of all village cooperative units in Papar indicate a drastic decrease for the whole sub-district.
  3. From Bangorejo sub-district, a decline in the number of pesticide stores from 45 to 3 was reported between 1992 and 1998 (Figure A-3).

Figure A-3. Number of pesticide stores in Bangorejo sub-district, East Java.


Comments:

  1. The selection of pesticide kiosks was possibly biased towards those that were poorly performing. However, the data from Papar and Bangorejo represent entire sub-districts.
  2. The National trend in pesticide procurement (weight) for use in rice shows an increase from 1992-96 4, suggesting that the reported data reflect a localized effect associated with locally strong IPM programs.
  3. Reports from 12 additional IPM sub-districts provide anecdotal evidence suggesting that the decline in sales is common in IPM sub-districts.

Conclusion:

The reported cases indicate a clear association between strong local IPM programs a drastic reduction in pesticide sales.

Source:

FAO Technical Assistance Team (1998) Community IPM: Six cases from Indonesia. Annex II: The impact of IPM on pesticide sales in nine sub-districts; Annex I: IPM sub-district summaries.


5. Economic benefits of FFS training (sub-study of Case 2)

Project:

National IPM Program

Year:

1997-98

Crop:

Rice

Level:

Self-evaluation by a project

Scope:

Immediate impact of training

Objective:

To study the economic benefits of IPM training

Methods:

  1. Tool: Semi-structured questionnaires
  2. Design: Longitudinal comparison on farming practices before and after training obtained through recall data from FFS graduates. In addition, a small latitudinal comparison was made between FFS and non-FFS farmers. Only so-called “IPM sub-districts” were selected, i.e. sub-districts with local programs known to be more effective than average.
  3. Parameters: Pesticide applications, fertilizers, input costs, yield, financial benefits
  4. Sample size: Large; 334 farmers, taken from 13 IPM sub-districts on Java, Bali and Sulawesi. The latitudinal comparison involved 20 FFS farmers and 20 non-FFS farmers from 2 IPM sub-districts on Sulawesi.

Results:

  1. Pooled data on pesticide use before and after training suggest a drastic decline from 2.8 to 0.02 applications per season.
  2. The reported yield increase after training (from pooled data) was 21% or 1.04 t/ha
  3. After training farmers spent 50% more on fertilizers, mainly due to an increase in KCl, ZA and, to a limited extent, TSP. This indicates a more balanced use of fertilizers.
  4. Partial budgets indicate increased benefits after training ranging from 39,000 to 1,400,000 (Rp ha-1) per IPM sub-district (pooled average is 473,000).
  5. The graph below illustrates that increased outputs contributed most to farmer income; reduced pesticide expenditure accounted for 14% of the increased benefits after training.
  6. The latitudinal comparison between FFS and non-FFS farmers showed a 24% increase in yield and Rp 628,000 increased benefits per ha.

Comments:

  1. Recall data introduce error when respondents don’t remember accurately about past events. Moreover, when respondents provide paired data from before and after training, this may cause over-reporting.
  2. The latitudinal comparison between FFS and non-FFS farmers provides an independent check, although the rather small sample size and lack of information on selection of farmers introduce new sources of error.
  3. By selecting only IPM sub-districts, i.e. the sub-districts with most promising local programs, the sample may not be representative for the national program.

Figure A-4. Pooled average chemical inputs and outputs before and after training in 1998 Rupees.


Conclusion:

Despite possible bias in recall data and respondent selection, the reported effects on pesticide reduction, balanced fertilizer use and yield were large and were found across the board. Figure A-4 indicates that the cost-benefit analysis was mostly determined by a change in yield.

Source:

FAO Technical Assistance Team (1998) Community IPM: Six cases from Indonesia. Annex III: Financial benefits realized by IPM alumni due to their application of IPM principles.


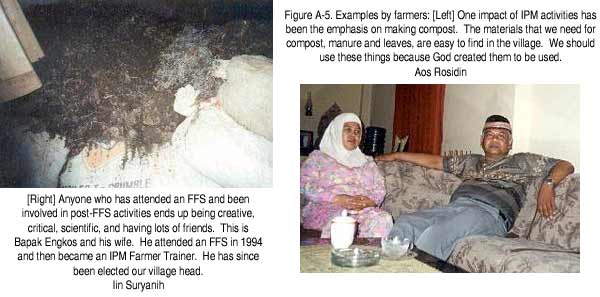
6. Farmers picturing impact

Project:

Project: Indonesian IPM Farmers Association; FAO Programme for Community IPM in Asia

Year:

2001

Crop:

Various

Level:

Self-evaluation by farmers

Scope:

Scope: Immediate & developmental impact of training

Objective:

Study the impact of community IPM on poverty / providing farmers with opportunity to evaluate and plan

Methods:

  1. Tool: Photo reportage; writing captions; group discussions
  2. Design: One village from each of three sub-districts that had received a concentration of program activities. 5 IPM-farmers per village were introduced to methods of self-evaluation. Workshops before and after data collection enable farmers to analyze the impact on poverty based on their own criteria.
  3. Parameters: Specified by participants; any immediate or developmental impacts of training
  4. Sample size: 5 participants from each of 3 villages in West Java

Results:

  1. A variety of data in the form of a photo-reportage and accompanying captions described how FFS graduates continued to apply IPM learning principles to new areas of farming (illustrated in Figure A-5). The number of impacts per village suggests that active local programs developed after training.
  2. Some examples of impacts are: Innovative ways of producing, utilizing and applying organic manure, the production of rice seed, and the initiation of growing alternative crops or developing various income-generating activities, all resulting in a diversification of agroecosystems and income sources.
  3. Farmers recorded social gains, and how impacts of the FFS influenced non-participants in the village, e.g. through advocacy causing improved irrigation conditions, or through following innovative agricultural practices of FFS graduates.
  4. In general terms, farmers concluded that community IPM activities had led to greater creativity, more independence, lowered costs and improved incomes.
  5. By analyzing the effect of training on the causes of poverty, farmers reported increased opportunities for all members of the community to learn, a more balanced diet through agricultural diversification, increased scope for on-farm work, improved living conditions, an enhanced self-regard and reduced discrimination.

Comments:

Even though the study draws predominantly on qualitative data, some of which may be over-stated for competitive reasons, the strength of this approach is that it reveals a broad range of impacts of training, normally missed in externally-planned evaluations.

Conclusion:

According to the primary stakeholders of IPM, and captured through their photographs, the FFS has set in motion the development of active local programs resulting in advocacy, innovations and adaptive management of farming systems. Participatory evaluations like this enrich our understanding of how the FFS enables local communities to become a factor in development.

Source:

J.C. Pontius (2003) Picturing impact: participatory evaluation of community IPM in three West Java villages. International learning workshop on farmers’ field schools: Emerging issues and challenges. Yogyakarta, Indonesia, 21-25 October 2002.


7. SEARCA study on farm-level outcomes

Project:

National IPM Program

Year:

1999

Crop:

Rice (with limited data on soybean)

Level:

External evaluation

Scope:

Immediate impact of training

Objective:

To evaluate the impact of the project in rice-based farming communities

Methods:

  1. Tool: Structured questionnaires, semi-structured interviews.
  2. Design: Latitudinal comparison between FFS farmers and non-FFS farmers. The time passed between training and the survey was not considered.
  3. Parameters: Insecticide volume, yield, knowledge, practices
  4. Sample size: (i) Rice: 627 FFS farmers and 380 non-FFS farmers; (ii) soybean: 69 FFS farmers and 49 non-FFS farmers. Sample size per province reflected the number of FFS alumni per province. Collectively, the rice and soybean farmers were selected from 233 FFS villages and 52 non-FFS villages, and villages were selected from 6 provinces.

Figure A-6. Insecticide use (l ha-1) and yield (t ha-1) of rice by FFS farmers and non-FFS farmers.


Results:

  1. Use of four insecticides was 35% less for FFS farmers than for non-FFS farmers (recalculated from data pooled per province) (Figure A-6). In both groups, insecticide use was low (1.1 and 1.6 l ha-1, resp.). Spray frequencies are unknown.
  2. Yield of rice was 7.9 % higher for FFS farmers than for non-FFS farmers in the 6 provinces (recalculated from pooled data, and omitting unspecified data from East and West Java), however, the variation in yield advantage between provinces was large (-8% to +28%); for soybean, yield advantage was 28%.
  3. The use of carbofuran, which was the predominant insecticide in earlier studies, was zero in both groups of farmers. This could possibly be interpreted as a long-term impact of the program.
  4. FFS farmers spent 21% less on pesticides, 12% more on fertilizers and 4% more on labor than non-FFS farmers (recalculated from pooled data). In total FFS farmers had 5% lower production costs than non-FFS farmers. However, this cost difference was small compared to the difference in revenue from harvested produce, which was highest for FFS farmers due to higher yield. A high internal rate of return was recorded.
  5. FFS farmers had higher knowledge scores on pests, natural enemies and pesticides than non-FFS farmers.
  6. Balanced use of fertilizers and composting was marginally higher in FFS farmers.

Comments:

  1. Data are reported for only four insecticides, one of which an insect growth regulator. This selection possibly masked a difference in use of total pesticides, including chemicals not allowed in rice.
  2. The report mentioned that non-FFS villages were selected which had “the same agro-climatic factors” as FFS villages, and moreover, that non-FFS farmers were selected who had “the same characteristics” as FFS farmers. However, no information is provided to prove that the two groups were comparable.
  3. The sample under-represented the program‘s efforts on Java.
  4. The cost-benefit analysis (both, of farm-level returns and project rates of return), depended largely on the data on yield (production costs were relatively minor). However, a high degree of variation is visible in the yield advantage between provinces, which weakens the cost-benefit analysis. Moreover, the figure on average yield advantage used in the report (10.7%, compared to 7.9% for the recalculated value) is based on the average of each province, without weighing each province’s contribution, and also includes data on 2 provinces not part of the original study as described in the methods.
  5. The time passed between training and the survey was not considered, which may have affected the data.

Conclusion:

A modest reduction in insecticide use and an increase in knowledge and improved practices were attributed to the effect of training. Also, there were indications of an important yield advantage due to training.

Source:

SEARCA (1999) Integrated Pest Management Training Project, World Bank Loan 3586-IND: Impact Evaluation Study. Final Report, prepared for the Ministry of Agricultural, Indonesia, and the World Bank. SEAMEO Regional Center for Graduate Study and Research in Agriculture, Laguna, Philippines, 168 pp.


8. World Bank study on long-term farm-level outcomes

Project:

National IPM Program

Year:

2002

Crop:

Rice

Level:

External evaluation

Scope:

Immediate impact of training

Objective:

To evaluate the impact of FFS training and diffusion on farm-level outcomes

Methods:

  1. Tool: Econometric difference-in-differences analysis based on (i) data collected by CASER, Bogor, through structured questionnaires in 1991 and (ii) a partially retrospective study in 1999.
  2. Design: Longitudinal and latitudinal comparison of data collected in 1991 (i.e. a variable number of years before training) and 1999 (variable number of years after training) in three groups of farmer households: non-FFS, exposed to IPM (i.e. FFS in the village but did not participate) and FFS households.
  3. Parameters: “Growth rate” of pesticide expenditure and yield.
  4. Sample size: 52 non-FFS households from 5 villages (pseudo-replicated), 156 households exposed to IPM and 112 FFS households (both groups mixed from 21 villages; pseudo-replicated).

Figure A-7. Shift in pesticide expenditure (in ‘000s of 1998 Rp/ha) over nine years
for non-FFS farmers, exposed farmers and FFS farmers.

\

Results:

  1. Yields decreased from 1991-99 for all comparison groups.
  2. Pesticide expenditure (corrected for inflation) increased for all comparison groups (Figure A-7). Spray volumes or frequencies are unknown.
  3. The multivariate analysis showed no significant effect of training on the change in yield or pesticide expenditure between comparison groups.

Comments:

  1. The distinction between target group and control group may have been biased because of retrospective questions in 1999 going back up to 8 years in farmer memory and because of the risk of confusing genuine IPM-FFS with other training programs.
  2. The study depended on, and extrapolated from, a small control group (5 villages as true replications) with substantially different conditions from the target group. Roughly, a comparison was made between (i) FFS farmers with predominantly irrigated fields, and (ii) non-FFS farmers with largely rainfed fields and with on average only half the land area. The group of exposed farmers had intermediate conditions.
  3. To deal with this flaw in the available data, the difference in slope of pesticide expenditure and yield before and after training was studied. Thus, a steeper increase in yield indicated more impact, irrespective of the initial yield level. By eliminating the intercept, incorporating pre-program growth rate estimates, and including certain household, village and district variables into the regression, it was assumed that situational differences between the comparison groups were accounted for. Despite the multivariate analysis, however, the low R˛ values in the results indicated that the bulk of variation remained unexplained, suggesting that other, non-measured, parameters were important in comparing the dissimilar groups.
  4. A related problem when choosing growth, instead of level, as the object of study is that the influence of limiting factors or ceiling-levels (likely to differ between the comparison groups) is ignored. This is important because of the long time span of the study.
  5. The economic crisis in 1998/1999 and its high inflation rate was another source of error. Low spending power due to the crisis may have suppressed differential pesticide use among treatment groups. Moreover, pesticide use was only expressed in terms of expenditure. From 1997-98, national pesticide sales increased with about 170% when expressed in Rupiah, but declined with about 20% when expressed in US dollar5. To interpret the data on expenditure, further information on actual price changes is needed, as there are indications that the price increase for pesticides was higher than the Consumer Price Index used in this study. Hence, pesticide use has likely been overestimated.
  6. Pesticide use expressed in terms of expenditure could conceal a shift from hazardous chemicals (OC’s, OP’s) to less hazardous ones (growth regulators, pyrethroids), or a shift from insecticides to fungicides or herbicides. Therefore, the suggested linear relationship between pesticide expenditure and health or environmental benefits remains unproven.

Conclusion:

The study attempted to find a solution for the problem of non-identical treatment groups in a longer-term study. It reported no significant impact on pesticide expenditure and yield. However, small sample size and large unexplained variance in the analysis produced results which are difficult to interpret, as discussed above. Moreover, the results are not consistent with those of other studies. The choice of the economic crisis period 1998/1999 as the only reference point to measure impact introduced another source of error.

Source:

G. Feder, R. Murgai & J.B. Quizon (2003) Sending farmers back to school: The impact of Farmer Field Schools in Indonesia. Accepted by Review of Agricultural Economics.


4 J.H.M. Oudejans (1999) Studies on IPM policy in S.E. Asia: Two centuries of plant protection in Indonesia, Malaysia and Thailand. Wageningen University Agricultural Papers, 99.1. p. 229.
5 S. Watkins (2003) The world market for crop protection products in rice. Agrow Report, PJB Publications, London.


Previous PageDébut de pageNext Page