![]()
![]()
![]()
|
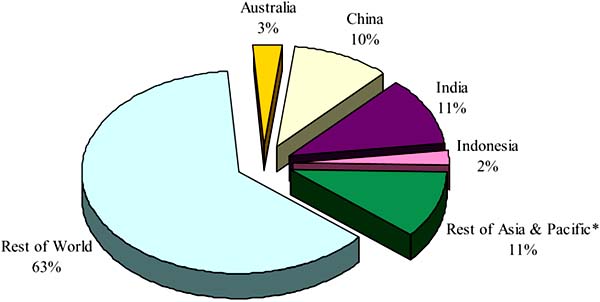
Countries in Asia-Pacific region with largest area of agricultural land in 2002
|
|
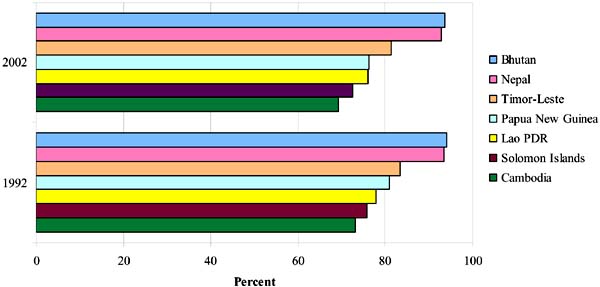
Countries in Asia-Pacific region with largest percentage of agricultural population in 2002
|
Unit: 1000 ha
|
Country |
Total |
Arable and |
Permanent |
Forests |
Other Land |
Land Use Distribution (in %) |
|||
|
Arable & |
Permanent Pasture |
Forests & |
Other |
||||||
|
DEVELOPING COUNTRIES |
|||||||||
|
SOUTHEAST ASIA |
|
|
|
|
|
|
|
|
|
|
1. Cambodia |
17 652 |
3 807 F |
1 500 F |
9 335 |
3 010 |
21.6 |
8.5 |
52.9 |
17.1 |
|
2. Indonesia |
181 157 |
33 700 F |
11 177 F |
104 986 |
31 294 |
18.6 |
6.2 |
58.0 |
17.3 |
|
3. Lao PDR |
23 080 |
1 001 F |
878 F |
12 561 |
8 640 |
4.3 |
3.8 |
54.4 |
37.4 |
|
4. Malaysia |
32 855 |
7 585 F |
285 F |
19 292 |
5 693 |
23.1 |
0.9 |
58.7 |
17.3 |
|
5. Myanmar |
65 755 |
10 611 |
314 F |
34 419 |
20 411 |
16.1 |
0.5 |
52.3 |
31.0 |
|
6. Philippines |
29 817 |
10 700 F |
1 500 F |
5 789 |
11 828 |
35.9 |
5.0 |
19.4 |
39.7 |
|
7. Thailand |
51 089 |
19 367 F |
800 F |
14 762 |
16 160 |
37.9 |
1.6 |
28.9 |
31.6 |
|
8. Timor-Leste |
1 487 |
137 F |
150 F |
507 |
693 |
9.2 |
10.1 |
34.1 |
46.6 |
|
9. Viet Nam |
32 549 |
8 895 F |
642 F |
9 819 |
13 193 |
27.3 |
2.0 |
30.2 |
40.5 |
|
SOUTH ASIA |
|
|
|
|
|
|
|
|
|
|
10. Bangladesh |
13 017 |
8 429 |
600 F |
1 334 |
2 654 |
64.8 |
4.6 |
10.2 |
20.4 |
|
11. Bhutan |
4 700 |
165 F |
415 F |
3 016 |
1 104 |
3.5 |
8.8 |
64.2 |
23.5 |
|
12. India |
297 319 |
170 115 F |
11 062 F |
64 113 |
52 029 |
57.2 |
3.7 |
21.6 |
17.5 |
|
13. Maldives |
30 |
12 F |
1 F |
1 |
16 |
40.0 |
3.3 |
3.3 |
53.3 |
|
14. Nepal |
14 300 |
3 294 F |
1 737 |
3 900 |
5 369 |
23.0 |
12.1 |
27.3 |
37.5 |
|
15. Pakistan |
77 088 |
22 120 |
5 000 F |
2 361 |
47 607 |
28.7 |
6.5 |
3.1 |
61.8 |
|
16. Sri Lanka |
6 463 |
1 916 |
440 F |
1 940 |
2 167 |
29.6 |
6.8 |
30.0 |
33.5 |
|
CENTRAL ASIA |
|
|
|
|
|
|
|
|
|
|
17. Kazakhstan |
269 970 |
21 671 F |
185 098 F |
12 148 |
51 053 |
8.0 |
68.6 |
4.5 |
18.9 |
|
18. Tajikistan |
14 060 |
1 057 F |
3 198 |
400 |
9 405 |
7.5 |
22.7 |
2.8 |
66.9 |
|
19. Uzbekistan |
41 424 |
4 827 |
22 219 |
1 969 |
12 409 |
11.7 |
53.6 |
4.8 |
30.0 |
|
OTHER ASIA |
|
|
|
|
|
|
|
|
|
|
20. Afghanistan |
65 209 |
8 054 F |
30 000 |
1 351 |
25 804 |
12.4 |
46.0 |
2.1 |
39.6 |
|
21. China |
932 742 |
153 956 F |
400 001 F |
163 480 |
215 305 |
16.5 |
42.9 |
17.5 |
23.1 |
|
22. DPR Korea |
12 041 |
2 700 F |
50 F |
8 210 |
1 081 |
22.4 |
0.4 |
68.2 |
9.0 |
|
23. Iran (Islamic Rep. of) |
163 620 |
17 088 F |
44 000 F |
7 299 |
95 233 |
10.4 |
26.9 |
4.5 |
58.2 |
|
24. Mongolia |
156 650 |
1 200 F |
129 300 F |
10 645 |
15 505 |
0.8 |
82.5 |
6.8 |
9.9 |
|
25. Rep. of Korea |
9 873 |
1 877 |
56 |
6 248 |
1 692 |
19.0 |
0.6 |
63.3 |
17.1 |
|
PACIFIC ISLANDS |
|
|
|
|
|
|
|
|
|
|
26. Cook Islands** |
23 |
6 F |
0 |
16 |
1 |
26.1 |
0.0 |
69.6 |
4.3 |
|
27. Fiji Islands |
1 827 |
285 F |
175 F |
815 |
552 |
15.6 |
9.6 |
44.6 |
30.2 |
|
28. Kiribati |
73 |
39 F |
0 |
28 |
6 |
53.4 |
0.0 |
38.4 |
8.2 |
|
29. Marshall Islands |
18 |
10 F |
4 F |
0 |
4 |
55.6 |
22.2 |
0.0 |
22.2 |
|
30. Micronesia, Fed States of |
70 |
36 F |
11 F |
15 |
8 |
51.4 |
15.7 |
21.4 |
11.4 |
|
31. Nauru |
2 |
0 |
0 |
0 |
2 |
0.0 |
0.0 |
0.0 |
100.0 |
|
32. Niue |
26 |
7 F |
1 F |
6 |
12 |
26.9 |
3.8 |
23.1 |
46.2 |
|
33. Palau |
46 |
6 F |
3 F |
35 |
2 |
13.0 |
6.5 |
76.1 |
4.3 |
|
34. Papua New Guinea |
45 286 |
870 F |
175 F |
30 601 |
13 640 |
1.9 |
0.4 |
67.6 |
30.1 |
|
35. Samoa |
283 |
129 |
2 |
105 |
47 |
45.6 |
0.7 |
37.1 |
16.6 |
|
36. Solomon Islands |
2 799 |
75 F |
40 F |
2 536 |
148 |
2.7 |
1.4 |
90.6 |
5.3 |
|
37. Tonga |
72 |
48 F |
4 F |
4 |
16 |
66.7 |
5.6 |
5.6 |
22.2 |
|
38. Tuvalu |
3 |
0 |
0 |
0 |
3 |
0.0 |
0.0 |
0.0 |
100.0 |
|
39. Vanuatu |
1 219 |
120 F |
42 F |
447 |
610 |
9.8 |
3.4 |
36.7 |
50.0 |
|
SUB-TOTAL |
2 565 694 |
515 915 |
850 880 |
534 499 |
664 400 |
20.1 |
33.2 |
20.8 |
25.9 |
|
DEVELOPED COUNTRIES |
|||||||||
|
40. Australia |
768 230 |
48 600 F |
398 400 F |
154 539 |
166 691 |
6.3 |
51.9 |
20.1 |
21.7 |
|
41. Japan |
36 450 |
4 762 |
428 |
24 081 |
7 179 |
13.1 |
1.2 |
66.1 |
19.7 |
|
42. New Zealand |
26 799 |
3 372 F |
13 863 |
7 946 |
1 618 |
12.6 |
51.7 |
29.7 |
6.0 |
|
SUB-TOTAL |
831 479 |
56 734 |
412 691 |
186 566 |
175 488 |
6.8 |
49.6 |
22.4 |
21.1 |
|
ASIA & PACIFIC* |
3 397 174 |
572 649 |
1 263 571 |
721 065 |
839 889 |
16.9 |
37.2 |
21.2 |
24.7 |
|
REST OF WORLD |
9 669 768 |
961 817 |
2 221 768 |
3 147 731 |
3 338 452 |
9.9 |
23.0 |
32.6 |
34.5 |
|
WORLD |
13 066 940 |
1 534 466 |
3 485 339 |
3 868 796 |
4 178 339 |
11.7 |
26.7 |
29.6 |
32.0 |
* data for forests and woodland, from the Global Forest Resources Assessment of 2000, is sum of natural forest and plantations.
** land in compact plantation separated from forests and woodland
Unit: 1000 ha
|
Country |
Total Land Area |
Agricultural Land |
Agricultural Land as % of Total Land |
||
|
1992 |
2002 |
1992 |
2002 |
||
|
DEVELOPING COUNTRIES |
|||||
|
SOUTHEAST ASIA |
|
|
|
|
|
|
1. Cambodia |
17 652 |
3 800 F |
3 807 F |
21.5 |
21.6 |
|
2. Indonesia |
181 157 |
29 551 F |
33 700 F |
16.3 |
18.6 |
|
3. Lao PDR |
23 080 |
864 F |
1 001 F |
3.7 |
4.3 |
|
4. Malaysia |
32 855 |
7 395 F |
7 585 F |
22.5 |
23.1 |
|
5. Myanmar |
65 755 |
10 039 |
10 611 |
15.3 |
16.1 |
|
6. Philippines |
29 817 |
9 900 F |
10 700 F |
33.2 |
35.9 |
|
7. Thailand |
51 089 |
20 574 |
19 367 F |
40.3 |
37.9 |
|
8. Timor-Leste |
1 487 |
130 F |
137 F |
8.7 |
9.2 |
|
9. Viet Nam |
32 549 |
6 697 |
8 895 F |
20.6 |
27.3 |
|
SOUTH ASIA |
|
|
|
|
|
|
10. Bangladesh |
13 017 |
8 328 |
8 429 |
64.0 |
64.8 |
|
11. Bhutan |
4 700 |
135 F |
165 F |
2.9 |
3.5 |
|
12. India |
297 319 |
169 270 F |
170 115 F |
56.9 |
57.2 |
|
13. Maldives |
30 |
8 F |
12 F |
26.7 |
40.0 |
|
14. Nepal |
14 300 |
2 423 F |
3 294 F |
16.9 |
23.0 |
|
15. Pakistan |
77 088 |
21 060 |
22 120 |
27.3 |
28.7 |
|
16. Sri Lanka |
6 463 |
1 905 F |
1 916 |
29.5 |
29.6 |
|
CENTRAL ASIA |
|
|
|
|
|
|
17. Kazakhstan |
269 970 |
35 201 |
21 671 F |
13.0 |
8.0 |
|
18. Tajikistan |
14 060 |
985 F |
1 057 F |
7.0 |
7.5 |
|
19. Uzbekistan |
41 424 |
4 854 |
4 827 |
11.7 |
11.7 |
|
OTHER ASIA |
|
|
|
|
|
|
20. Afghanistan |
65 209 |
8 054 F |
8 054 F |
12.4 |
12.4 |
|
21. China |
932 742 |
131 783 F |
153 956 F |
14.1 |
16.5 |
|
22. DPR Korea |
12 041 |
2 480 F |
2 700 F |
20.6 |
22.4 |
|
23. Iran (Islamic Rep. of) |
163 620 |
18 500 |
17 088 F |
11.3 |
10.4 |
|
24. Mongolia |
156 650 |
1 363 |
1 200 F |
0.9 |
0.8 |
|
25. Rep. of Korea |
9 873 |
2 070 |
1 877 |
21.0 |
19.0 |
|
PACIFIC ISLANDS |
|
|
|
|
|
|
26. Cook Islands |
23 |
5 |
6 F |
21.7 |
26.1 |
|
27. Fiji Islands |
1 827 |
260 F |
285 F |
14.2 |
15.6 |
|
28. Kiribati |
73 |
39 F |
39 F |
53.4 |
53.4 |
|
29. Marshall Islands |
18 |
- |
10 F |
- |
55.6 |
|
30. Micronesia, Fed States of |
70 |
- |
36 F |
0.0 |
51.4 |
|
31. Nauru |
2 |
0 |
0 |
0.0 |
0.0 |
|
32. Niue |
26 |
7 F |
7 F |
26.9 |
26.9 |
|
33. Palau |
46 |
- |
6 F |
- |
13.0 |
|
34. Papua New Guinea |
45 286 |
782 F |
870 F |
1.7 |
1.9 |
|
35. Samoa |
283 |
122 F |
129 |
43.1 |
45.6 |
|
36. Solomon Islands |
2 799 |
72 F |
75 F |
2.6 |
2.7 |
|
37. Tonga |
72 |
48 F |
48 F |
66.7 |
66.7 |
|
38. Tuvalu |
3 |
0 |
0 |
0.0 |
0.0 |
|
39. Vanuatu |
1 219 |
120 F |
120 F |
9.8 |
9.8 |
|
SUB-TOTAL |
2 565 694 |
498 824 |
515 915 |
19.4 |
20.1 |
|
DEVELOPED COUNTRIES |
|||||
|
40. Australia |
768 230 |
47 378 F |
48 600 F |
6.2 |
6.3 |
|
41. Japan |
36 450 |
5 165 F |
4 762 |
14.2 |
13.1 |
|
42. New Zealand |
26 799 |
3 460 |
3 372 F |
12.9 |
12.6 |
|
SUB-TOTAL |
831 479 |
56 003 |
56 734 |
6.7 |
6.8 |
|
ASIA & PACIFIC* |
3 397 174 |
554 827 |
572 649 |
16.3 |
16.9 |
|
REST OF WORLD |
9 669 768 |
951 075 |
961 817 |
9.8 |
9.9 |
|
WORLD |
13 066 940 |
1 505 902 |
1 534 466 |
11.5 |
11.7 |
** "Agricultural Land" as used in this publication refers to "Arable and Permanent Cropped Land", which excludes permanent meadows and pastures, fallow and resulting from shifting cultivation, and land under trees grown for food or timber. Double cropped areas are counted only once.
Unit: 1000
|
Country |
Total Population |
Agricultural Population |
% Agricultural Population |
|||
|
1992 |
2002 |
1992 |
2002 |
1992 |
2002 |
|
|
DEVELOPING COUNTRIES |
||||||
|
SOUTHEAST ASIA |
|
|
|
|
|
|
|
1. Cambodia |
10 437 |
13 810 |
7 633 |
9 572 |
73.1 |
69.3 |
|
2. Indonesia |
188 260 |
217 131 |
93 263 |
92 877 |
49.5 |
42.8 |
|
3. Lao PDR |
4 350 |
5 529 |
3 384 |
4 209 |
77.8 |
76.1 |
|
4. Malaysia |
18 817 |
23 965 |
4 549 |
3 909 |
24.2 |
16.3 |
|
5. Myanmar |
41 927 |
48 852 |
30 467 |
33 995 |
72.7 |
69.6 |
|
6. Philippines |
63 989 |
78 580 |
28 361 |
29 972 |
44.3 |
38.1 |
|
7. Thailand |
55 806 |
62 193 |
30 872 |
29 465 |
55.3 |
47.4 |
|
8. Timor-Leste |
795 |
739 |
663 |
601 |
83.4 |
81.3 |
|
9. Viet Nam |
68 901 |
80 278 |
48 565 |
53 401 |
70.5 |
66.5 |
|
SOUTH ASIA |
|
|
|
|
|
|
|
10. Bangladesh |
114 885 |
143 809 |
72 812 |
77 262 |
63.4 |
53.7 |
|
11. Bhutan |
1 745 |
2 190 |
1 640 |
2 052 |
94.0 |
93.7 |
|
12. India |
880 166 |
1 049 549 |
504 747 |
553 281 |
57.3 |
52.7 |
|
13. Maldives |
229 |
309 |
82 |
78 |
35.8 |
25.2 |
|
14. Nepal |
19 518 |
24 609 |
18 238 |
22 864 |
93.4 |
92.9 |
|
15. Pakistan |
116 545 |
149 911 |
63 853 |
74 841 |
54.8 |
49.9 |
|
16. Sri Lanka |
17 242 |
18 910 |
8 379 |
8 641 |
48.6 |
45.7 |
|
CENTRAL ASIA |
|
|
|
|
|
|
|
17. Kazakhstan |
16 849 |
15 469 |
3 969 |
2 908 |
23.6 |
18.8 |
|
18. Tajikistan |
5 509 |
6 195 |
2 163 |
2 010 |
39.3 |
32.4 |
|
19. Uzbekistan |
21 438 |
25 705 |
7 161 |
6 765 |
33.4 |
26.3 |
|
OTHER ASIA |
|
|
|
|
|
|
|
20. Afghanistan |
15 780 |
22 930 |
10 993 |
15 201 |
69.7 |
66.3 |
|
21. China |
1 189 560 |
1 302 307 |
842 890 |
852 330 |
70.9 |
65.4 |
|
22. DPR Korea |
20 554 |
22 541 |
7 469 |
6 460 |
36.3 |
28.7 |
|
23. Iran (Islamic Rep. of) |
59 275 |
68 070 |
18 315 |
17 357 |
30.9 |
25.5 |
|
24. Mongolia |
2 303 |
2 559 |
699 |
586 |
30.4 |
22.9 |
|
25. Rep. of Korea |
43 739 |
47 430 |
6 276 |
3 663 |
14.3 |
7.7 |
|
PACIFIC ISLANDS |
|
|
|
|
|
|
|
26. Cook Islands |
19 |
18 |
8 |
6 |
42.1 |
33.3 |
|
27. Fiji Islands |
738 |
831 |
325 |
324 |
44.0 |
39.0 |
|
28. Kiribati |
74 |
87 |
23 |
23 |
31.1 |
26.4 |
|
29. Marshall Islands |
46 |
52 |
14 |
14 |
30.4 |
26.9 |
|
30. Micronesia, Fed States of |
101 |
108 |
30 |
28 |
29.7 |
25.9 |
|
31. Nauru |
10 |
13 |
3 |
3 |
30.0 |
23.1 |
|
32. Niue |
2 |
2 |
1 |
1 |
50.0 |
50.0 |
|
33. Palau |
16 |
20 |
5 |
5 |
31.3 |
25.0 |
|
34. Papua New Guinea |
4 336 |
5 586 |
3 506 |
4 258 |
80.9 |
76.2 |
|
35. Samoa |
162 |
176 |
66 |
58 |
40.7 |
33.0 |
|
36. Solomon Islands |
340 |
463 |
258 |
336 |
75.9 |
72.6 |
|
37. Tonga |
99 |
103 |
41 |
34 |
41.4 |
33.0 |
|
38. Tuvalu |
9 |
10 |
4 |
3 |
44.4 |
30.0 |
|
39. Vanuatu |
158 |
207 |
67 |
73 |
42.4 |
35.3 |
|
SUB-TOTAL |
2 984 729 |
3 441 246 |
1 821 794 |
1 909 466 |
61.0 |
55.5 |
|
DEVELOPED COUNTRIES |
||||||
|
40. Australia |
17 374 |
19 544 |
921 |
865 |
5.3 |
4.4 |
|
41. Japan |
124 373 |
127 478 |
7 722 |
4 381 |
6.2 |
3.4 |
|
42. New Zealand |
3 450 |
3 846 |
337 |
329 |
9.8 |
8.6 |
|
SUB-TOTAL |
145 197 |
150 868 |
8 980 |
5 575 |
6.2 |
3.7 |
|
ASIA & PACIFIC* |
3 129 928 |
3 592 116 |
1 830 775 |
1 915 042 |
58.5 |
53.3 |
|
REST OF WORLD |
2 301 043 |
2 632 862 |
647 025 |
673 383 |
28.1 |
25.6 |
|
WORLD |
5 430 971 |
6 224 978 |
2 477 800 |
2 588 425 |
45.6 |
41.6 |
|
Country |
Ratio of Agricultural Land |
Average Annual % change |
||
|
1992 |
2002 |
Agricultural Land |
Agricultural Population |
|
|
DEVELOPING COUNTRIES |
||||
|
SOUTHEAST ASIA |
|
|
|
|
|
1. Cambodia |
0.50 |
0.40 |
0.0 |
2.3 |
|
2. Indonesia |
0.32 |
0.36 |
1.3 |
0.0 |
|
3. Lao PDR |
0.26 |
0.24 |
1.5 |
2.2 |
|
4. Malaysia |
1.63 |
1.94 |
0.3 |
-1.5 |
|
5. Myanmar |
0.33 |
0.31 |
0.6 |
1.1 |
|
6. Philippines |
0.35 |
0.36 |
0.8 |
0.6 |
|
7. Thailand |
0.67 |
0.66 |
-0.6 |
-0.5 |
|
8. Timor-Leste |
0.20 |
0.23 |
0.5 |
-0.9 |
|
9. Viet Nam |
0.14 |
0.17 |
2.9 |
1.0 |
|
SOUTH ASIA |
|
|
|
|
|
10. Bangladesh |
0.11 |
0.11 |
0.1 |
0.6 |
|
11. Bhutan |
0.08 |
0.08 |
2.1 |
2.3 |
|
12. India |
0.34 |
0.31 |
0.1 |
0.9 |
|
13. Maldives |
0.10 |
0.15 |
4.4 |
-0.5 |
|
14. Nepal |
0.13 |
0.14 |
3.2 |
2.3 |
|
15. Pakistan |
0.33 |
0.30 |
0.5 |
1.6 |
|
16. Sri Lanka |
0.23 |
0.22 |
0.1 |
0.3 |
|
CENTRAL ASIA |
|
|
|
|
|
17. Kazakhstan |
8.87 |
7.45 |
-4.7 |
-3.1 |
|
18. Tajikistan |
0.46 |
0.53 |
0.7 |
-0.7 |
|
19. Uzbekistan |
0.68 |
0.71 |
-0.1 |
-0.6 |
|
OTHER ASIA |
|
|
|
|
|
20. Afghanistan |
0.73 |
0.53 |
0.0 |
3.3 |
|
21. China |
0.16 |
0.18 |
1.6 |
0.1 |
|
22. DPR Korea |
0.33 |
0.42 |
0.9 |
-1.4 |
|
23. Iran (Islamic Rep. of) |
1.01 |
0.98 |
-0.7 |
-0.5 |
|
24. Mongolia |
1.95 |
2.05 |
-1.2 |
-1.8 |
|
25. Rep. of Korea |
0.33 |
0.51 |
-1.0 |
-5.2 |
|
PACIFIC ISLANDS |
|
|
|
|
|
26. Cook Islands |
0.63 |
1.00 |
2.6 |
-2.7 |
|
27. Fiji Islands |
0.80 |
0.88 |
1.0 |
0.0 |
|
28. Kiribati |
1.70 |
1.70 |
0.0 |
0.0 |
|
29. Marshall Islands |
- |
0.71 |
- |
0.0 |
|
30. Micronesia, Fed States of |
- |
1.29 |
- |
-0.7 |
|
31. Nauru |
0.00 |
0.00 |
0.0 |
0.0 |
|
32. Niue |
7.00 |
7.00 |
0.0 |
0.0 |
|
33. Palau |
- |
1.20 |
1.1 |
0.0 |
|
34. Papua New Guinea |
0.22 |
0.20 |
0.0 |
2.0 |
|
35. Samoa |
1.85 |
2.22 |
1.1 |
-1.3 |
|
36. Solomon Islands |
0.28 |
0.22 |
0.4 |
2.7 |
|
37. Tonga |
1.17 |
1.41 |
0.0 |
-1.9 |
|
38. Tuvalu |
0.00 |
0.00 |
0.0 |
-2.5 |
|
39. Vanuatu |
1.79 |
1.64 |
0.0 |
0.9 |
|
SUB-TOTAL |
0.27 |
0.27 |
0.1 |
0.1 |
|
DEVELOPED COUNTRIES |
|
|
|
|
|
40. Australia |
51.44 |
56.18 |
0.6 |
-0.6 |
|
41. Japan |
0.67 |
1.09 |
-0.8 |
-5.5 |
|
42. New Zealand |
10.27 |
10.25 |
-0.2 |
-0.2 |
|
AVERAGE |
6.24 |
10.18 |
-9.5 |
0.2 |
|
ASIA & PACIFIC* |
0.30 |
0.30 |
0.3 |
0.5 |
|
REST OF WORLD |
1.47 |
1.43 |
0.1 |
0.4 |
|
WORLD |
0.61 |
0.59 |
0.2 |
0.4 |
![]()
![]()
![]()