![]()
![]()
![]()
|
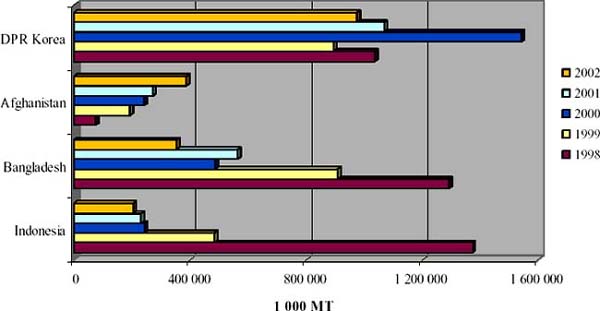
Countries in Asia & Pacific region with largest food aid in cereals
|
|
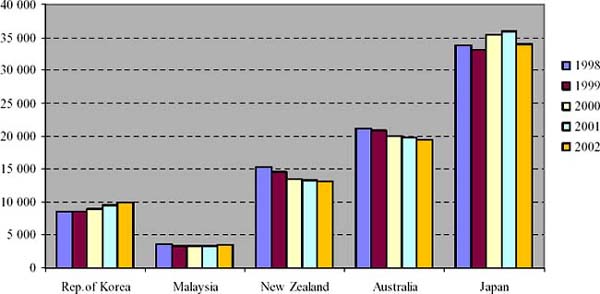
Countries in Asia-Pacific region with largest GNI per capita (current US$)
|
|
COUNTRY |
Agricultural census year |
Agricultural holdings |
||
|
Number |
Total area (ha) |
Average size (ha) |
||
|
DEVELOPING COUNTRIES |
||||
|
SOUTHEAST ASIA |
|
|
|
|
|
1. Cambodia |
- |
- |
- |
- |
|
2. Indonesia |
1993 |
19 713 800 |
17 145 000 |
0.9 |
|
3. Lao PDR |
1998 |
668 000 |
1 047 700 |
1.6 |
|
4. Malaysia |
- |
- |
- |
- |
|
5. Myanmar |
1993 |
2 924 900 |
6 887 000 |
2.4 |
|
6. Philippines |
2002 |
4 501 284 |
9 190 000 |
2.0 |
|
7. Thailand |
2003 |
5 792 519 |
18 313 749 |
3.2 |
|
8. Timor-Leste |
- |
- |
- |
- |
|
9. Viet Nam |
2001 |
9 528 900 |
6 342 700 |
0.7 |
|
SOUTH ASIA |
|
|
|
|
|
10. Bangladesh |
1996 |
17 828 200 |
8 289 900 |
0.5 |
|
11. Bhutan (3) |
2000 |
- |
105 938 |
- |
|
12. India |
1996 |
115 580 000 |
163 357 000 |
1.4 |
|
13. Maldives |
- |
- |
- |
- |
|
14. Nepal |
1992 |
2 736 100 |
2 599 000 |
0.9 |
|
15. Pakistan |
2000 |
6 620 100 |
20 406 574 |
3.1 |
|
16. Sri Lanka |
2002 |
3 269 527 |
1 531 461 |
0.5 |
|
CENTRAL ASIA |
|
|
|
|
|
17. Kazakhstan |
- |
- |
- |
- |
|
18. Tajikistan |
- |
- |
- |
- |
|
19. Uzbekistan |
- |
- |
- |
- |
|
OTHER ASIA |
|
|
|
|
|
20. Afghanistan |
- |
- |
- |
- |
|
21. China (1) |
1997 |
193 445 900 |
130 039 200 |
0.7 |
|
22. DPR Korea |
- |
- |
- |
- |
|
23. Iran (Islamic Rep. of) |
1993 |
3 602 950 |
15 458 910 |
4.3 |
|
24. Mongolia |
- |
- |
- |
- |
|
25. Rep. of Korea |
2000 |
3 269 527 |
- |
- |
|
PACIFIC ISLANDS |
|
|
|
|
|
26. Cook Islands |
2000 |
1 721 |
1 029 |
0.6 |
|
27. Fiji |
1991 |
95 400 |
591 400 |
6.2 |
|
28. Kiribati |
- |
- |
- |
- |
|
29. Marshall Islands |
- |
- |
- |
- |
|
30. Micronesia, Fed States of |
- |
- |
- |
- |
|
31. Nauru |
- |
- |
- |
- |
|
32. Niue |
1989 |
400 |
2 800 |
7.0 |
|
33. Palau (2) |
1989 |
300 |
200 |
0.7 |
|
34. Papua New Guinea |
- |
- |
- |
- |
|
35. Samoa |
1999 |
14 700 |
53 400 |
3.6 |
|
36. Solomon Islands |
- |
- |
- |
- |
|
37. Tonga |
1985 |
10 100 |
33 400 |
3.3 |
|
38. Tuvalu |
- |
- |
- |
- |
|
39. Vanuatu (3) |
1993 |
22 000 |
164 600 |
7.5 |
|
DEVELOPED COUNTRIES |
||||
|
40. Australia |
2001 |
140 516 |
455 723 000 |
3243.2 |
|
41. Japan |
2000 |
3 120 215 |
3 734 288 |
1.2 |
|
42. New Zealand |
2002 |
70 000 |
15 640 348 |
223.4 |
(1). Information on area refers to “cultivated area”.
(2). The census covered 7 of the 13 Rural States of Palau.
(3). Information on area refers to “agricultural area”.Source: FAO - Information based on country agricultural censuses, generally conducted every ten years.
|
Country |
Total land area |
Arable and |
Number of |
Land area under |
Percent of total |
Year of data |
|
DEVELOPING COUNTRIES |
||||||
|
SOUTHEAST ASIA |
|
|
|
|
|
|
|
1. Cambodia |
18 104 |
3 807 |
- |
- |
- |
- |
|
2. Indonesia |
190 457 |
33 546 |
45 000 |
40 000 |
0.090 |
2001 |
|
3. Lao PDR |
23 680 |
958 |
- |
150 |
0.010 |
2001 |
|
4. Malaysia |
32 975 |
7 605 |
- |
- |
- |
2002 |
|
5. Myanmar |
67 658 |
10 495 |
- |
- |
- |
- |
|
6. Philippines |
30 000 |
10 050 |
500 |
2 000 |
0.020 |
2000 |
|
7. Thailand |
51 312 |
18 000 |
1 154 |
3 993 |
0.020 |
2002 |
|
8. Timor-Leste |
- |
- |
- |
- |
- |
- |
|
9. Viet Nam |
33 169 |
7 350 |
1 022 |
6 475 |
0.080 |
2002 |
|
SOUTH ASIA |
|
|
|
|
|
|
|
10. Bangladesh |
14 400 |
8 484 |
100 |
177 700 |
- |
2002 |
|
11. Bhutan |
4 700 |
160 |
- |
- |
- |
- |
|
12. India |
328 726 |
169 700 |
5 147 |
37 050 |
0.030 |
2002 |
|
13. Maldives |
30 |
3 |
- |
- |
- |
- |
|
14. Nepal |
14 718 |
2 968 |
26 |
45 |
0.001 |
2001 |
|
15. Pakistan |
79 610 |
21 960 |
405 |
2 009 |
0.080 |
2001 |
|
16. Sri Lanka |
6 561 |
1 910 |
3 301 |
15 215 |
0.650 |
2001 |
|
CENTRAL ASIA |
|
|
|
|
|
|
|
17. Kazakhstan |
272 490 |
21 671 |
1 |
36 882 |
- |
2002 |
|
18. Tajikistan |
14 310 |
860 |
- |
- |
- |
- |
|
19. Uzbekistan |
44 740 |
4 850 |
- |
- |
- |
- |
|
OTHER ASIA |
|
|
|
|
|
|
|
20. Afghanistan |
- |
- |
- |
- |
- |
- |
|
21. China |
959 805 |
135 557 |
2 910 |
301 295 |
0.060 |
2001 |
|
22. DPR Korea |
12 054 |
2 000 |
- |
- |
- |
- |
|
23. Iran (Islamic Rep. of) |
164 820 |
16 326 |
- |
- |
- |
- |
|
24. Mongolia |
156 650 |
1 176 |
- |
- |
- |
- |
|
25. Rep. of Korea |
9 926 |
1 919 |
1 237 |
902 |
0.050 |
1998 |
|
PACIFIC ISLANDS |
|
|
|
|
|
|
|
26. Cook Islands |
23 |
7 |
- |
- |
- |
- |
|
27. Fiji |
1 827 |
285 |
10 |
200 |
0.040 |
2000 |
|
28. Kiribati |
73 |
37 |
- |
- |
- |
- |
|
29. Marshall Islands |
- |
- |
- |
- |
- |
- |
|
30. Micronesia, Fed States of |
- |
- |
- |
- |
- |
- |
|
31. Nauru |
2 |
- |
- |
- |
- |
- |
|
32. Niue |
26 |
7 |
- |
- |
- |
- |
|
33. Palau |
46 |
10 |
- |
- |
- |
- |
|
34. Papua New Guinea |
46 284 |
855 |
- |
4 265 |
0.410 |
1995 |
|
35. Samoa |
284 |
122 |
- |
- |
- |
- |
|
36. Solomon Islands |
2 890 |
60 |
- |
- |
- |
- |
|
37. Tonga |
75 |
48 |
- |
- |
- |
- |
|
38. Tuvalu |
- |
- |
- |
- |
- |
- |
|
39. Vanuatu |
1 219 |
120 |
- |
- |
- |
- |
|
DEVELOPED COUNTRIES |
||||||
|
40. Australia |
774 122 |
50 600 |
1 380 |
10 000 000 |
2.200 |
2002 |
|
41. Japan |
37 780 |
4 830 |
- |
5 083 |
0.100 |
1999 |
|
42. New Zealand |
27 053 |
3 280 |
800 |
46 000 |
0.330 |
2002 |
|
WORLD |
13 425 432 |
1 497 365 |
462 475 |
24 070 010 |
- |
- |
* Data on organic farms from publication of International Federation of Organic Agriculture Movements (IFOAM)
The World of Organic Agriculture 2004, 6th, revised edition, February 2004: Helga Willer and Minou Yussefi (Eds.)
|
COUNTRY |
Population |
Average annual growth rate |
Agricultural |
% |
||
|
2002 |
1982-1992 |
1992-2002 |
2000-2010 |
2002 |
2002 |
|
|
DEVELOPING COUNTRIES |
||||||
|
SOUTHEAST ASIA |
|
|
|
|
|
|
|
1. Cambodia |
13.8 |
4.0 |
2.8 |
2.4 |
4 764 |
69.3 |
|
2. Indonesia |
217.1 |
1.9 |
1.4 |
1.2 |
49 957 |
47.0 |
|
3. Lao PDR |
5.5 |
2.7 |
2.4 |
2.3 |
2 113 |
76.1 |
|
4. Malaysia |
24.0 |
2.6 |
2.5 |
1.8 |
1 795 |
17.3 |
|
5. Myanmar |
48.9 |
1.8 |
1.5 |
1.2 |
18 437 |
69.6 |
|
6. Philippines |
78.6 |
2.4 |
2.1 |
1.7 |
12 688 |
38.3 |
|
7. Thailand |
62.2 |
1.5 |
1.1 |
1.0 |
20 348 |
54.9 |
|
8. Timor-Leste |
0.7 |
2.7 |
-1.7 |
3.4 |
318 |
81.3 |
|
9. Viet Nam |
80.3 |
2.2 |
1.5 |
1.3 |
28 227 |
66.5 |
|
SOUTH ASIA |
|
|
|
|
|
|
|
10. Bangladesh |
143.8 |
2.5 |
2.3 |
1.9 |
39 182 |
53.7 |
|
11. Bhutan |
2.2 |
2.5 |
2.4 |
2.8 |
992 |
93.7 |
|
12. India |
1 049.5 |
2.1 |
1.8 |
1.4 |
270 252 |
58.7 |
|
13. Maldives |
0.3 |
3.2 |
3.1 |
3.0 |
27 |
20.6 |
|
14. Nepal |
24.6 |
2.3 |
2.4 |
2.2 |
10 897 |
92.9 |
|
15. Pakistan |
149.9 |
3.1 |
2.6 |
2.5 |
25 669 |
46.1 |
|
16. Sri Lanka |
18.9 |
1.5 |
0.9 |
0.8 |
3 894 |
44.9 |
|
CENTRAL ASIA |
|
|
|
|
|
|
|
17. Kazakhstan |
15.5 |
- |
-1.0 |
-0.3 |
1 287 |
16.8 |
|
18. Tajikistan |
6.2 |
- |
1.2 |
1.0 |
822 |
32.5 |
|
19. Uzbekistan |
25.7 |
- |
1.8 |
1.5 |
3 006 |
26.3 |
|
OTHER ASIA |
|
|
|
|
|
|
|
20. Afghanistan |
22.9 |
0.4 |
3.3 |
3.9 |
6 192 |
66.3 |
|
21. China |
1 272.4 |
1.5 |
0.9 |
0.7 |
510 192 |
66.6 |
|
22. DPR Korea |
22.5 |
1.5 |
0.9 |
0.4 |
3 323 |
28.7 |
|
23. Iran (Islamic Rep. of) |
68.1 |
3.3 |
1.4 |
1.3 |
6 374 |
25.6 |
|
24. Mongolia |
2.6 |
2.9 |
1.0 |
1.4 |
306 |
22.9 |
|
25. Rep. of Korea |
47.4 |
1.1 |
0.8 |
0.5 |
2 158 |
8.8 |
|
PACIFIC ISLANDS |
|
|
|
|
|
|
|
26. Cook Islands |
0.0 |
0.4 |
-0.7 |
0.5 |
2 |
28.6 |
|
27. Fiji |
0.8 |
0.8 |
1.2 |
0.9 |
132 |
38.9 |
|
28. Kiribati |
0.1 |
2.2 |
1.6 |
1.3 |
10 |
26.3 |
|
29. Marshall Islands |
0.1 |
3.3 |
1.3 |
1.1 |
6 |
26.1 |
|
30. Micronesia, Fed States of |
0.1 |
3 |
0 |
1 |
12 |
27 |
|
31. Nauru |
0.0 |
2.5 |
2.6 |
2.3 |
1 |
16.7 |
|
32. Niue |
0.0 |
-5.4 |
0.0 |
0.0 |
- |
0.0 |
|
33. Palau |
0.0 |
2.3 |
2.4 |
2.4 |
2 |
22.2 |
|
34. Papua New Guinea |
5.6 |
2.4 |
2.6 |
2.1 |
1 944 |
73.2 |
|
35. Samoa |
0.2 |
0.4 |
0.9 |
1.1 |
21 |
33.3 |
|
36. Solomon Islands |
0.5 |
3.3 |
3.2 |
2.8 |
172 |
72.3 |
|
37. Tonga |
0.1 |
0.3 |
0.4 |
0.9 |
12 |
32.4 |
|
38. Tuvalu |
0.0 |
2 |
1 |
1 |
1 |
25 |
|
39. Vanuatu |
0.2 |
2.5 |
2.8 |
2.4 |
32 |
35.2 |
|
DEVELOPED COUNTRIES |
||||||
|
40. Australia |
19.5 |
1.5 |
1.2 |
0.9 |
442 |
4.4 |
|
41. Japan |
127.5 |
0.5 |
0.3 |
0.1 |
2 454 |
3.6 |
|
42. New Zealand |
3.8 |
0.8 |
1.1 |
0.7 |
168 |
8.8 |
Sources: FAO Statistical Database
* Labour force: This term covers all economically active persons in the age from 15 to 64 plus those persons at the age of 10 to 15 and over 64 for whom an economic activity was reported. It includes the armed forces and the unemployed but excludes groups deemed economically inactive such as students, housewives, care-givers and others who are constitutionally excluded from economic activities. (For further definition, see ILO, Labour Force Estimates and Projections 1950-2000, Geneva 1986.)
![]()
![]()
![]()