![]()
![]()
![]()
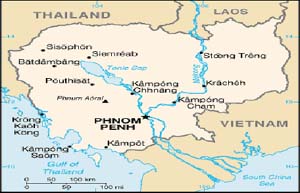
CAMBODIA
|
Land Use (2002) |
Total area (17 652 000 ha) |
|
Population (2002) |
Total population (13 441 000) |
|
GDP/GNI(2003) |
Total GDP (US$4 299 million) |
|
Agricultural Trade (2002) |
Imports (US$281.7 million) |
|
Nutrition (2000-2002) |
Per caput DES (2 060 kcal/day) |
Cambodia is located on mainland Southeast Asia between Thailand, Viet Nam and Lao PDR. Cambodia has a sea coast on the Gulf of Thailand. Natural resources are abundant in timber, gemstones, some iron ore, manganese and phosphate, and hydroelectric potential from the Mekong River. Agriculture dominates the Cambodian economy, contributing 35.6 percent GDP in 2002 and employing 69 percent of the workforce. The majority of farming households are engaged in rice production. Timber and rubber are important export commodities. Main agricultural products are rice, rubber, corn, meat, vegetables, dairy products, sugar and flour. Agricultural imports have grown at an annual rate of 24.0 percent from 1992 to 2002. Main agricultural imports include cigarettes, refined sugar, beverages, milled paddy rice and prepared food. Over the same period, agricultural exports have grown at 3.5 percent annually. Rubber is the major agricultural export followed by hides and salted cattle, paddy rice and cattle.
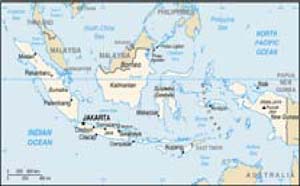
INDONESIA

|
Land Use (2002) |
Total area (181 157 000 ha) |
|
Population (2002) |
Total population (2 117 131 000) |
|
GDP/GNI(2003) |
Total GDP(US$208 311 million) |
|
Agricultural Trade (2002) |
Imports (US$4 201.5 million) |
|
Nutrition (2000-2002) |
Per caput DES (2 910 kcal/day) |
Indonesia is the world’s largest archipelago and is located between the Indian Ocean and the Pacific Ocean. A large part of its land area is coastal lowlands; larger islands have interior mountains. The country has extensive natural resources, including abundant forest and oceanic resources, fertile land, and rich deposits of petroleum, natural gas, tin, nickel, timber, bauxite, copper, coal, gold and silver. Indonesia has a well-balanced economy in which all major sectors play an important role. Agriculture (including animal husbandry, fishing and forestry) is both an important source of export earnings and formal employment, and the means by which the majority of the Indonesian rural population subsists. About 47 percent of the workforce engages in agriculture. The agricultural sector contributed 17.5 percent of the total GDP in 2002. Main agricultural products are rice, cassava (tapioca), peanuts, rubber, cocoa, coffee, palm oil, copra, poultry, beef, pork and eggs. Agricultural imports have grown at an annual rate of 4.9 percent from 1992 to 2002. Main agricultural imports include cotton lint, wheat, soybeans (including cakes) and rice. Over the same period, agricultural exports have grown at 3.3 percent annually. Oil palm is the major agricultural export followed by rubber, cocoa beans, coffee, tea, cocoa and peppers.
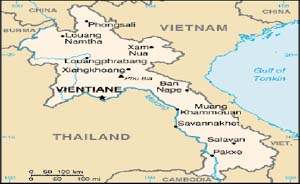
LAO PDR

|
Land Use(2002) |
Total area (23 080 000 ha) |
|
Population (2002) |
Total population (5 529 000) |
|
GDP/GNI(2003) |
Total GDP (US$2 036 million) |
|
Agricultural Trade (2002) |
Imports (US$85.6 million) |
|
Nutrition (2000-2002) |
Per caput DES (2 290 kcal/day) |
Lao PDR is a mountainous, land-locked, small country heavily dependant economically on Thailand with an inadequate infrastructure and a largely unskilled work force. The most valuable natural resources are forests and rivers which are useful for producing electricity; about 80 percent of the electricity produced is exported to Thailand. Agriculture (including forestry and fishing) is the most important economic sector. Agriculture, mostly subsistence rice farming, employs an estimated 76 percent of the workforce and produces 51 percent of GDP. Rice production dominates agriculture accounting for 78 percent of land under cultivation. Tobacco and coffee are the most important non-rice cash crops. Agricultural imports have grown at an annual rate of 11.6 percent from 1992 to 2002. The main agricultural imports include beverages, cigarettes, sugar and food. Over the same period, agricultural exports have declined 7.0 percent annually. Coffee is the major agricultural export followed by buffalo, cattle and apples.
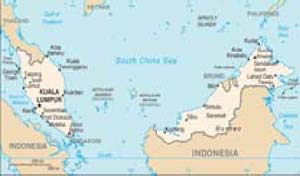
MALAYSIA

|
Land Use (2002) |
Total area (32 855 000 ha) |
|
Population (2002) |
Total population (23 695 000) |
|
GDP/GNI(2003) |
Total GDP (US$103 161 million) |
|
Agricultural Trade (2002) |
Imports (US$4 300.5 million) |
|
Nutrition (2000-2002) |
Per caput DES (2 890 kcal/day) |
Malaysia consists of two separate parts divided by the South China Sea: Peninsular Malaysia on the Malay Peninsula; and East Malaysia, the northern part of the Island of Borneo. Both West and East Malaysia feature coastal plains rising to often densely forested hills and mountains. Natural resources are petroleum, liquefied natural gas (LNG), tin and minerals. The main agricultural products are palm oil, rubber, timber, cocoa, rice, tropical fruit, fish and coconut. Malaysia transformed itself from 1971 through the late 1990s from a producer of raw materials into an emerging multi-sector economy via the New Economic Plan (NEP). Manufacturing grew from 13.9 percent of GDP in 1970 to 30.4 percent in 2002, while agriculture and mining, which together had accounted for 42.7 percent of GDP in 1970, dropped to approximately 16 percent in 2002. Agricultural imports have grown at an annual rate of 4.0 percent from 1992 to 2002. Main agricultural imports include maize, sugar, tobacco leaves, wheat, prepared food and natural rubber. Over the same period, agricultural exports have increased 1.6 percent annually. Palm oil is the major agricultural export followed by fatty acids oil, margarine and cigarettes.
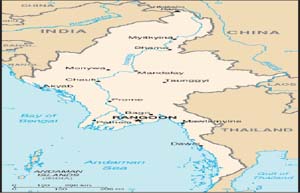
MYANMAR

|
Land Use (2002) |
Total area (65 755 000 ha) |
|
Population (2002) |
Total population (48 852 000) |
|
GDP/GNI(2003) |
Total GDP(NA) GNI per capita (NA) |
|
Agricultural Trade (2002) |
Imports (US$286.2 million) |
|
Nutrition (2000-2002) |
Per caput DES (2 880 kcal/day) |
Myanmar has borders on the Andaman Sea and the Bay of Bengal and is located between Bangladesh and Thailand. It has central lowlands ringed by steep, rugged highlands. Natural resources are petroleum, timber, tin, antimony, zinc, copper, tungsten, lead, coal, some marble, limestone, precious stones, natural gas and hydropower. Main agricultural products are rice, pulses, beans, sesame, groundnuts, sugarcane, hardwood, fish, and fish products. According to official data, agriculture (including forestry and fishing) remains by far the biggest sector, accounting for 57.2 percent of current-price GDP in fiscal year 2001/02 (April-March), and employing close to 70 percent of the workforce in 2002. Agricultural imports have grown at an annual rate of 2.8 percent from 1992 to 2002. Main agricultural imports include palm oil, tobacco products and cigarettes, margarine, beverages, and whole milk. Over the same period, agricultural exports have increased 5.0 percent annually. Dry beans are the major agricultural export followed by paddy rice, maize, natural rubber, cigarettes and cattle.
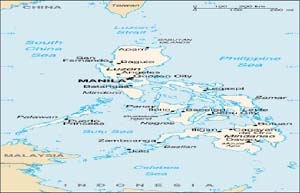
PHILIPPINES

|
Land Use (2002) |
Total area (29 817 000 ha) |
|
Population (2002) |
Total population (78 580 000) |
|
GDP/GNI(2003) |
Total GDP (US$80 574 million) |
|
Agricultural Trade (2002) |
Imports (US$2 644.5 million) |
|
Nutrition (2000-2002) |
Per caput DES (2 380 kcal/day) |
The Philippines is one of the world’s largest archipelagos; with more than 7 100 islands, it extends 1 900 km north to south and 1 100 km east to west. The land is mostly mountainous with coastal lowlands. The Philippines has extensive fishing resources (both marine and inland) and large deposits of mineral and energy resources, such as petroleum, nickel, cobalt, silver and gold, and timber. Reflecting its varied resource endowments, physical and human, the economy is diversified. Rice and coconut production continue to dominate the agricultural sector. Other main agricultural commodities include corn, sugarcane, bananas, pineapples and mangoes. About 38 percent of the workforce engages in agriculture. The share of agriculture in total GDP has declined as the sector contributed only about 14.7 percent of the total GDP in 2002. Reflecting this trend, agricultural exports currently account for less than 5 percent of the country’s foreign earnings. Agricultural imports have grown at an annual rate of 6.3 percent from 1992 to 2002. Wheat is the main agricultural import, followed by soybeans (including the cake of soya beans) and rice. Over the same period, agricultural exports have grown at 0.2 percent. Coconut oil and bananas are the countries two major agricultural exports. The country also exports other tropical fruits, such as mangoes and pineapples, both fresh and processed, as well as coconuts, dry whole cow milk and sugar.
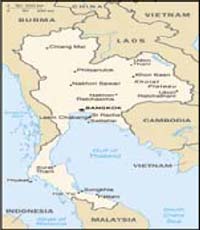
THAILAND

|
Land Use (2002) |
Total area (51 089 000 ha) |
|
Population (2002) |
Total population (62 193 000) |
|
GDP/GNI(2003) |
Total GDP (US$143 163 million) |
|
Agricultural Trade (2002) |
Imports (US$2 976.1 million) |
|
Nutrition (2000-2002) |
Per caput DES (2 450 kcal/day) |
Thailand consists of a densely populated central plain; northeastern plateau; mountain range in the west; and a southern isthmus that connects to Malaysia. Natural resources are tin, rubber, natural gas, tungsten, tantalum, timber, lead, fish, gypsum, lignite and fluorite. The Thai economy is export-dependent, with exports accounting for 60 percent of GDP. The agriculture sector accounted for 9.4 percent of GDP in 2002. Approximately 55 percent of Thailand’s labor force is employed in agriculture. Rice, the dominant agricultural export crop, is irrigated in the Central Plains and in the basins of northern Thailand, but it is rain-fed elsewhere. Thailand remains the world’s largest exporter of rice, and in 2003 sold 7.3 million tonnes (down from 7.7 million tonnes in 2001) worth US$1.9 billion. Other agricultural products are tapioca, rubber, corn, sugarcane, coconuts and soybeans. Other agricultural commodities produced in significant amounts include fish and fishery products. Agricultural imports have grown at an annual rate of 2.3 percent from 1992 to 2002. Cotton lint is the main agricultural import, followed by soybeans (including the cake of soya beans), wheat and cattle hides. Over the same period, agricultural exports have grown at an annual rate of 1.1 percent. Natural rubber and paddy rice are the country’s two major agricultural export items. The country also exports chicken meats and canned chicken and raw and refined sugar.
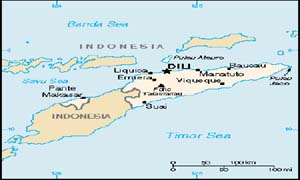
TIMOR-LESTE

|
Land Use (2002) |
Total area (1 487 000 ha) |
|
Population (2002) |
Total population (739 000) |
|
GDP/GNI(2003) |
Total GDP (US$314 million) |
|
Agricultural Trade (2002) |
Imports (US$47.5 million) |
|
Nutrition (2000-2002) |
Per caput DES (2 810 kcal/day) |
Timor-Leste is a small mountainous country that is classified among the poorest countries of the world and the poorest in Southeast Asia. The agricultural sector contributes about 25 percent to GDP. Approximately 40 percent of the population of 864 000 is considered to be below the national poverty line of 1.5 US$ per day. GDP is expected to decline further, reflecting the continued effect of the reduced international presence and the adverse impact of a delayed rainy season on agricultural output. The agricultural economy is dominated by low input/output subsistence agriculture. Important products are maize, cassava, cowpeas, sweet potatoes and rice. Cereal import requirements for the marketing year 2003/04 are estimated at 62 000 tonnes. Household food security is highly heterogeneous across districts and the country, although food insecurity is generally a more pronounced problem in rural upland areas. Main agricultural imports include macaroni, dry skim milk, pastry and chicken meat. Coffee is the major agricultural export followed by spices.
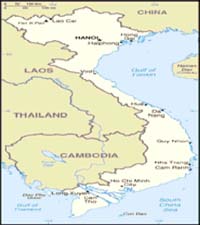
VIET NAM

|
Land Use (2002) |
Total area (32 549 000 ha) |
|
Population (2002) |
Total population (80 278 000) |
|
GDP/GNI(2003) |
Total GDP (US$39 157 million) |
|
Agricultural Trade (2002) |
Imports (US$1 332.8 million) |
|
Nutrition (2000-2002) |
Per caput DES (2 530 kcal/day) |
The terrain of Viet Nam varies from mountainous to coastal delta. Natural resources are coal, crude oil, zinc, copper, silver, gold, manganese and iron. Main agricultural products are rice, maize, sweet potato, peanut, soya bean, cotton, coffee, and cashews. Measured by employment, Viet Nam is an agrarian society, with around 67 percent of the labour force working in agriculture. Since 1986, when the Sixth Party Congress approved a broad economic reform package called “Doi Moi,” (renovation) Viet Nam became one of the fastest growing economies in the world, averaging around 8 percent annual GDP growth from 1990 to 1997. Simultaneously, agricultural production doubled, transforming Viet Nam from a net food importer to one of the world’s largest exporters of rice and of commodities such as coffee, tea, rubber, pepper and fisheries products. However, agriculture’s share of economic output declined, falling from 42 percent in 1989 to 23.0 percent in 2002 (as production in other sectors of the economy increased). Agricultural imports have grown at an annual rate of 16.8 percent from 1992 to 2002. Main agricultural imports include cigarettes, wheat, cotton lint and soya bean cake. Over the same period, agricultural exports have increased 10.5 percent annually. Paddy rice is the major agricultural export followed by natural rubber, cashew nuts and pepper.
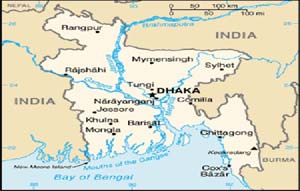
BANGLADESH
|
Land Use (2002) |
Total area (13 017 000 ha) |
|
Population (2002) |
Total population (143 809 000) |
|
GDP/GNI(2003) |
Total GDP (US$51 897 million) |
|
Agricultural Trade (2002) |
Imports (US$1 404.2 million) |
|
Nutrition (2000-2002) |
Per caput DES (2 190 kcal/day) |
The land of Bangladesh is mostly flat, although there are some hilly areas in the northeastern and southeastern regions. Much of the land is intersected by the numerous waterways of the Ganges Delta and the Brahmaputra River. The annual flooding of the land provides rich alluvial soils. Natural resources are natural gas, fertile soil and water. Around 75 percent of the planted crop area is devoted to rice crops. Main agriculture products are rice, jute, tea, sugar and wheat. Because of Bangladesh’s fertile soil and normally ample water supply, rice can be grown and harvested three times a year in many areas. Bangladesh’s predominantly agricultural economy accounted for 22.7 percent of the total GDP in 2002, depending heavily on an erratic monsoonal cycle with periodic flooding and drought. Most Bangladeshis, 54 percent of the total workforce, earn their living from agriculture. Population pressure continues to place a severe burden on productive capacity, creating a food deficit, especially of wheat. Foreign assistance and commercial imports fill the gap. Agricultural imports have grown at an annual rate of 10.2 percent from 1992 to 2002. Main agricultural imports include palm oil, wheat, paddy rice, cotton lint and soya bean oil. Over the same period, agricultural exports have decreased 2.4 percent annually. Jute is the country’s major agricultural export followed by fresh vegetables, tea, tobacco leaves and nuts.
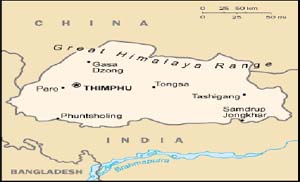
BHUTAN

|
Land Use (2002) |
Total area (4 700 000 ha) |
|
Population (2002) |
Total population (2 190 000) |
|
GDP/GNI(2003) |
Total GDP (US$645 million) |
|
Agricultural Trade (2002) |
Imports (US$18.5 million) Exports |
|
Nutrition (2000-2002) |
Per caput DES (NA) |
Bhutan, one of the world’s smallest and least developed countries, is mostly mountainous with some fertile valleys and savanna; 66 percent of the total land is forest. Natural resources are timber, hydropower, gypsum, and calcium carbide. The economy is closely aligned with India through strong trade and monetary links and dependence on India’s financial assistance. Although poor in terms of income per head, poverty is less evident than in most countries of similar income levels. The economy of Bhutan is based on agriculture and forestry, providing the main livelihood to almost 94 percent of the workforce and contributing 33.9 percent of GDP in 2002. Bhutan is largely an agrarian society; agriculture consists mainly of subsistence farming and animal husbandry. However, the main growth in the sector is a result of forestry and cash-crop production. Increasing self-sufficiency is a major target of the government. Main agricultural products are rice, corn, root crops, citrus, milk and eggs. Agricultural imports have grown at an annual rate of 2.9 percent from 1992 to 2002. Main agricultural imports include paddy rice, mustard seed oil, dry skim milk and barley beer. Over the same period, agricultural exports have increased 2.2 percent annually. Wheat flour is the country’s major agricultural export followed by oranges, beverages, apples and potatoes.
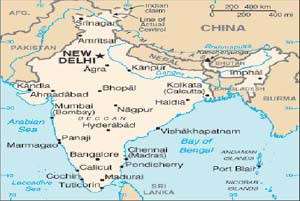
INDIA
|
Land Use (2002) |
Total area (297 319 000 ha) |
|
Population (2002) |
Total population (1 049 549 000) |
|
GDP/GNI(2003) |
Total GDP (US$598 966 million) |
|
Agricultural Trade (2002) |
Imports (US$4 019.4 million) |
|
Nutrition (2000-2002) |
Per caput DES (2 420 kcal/day) |
The terrain of India varies from the Himalayas to flat river valleys. Natural resources are coal, iron ore, manganese, mica, bauxite, chromite, thorium, limestone, barite, titanium ore, diamonds and crude oil. Two-thirds of India’s labour force works in agriculture which, with forestry and fishing, accounts for around 22.7 percent of GDP. However, the majority of landholdings are farmed at subsistence level, and many farming families live below the poverty line. India has some of the lowest human development indicators in the world, particularly in rural areas. At the other end of the scale, India also has a large number of highly qualified professionals, as well as several internationally established industrial groups. Main agriculture products are wheat, rice, coarse grains, oilseeds, sugar, cotton, jute and tea. With the introduction of high-yield crop varieties and new fertilizing and irrigation techniques, the so called Green Revolution, India has been self-sufficient in food since the mid-1970s. Agricultural imports have grown at an annual rate of 12.8 percent from 1992 to 2002. Main agricultural imports include palm oil, soyabean oil, cashew nuts, cotton lint and pulses. Over the same period, agricultural exports have increased 5.4 percent annually. Paddy rice is the major agricultural export followed by cashew nuts, wheat, tea and sugar.
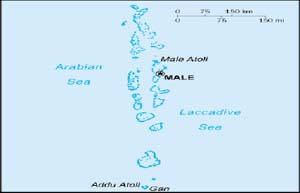
MALDIVES

|
Land Use (2002) |
Total area (30 000 ha) |
|
Population (2002) |
Total population (309 000) |
|
GDP/GNI(2003) |
Total GDP (US$696 million) |
|
Agricultural Trade (2002) |
Imports (US$84.3 million) |
|
Nutrition (2000-2002) |
Per caput DES (2 540 kcal/day) |
The 1 190 islands of the Maldives are scattered over a vast area of the Indian Ocean (90 000 square kilometres), complicating transport, especially in rough seas, and making service delivery to the unevenly distributed and widely dispersed population living on 198 islands very expensive. Marine resources are the main natural endowment, with economic activities concentrated on fishing and tourism. There are no inland fisheries and no aquaculture in the Maldives. Fishing operations take place in off-shore, coastal and reef waters. Currently fisheries account for 11 percent of GDP, 20 percent of employment and 74 percent of the country’s export commodities. A small internal market (many island communities depend on a single source of income (fishing)), scarcity of jobs and very limited agricultural opportunities add to the complexity of development challenges. Agricultural imports have grown at an annual rate of 8.3 percent from 1992 to 2002. Main agricultural imports include cigarettes, paddy rice, dry whole milk, wheat flour and chicken meat. Over the same period, agricultural exports have increased 31.6 percent annually. Fish meal is the major agricultural export followed by fish oils.
NEPAL

|
Land Use (2002) |
Total area (14 300 000 ha) |
|
Population (2002) |
Total population (24 609 000) |
|
GDP/GNI(2003) |
Total GDP (US$5 835 million) |
|
Agricultural Trade (2002) |
Imports (US$228.5 million) |
|
Nutrition (2000-2002) |
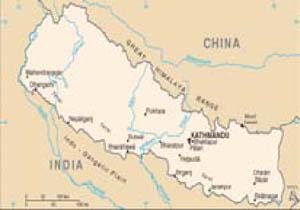
Per caput DES (2 440 kcal/day) |
Nepal is located between China and India and has eight of the world’s 10 highest peaks. The mountains, hills and terai comprise 35 percent, 42 percent and 23 percent of the country’s land area, respectively. Around 93 percent of the economically active population live in rural areas and depend on subsistence farming. Agriculture accounts for about 40 percent of the total GDP. Timber is one of the Nepal’s main natural resources, but the area under forest has declined over the past three decades due to overexploitation. The country’s other natural resources include quartz, water, hydropower, lignite, copper, cobalt, and iron ore. The country’s main agricultural production includes grains - - mostly rice (56 percent of total cereal outputs in 2002/03), corn (21 percent), wheat (18 percent), sugarcane, root crops, milk and water buffalo meat. The country’s industrial activity mainly involves the processing of agricultural produce including jute, sugarcane, tobacco, and grain. Agricultural imports have grown at an annual rate of 6.0 percent from 1992 to 2002. Main imported agricultural commodities include palm oil, soybean oil, wool, betel (areca nut), and pulses. Over the same period, agricultural exports have grown at 6.9 percent annually. Although Nepal exports pulses, lentils, spices (e.g. nutmeg, mace, cardamom), and hides and skin products, it suffers from a chronic trade deficit.
PAKISTAN

|
Land Use (2002) |
Total area (77 088 000 ha) |
|
Population (2002) |
Total population (149 911 000) |
|
GDP/GNI(2003) |
Total GDP (US$68 815 million) |
|
Agricultural Trade (2002) |
Imports (US$1 563.8 million) |
|
Nutrition (2000-2002) |
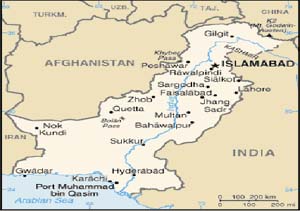
Per caput DES (2 430 kcal/day) |
Pakistan is located in Southern Asia and is bordered by India in the east, China in the north-east, Afghanistan in the north and north-west, Iran in the south-west and the Arabian Sea to the south. The size of the annual cotton crop, the bulk of it grown in Punjab province, is a crucial barometer of the health of the overall economy since it accounts for 80 percent of export earnings. Natural resources are arable land, natural gas, limited petroleum, substantial hydropower potential, coal, and iron ore. Main agriculture products are wheat, cotton, rice, sugarcane, tobacco. In 2002, agriculture accounted for 23.2 percent of GDP and provided employment to 46 percent of the labour force. It supplies most of the country’s food, but is also the source of raw materials for major domestic industries, especially for cotton products. Two fundamental problems that trouble the agricultural sector are: an excessive dependence on a cotton crop highly susceptible to adverse weather conditions and pest damage; and the food import bill, which is rising rapidly despite a steady increase in crop, livestock, and fruit production. Agricultural imports have grown at an annual rate of 0.9 percent from 1992 to 2002. Main imported agricultural commodities include palm oil, cotton lint, tea, and rapeseed. Over the same period, agricultural exports have grown at 0.9 percent annually. Paddy rice is the main export followed by wheat, molasses, and wheat flour.
SRI LANKA

|
Land Use (2002) |
Total area (6 463 000 ha) |
|
Population (2002) |
Total population (18 910 000) |
|
GDP/GNI(2003) |
Total GDP(US$18 514 million) |
|
Agricultural Trade (2002) |
Imports (US$807.1 million) |
|
Nutrition (2000-2002) |
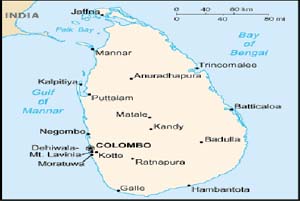
Per caput DES (2 390 kcal) |
The terrain of Sri Lanka consists of coastal plains in the northern third of the country; with hills and mountains in south-central Sri Lanka which rise as high as 2 133 meters. Natural resources are limestone, graphite, mineral sands, gems and phosphate. Sri Lanka’s economy is highly dependent on domestic trade. The main agriculture products are rice, tea, rubber, coconut and spices. The plantation sector produces the three main export crops-tea, rubber and coconut-of which only tea has the potential for any real increase in output. Sri Lanka is the world’s leading tea exporter, and second only to the Philippines in the export of desiccated coconut and natural rubber. Paddy rice dominates the non-plantation agricultural sector and accounts for one-fifth of total agricultural output, rendering it an important determinant of agricultural growth. Although yields have improved continuously, high production costs are a drawback. Agriculture has lost its relative importance to the Sri Lankan economy in recent decades. It accounts for 20.1 percent of GDP and provides employment to 45 percent of the working population. Agricultural imports have grown at an annual rate of 5.1 percent from 1992 to 2002. Main imported agricultural commodities include wheat, sugar, dry whole milk, tobacco leaves, lentils and palm oil. Over the same period, agricultural exports have grown at 8.6 percent annually. Tea is the main export followed by cinnamon, coir, coconuts, cloves and natural rubber.
KAZAKHSTAN

|
Land Use (2002) |
Total area (269 970 000 ha) |
|
Population (2002) |
Total population (15 469 000) |
|
GDP/GNI(2003) |
Total GDP (US$29 749 million) |
|
Agricultural Trade (2002) |
Imports (US$531.7 million) |
|
Nutrition (2000-2002) |
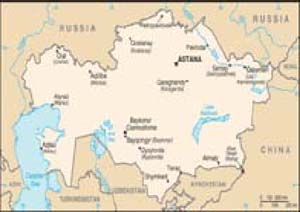
Per caput DES (2 550 kcal/day) |
Kazakhstan borders many countries and has coastlines on the Aral Sea and the Caspian Sea. Its terrain extends east to west from the Caspian Sea to the Altay Mountains and north to south from the plains of Western Siberia to the oasis and desert of Central Asia. Oil, gas, and mineral exports are key to its economic success and have attracted most of the over US$18.4 billion in foreign investment since 1993. Kazakhstan has significant deposits of coal, iron, copper, zinc, uranium, and gold. Kazakhstan is the sixth-largest producer of grain in the world; livestock is another important agricultural commodity. Agricultural land occupies more than 84.6 million hectares; 20.5 million hectares of arable land and 61.1 million hectares of pasture and hay land. Chief livestock products are dairy goods, leather, meat, and wool. The country’s major crops include wheat, barley, cotton, and rice. Agriculture accounts for over 8 percent of the GDP and accomodates 17 percent of the whole workforce. Agricultural imports have decreased at an annual rate of 1.0 percent from 1992 to 2002. Main imported agricultural commodities include sugar, chocolate products, food, sunflower seed oil, and tea. Over the same period, agricultural exports have grown at 2.4 percent annually. Wheat exports are a major source of hard currency; other agricultural exports are cotton lint, barley, and cattle hides.
TAJIKISTAN
|
Land Use (2002) |
Total area (14 060 000 ha) |
|
Population (2002) |
Total population (6 195 000) |
|
GDP/GNI(2003) |
Total GDP (US$1 303 million) |
|
Agricultural Trade (2002) |
Imports (US$133.9 million) |
|
Nutrition (2000-2002) |
Per caput DES (1 840 kcal/day) |
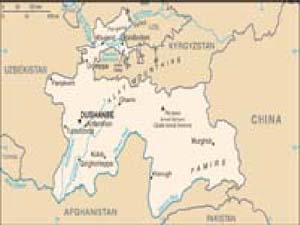
Tajikistan is a mountainous, landlocked country in the southeastern part of the Central Asia that is bordered in the west and northwest by Uzbekistan, in the northeast by the Kyrgyz Republic, in the east by China and in the south by Afghanistan. Over 90 percent of Tajikistan is mountainous and over half lies above 3 000 meters. The north of the country covers part of the Fergana valley, which is a major agricultural area in the region. Natural resources are hydropower, some petroleum, uranium, mercury, brown coal, lead, zinc, antimony, tungsten, silver, and gold. Those mineral resources are varied, but limited in amount. The civil war (1992-97) severely damaged the already weak economic infrastructure and caused a sharp decline in industrial and agricultural production. The cultivable area, about 11 percent of the total area of the country, utilized in annual crops and permanent crops, of which more than half were vineyards. Agriculture employed 32.5 percent of the economically active population in 2002 and contributed some 24 percent of GDP in 2002. Tajikistan has the lowest per capita GDP among the 15 former soviet republics. Cotton, grain, fruits, grapes, vegetables, cattle, sheep, and goats are the main agriculture products. Agricultural imports have decreased at an annual rate of 8.7 percent from 1992 to 2002. Main imported agricultural commodities include sugar, wheat, wheat flour, soya beans oil, beef, and veal. Over the same period, agricultural exports have grown at 2.1 percent annually. Cotton lint is the main export followed by fruit juice, onion, grapes, and dried fruits.
UZBEKISTAN
|
Land Use (2002) |
Total area (41 424 000 ha) |
|
Population (2002) |
Total population (25 705 000) |
|
GDP/GNI(2003) |
Total GDP (US$9 949 million) |
|
Agricultural Trade (2002) |
Imports (US$198 million) |
|
Nutrition (2000-2002) |
Per caput DES (2 270 kcal/day) |
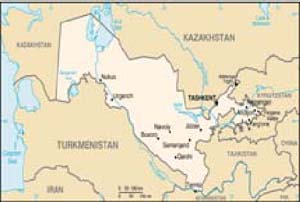
The terrain of Uzbekistan consists of various regions: flat-to-rolling sandy desert with many dunes; broad, flat, intensely irrigated river valleys along Amu Darya and Syr Darya; a shrinking Aral Sea; and semiarid grasslands surrounded by mountainous Tajikistan and Kyrgyzstan in the east. Uzbekistan was one of the poorest republics of the Soviet Union. The economy is based primarily on agriculture and agricultural processing; much of its population is engaged in cotton farming in small rural communities. Uzbekistan is a major producer and exporter of cotton (roughly 45 percent of total exports). It also is a major producer of gold with the largest open-pit gold mine in the world and has substantial deposits of copper, strategic minerals, gas and oil. Real GDP growth in 2003 was estimated at 0.3 percent. Agriculture and the agro-industrial sector contribute more than 34 percent to Uzbekistan’s GDP. Uzbekistan also produces significant amounts of silk, fruit and vegetables. Agricultural productivity is low, with many farmers focusing on producing fruits and vegetables on small plots of land. Agricultural imports have decreased at an annual rate of 13.5 percent from 1992 to 2002. Main imported agricultural commodities include sugar, soybeans, paddy rice, tea and dry skim milk. Over the same period, agricultural exports have also declined at 3.2 percent annually. Cotton lint is the main export followed by tomatoes, apples, grapes and soya bean cakes.
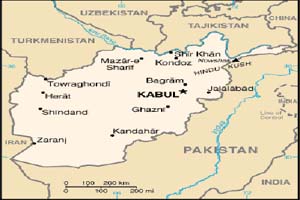
AFGHANISTAN
|
Land Use (2002) |
Total area (65 209 000 ha) |
|
Population (2002) |
Total population (22 930 000) |
|
GDP/GNI(2003) (UNDP est.) |
Total GDP (US$1.72 billion) |
|
Agricultural Trade (2002) |
Imports (US$307.6 million) |
|
Nutrition (2000-2002) |
Per caput DES (NA) |
Afghanistan is a country of rugged mountains and arid plains, which become deserts in the southwest. It has a wealth of natural resources, including extensive deposits of natural gas, petroleum, coal, copper, chromites, talc, barites, sulfur, lead, zinc, iron ore, salt, and precious and semiprecious stones. Agricultural production is constrained by an almost total dependence on erratic winter snows and spring rains for water; irrigation is primitive. The main agriculture products are wheat, corn, barley, rice, cotton, fruit, nuts, karakul pelts, wool and mutton. The economy has traditionally been dominated by agriculture, which accounted for 52 percent of the GDP and employed around 66 percent of the workforce in 2002. Relatively little use is made of machines, chemical fertilizers or pesticides. Years of fighting left former cultivated lands uncultivated and yields have almost dropped by 35 percent leading to persistent food shortages and an increase of food imports. Four consecutive recent years of drought brought a food crisis to Afghanistan. Official statistics have been non-existent since the fall of the government in 1992. One of the largest sectors of the economy is opium poppy cultivation and processing. According to UNDCP, in 2002 crop year Afghanistan accounted for three-quarters of the world’s heroine production.
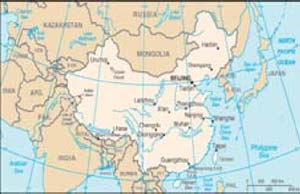
CHINA

|
Land Use (2002) |
Total area (932 742 000 ha) |
|
Population (2002) |
Total population (1 302 307 000) |
|
GDP/GNI(2003) |
Total GDP (US$1 237 145 million) |
|
Agricultural Trade (2002) |
Imports (US$24 390.5 million) |
|
Nutrition (2000-2002) |
Per caput DES (2 960 kcal/day) |
China is the world’s fourth largest country; its terrain is mostly mountains, high plateaus and deserts in the west; plains, deltas, and hills in the east. China is endowed with various natural resources including coal (the world’s largest production volume), iron ore, petroleum, natural gas, mercury, tin, tungsten, antimony, manganese, molybdenum, vanadium, magnetite, aluminum, lead, zinc and uranium. In late 1978 the Chinese leadership began moving the economy from a sluggish, centrally planned economy to a more market-oriented system. In 2002, with its 1.3 billion people but a GDP of just US$4 400 per capita, China stood as the second-largest economy in the world after the United States. Agriculture is the most important economic activity, providing a livelihood for over 66 percent of the labour force for the country with the world’s largest population. Main agricultural products are rice, wheat, potatoes, sorghum, peanuts, tea, millet, barley, cotton and oilseed. The country also produces pork and fish. Agricultural imports have grown at an annual rate of 2.2 percent from 1992 to 2002. Soybeans are the main imported agricultural commodity, followed by palm oil, wool, fish meal, natural rubber and cattle hides. Over the same period, agricultural exports have declined by 0.7 percent annually. Maize, prepared food, prepared vegetables and fruits, garlic, paddy rice and tea are the main agricultural exports.
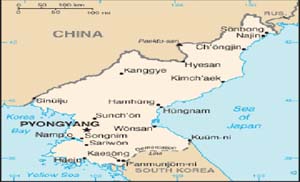
DPR KOREA

|
Land Use (2002) |
Total area (12 041 000 ha) |
|
Population (2002) |
Total population (22 541 000) |
|
GDP/GNI(2003) |
Total GDP(NA) GNI per capita (NA) |
|
Agricultural Trade (2002) |
Imports (US$329.1 million) |
|
Nutrition (2000-2002) |
Per caput DES (2 140 kcal) |
DPR Korea occupies the northern half of the Korean peninsula; it borders China and Russia to the north and the Republic of Korea across the demilitarized zone. Mountains, uplands and forests cover 75-80 percent of the total area, leaving barely 20 percent to cultivable plains and lowlands, mostly in the west, plus a strip along the east coast. DPR Korea is well endowed with a range of minerals: coal, lead, tungsten, zinc, graphite, magnesite, iron ore, copper, gold and pyrites. Agriculture cooperatives were created in the mid-1950s and with the use of modern technology doubled harvests between 1966 and 1984. Yields have since fallen. Only a few areas are suited to agriculture and the drive for food self-sufficiency in hilly terrain led to terracing and soil exhaustion. Since 1995, natural disasters have affected agriculture virtually every year with varying degrees of severity. Imports of much needed agricultural inputs such as fertilizer, pesticides, plastic sheeting, spare parts for machinery, tires for tractors and trucks, and fuel have been limited. Agricultural imports have grown at an annual rate of 1.8 percent from 1992 to 2002. Paddy rice is the main agricultural import, followed by wheat and flour, maize, soya bean and cake, and pulses. Mushrooms, straw, fruit, fish products and raw silk are the main agricultural exports.
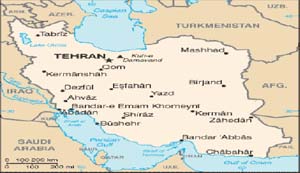
IRAN (ISLAMIC REP. OF)

|
Land Use (2002) |
Total area (163 620 000 ha) |
|
Population (2002) |
Total population (68 070 000) |
|
GDP/GNI(2003) |
Total GDP (US$107 522 million) |
|
Agricultural Trade (2002) |
Imports (US$2 106.3 million) |
|
Nutrition (2000-2002) |
Per caput DES (3 070 kcal/day) |
The terrain of Iran mostly consists of desert and mountains. Natural resources are petroleum, natural gas and some mineral deposits. Main agriculture products are wheat, rice, other grains, sugar beets, fruits, nuts, cotton, dairy products, wool and caviar. Historically an agricultural society, Iran achieved significant industrialization and economic modernization by the 1970s, but the pace of growth slowed dramatically until after the end of the war with Iraq. The oil sector’s share of GDP declined from 30-40 percent in the 1970s to 10-20 percent, mainly as a result of war damage to production facilities; oil revenue still provides some 80 percent of export earnings. State investment, large-scale irrigation schemes and wider production of export-based agricultural items such as dates, flowers and pistachios, made agriculture Iran’s fastest growing sector over much of the 1990s. Production was reduced significantly by severe drought from 1999-2001, leading to heavy losses in livestock and cereal production. After a strong recovery Iran appears within reach of food self-sufficiency. Agriculture remains one of the largest employers, accounting for about 26 percent of all jobs and 12 percent of GDP. Agricultural imports have grown at an annual rate of 0.0 percent from 1992 to 2002. Wheat is the main agricultural import, followed by soya bean oil and cake, paddy rice, sugar and maize. Over the same period, agricultural exports have increased at 3.1 percent annually. Pistachios, raisins, peas, spices, almonds and dates are the main agricultural exports.
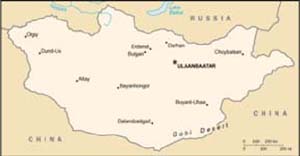
MONGOLIA

|
Land Use (2002) |
Total area (156 650 000 ha) |
|
Population (2002) |
Total population (2 559 000) |
|
GDP/GNI(2003) |
Total GDP (US$1 262 million) |
|
Agricultural Trade (2002) |
Imports (US$125.1 million) |
|
Nutrition (2000-2002) |
Per caput DES (2 240 kcal/day) |
Almost 90 percent of the land area is pasture or desert wasteland of varying usefulness; and 9 percent is forested. Of the arable land, 81 percent is designated as pasture land, where camels, horses, cattle, sheep and goats are raised. The severe continental climate restricts other agricultural activities. Water is scarce, and the growing season lasts no more than 100 days. Land quality is also adversely affected by desertification (which affects 30 percent of pasture), and by overgrazing (especially by goats). Mongolia is rich in minerals, with oil reserves and deposits of other ores such as coal, copper, molybdenum, iron, phosphates, tin, nickel, zinc, wolfram, fluorspar, gold and uranium. Rapid political changes in 1990-91 marked the beginning of efforts to develop a market economy, but these efforts were complicated and disrupted by the dissolution and continuing deterioration of the economy of the former Soviet Union. Mongolian agriculture, which traditionally relies on nomadic, livestock-based agriculture, accounts for 29.7 percent of 2002 GDP and sustains livelihood for about 23 percent of the workforce. GDP growth fell from 3.2 percent in 1999 to 1.3 percent in 2000 as a result of the loss of millions of livestock in bad weather and natural disasters in 2000. Main agriculture products are livestock and its byproducts: hay fodder and vegetables. Agricultural imports have grown at an annual rate of 9.3 percent from 1992 to 2002. Wheat and wheat flour are the main imported agricultural commodities, followed by barley beer, sugar, soya bean oil and paddy rice. Over the same period, agricultural exports have increased by 11.2 percent annually. Combed hair, beef and veal, cattle hides and horse meat are the main agricultural exports.
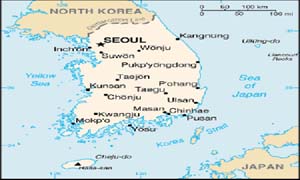
REPUBLIC of KOREA

|
Land Use (2002) |
Total area (9 873 000 ha) |
|
Population (2002) |
Total population (47 430 000) |
|
GDP/GNI(2003) |
Total GDP (US$476 690 million) |
|
Agricultural Trade (2002) |
Imports (US$8 957.8 million) |
|
Nutrition (2000-2002) |
Per caput DES (3 060 kcal) |
Approximately 70 percent of the land area is mountainous and hilly with wide coastal plains in the west and south. Natural resources are limited; coal, tungsten, iron ore, limestone, kaolinite and graphite. Main agriculture products are rice, vegetables and fruit. Until the late 1980s the manufacturing industry accounted for a rising share of GDP, for example, nearly one-third in 1988, compared with only one-quarter in 1973. There was a fall in the share of agriculture, forestry and fishing, from one-quarter to one-tenth, over the same 15-year period. Since 1988, the share of manufacturing in GDP has stabilized around 30 percent, whereas that of agriculture has continued to fall to nearly 4 percent in 2002. Agriculture employs 8.8 percent of the workforce and almost 57 percent of Korean farmers are engaged in rice cultivation. Agricultural imports have grown at an annual rate of 1.1 percent from 1992 to 2002. Maize is the main agricultural import, followed by wheat, cattle hides, beef and veal, food, cotton lint and soybeans. Over the same period, agricultural exports increased by 3.4 percent annually. Food, cigarettes, alcoholic beverage and sugar are the main agricultural exports.
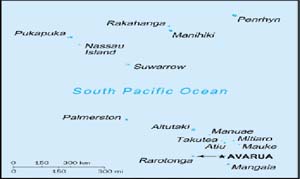
COOK ISLANDS

|
Land Use (2002) |
Total area (23 000 ha) |
|
Population (2002) |
Total population (18 000) |
|
GDP/GNI(2003) |
Total GDP(NA) |
|
Agricultural Trade (2002) |
Imports (US$11.53 million) |
|
Nutrition (2000-2002) |
Per caput DES (NA) |
The Cook Islands consists of two groups of islands (13 inhabited and two uninhabited) extending over 2 million square kilometers, about half of the way from Hawaii to New Zealand. The North Cook Islands are atolls while the South Cook Islands are volcanic and comparatively fertile. The waters surrounding the Cook Islands are believed to contain substantial reserves of manganese, cobalt and other metals. The islands became a British protectorate in 1888. By 1900, administrative control was transferred to New Zealand; in 1965 residents chose self-government in free association with New Zealand. Economic development is hindered by the isolation of the country from foreign markets, the limited size of domestic markets, lack of natural resources, periodic devastation from natural disasters, and inadequate infrastructure. Key economic activities are tourism, pearl farming and the newly emerging fishing sector. Agriculture provides the economic base with major exports made up of copra and citrus fruit. Manufacturing activities are limited to fruit processing, clothing and handicrafts. In 2000 agriculture accounted for about 17 percent of GDP and employed 28.6 percent of the workforce in 2002. Agricultural imports have increased at an annual rate of 0.1 percent from 1992 to 2002. Chicken meat is the country’s main agricultural import, followed by prepared food, beef preparations and beef and veal. Over the same period, agricultural exports (fruit juices) have decreased 9.9 percent annually.
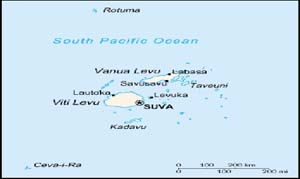
FIJI ISLANDS

|
Land Use (2002) |
Total area (1 827 000 ha) |
|
Population (2002) |
Total population (831 000) |
|
GDP/GNI(2003) |
Total GDP (US$1 878 million) |
|
Agricultural Trade (2002) |
Imports (US$124.07 million) |
|
Nutrition (2000-2002) |
Per caput DES (2 890 kcal/day) |
The Fiji Island group, located about two-thirds of the way from Hawaii to New Zealand, is an archipelago of 332 islands endowed with forest, mineral and fish resources. It is one of the most developed of the Pacific island economies, but Fiji still has a large subsistence sector. Natural resources are timber, fish, gold, copper, offshore oil potential and hydropower. Sugar exports and a growing tourist industry (300 000 to 400 000 tourists annually) are the major sources of foreign exchange. Sugar processing makes up one-third of industrial activity. Agriculture (sugarcane, livestock, forestry and subsistence farming) and fishing remain important, accounting for about 20 percent of GDP in the 1990s, but declining to 16.2 percent by 2002. Sugar is still the most important crop, although its proportion of agricultural GDP fell from 46 percent in 1994 to 29.8 percent in 2001. Timber and fish (mainly tuna) have become increasingly important in recent years. Copra, ginger and coconut oil are also exported. Other crops include bananas, rice and other cereals, vegetables, pineapples and other tropical fruits. Agricultural imports increased at an annual rate of 0.9 percent from 1992 to 2002 while agricultural exports decreased 2.5 percent annually. Wheat is the main agricultural import, followed by mutton and lamb, rice, prepared food and potatoes. Sugar, waters, taro and molasses are the agricultural exports.
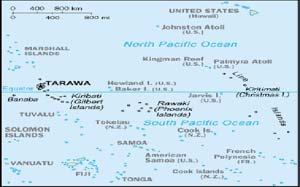
KIRIBATI
|
Land Use (2002) |
Total area (73 000 ha) |
|
Population (2002) |
Total population (87 000) |
|
GDP/GNI(2003) |
Total GDP (US$44 million) |
|
Agricultural Trade (2002) |
Imports (US$12.27 million) |
|
Nutrition (2000-2002) |
Per caput DES (2 850 kcal/day) |
Kiribati consists of three main island groups scattered over an expanse of ocean roughly halfway between Hawaii and Australia. The three main groupings are the Gilbert Islands, Phoenix Islands, and Line Islands. Kiribati has little or no soil, and rainfall is variable, giving only limited opportunities for agricultural development. The greatest development potential lies in the exploitation of marine resources within the 200-mile exclusive economic zone. Covering about 3 million square kilometers, it is one of the world’s largest fishing zones. The per capita GNP of less than US$1 000 makes it one of the poorest countries in the world. Phosphates had been profitably exported from Banaban Island since the turn of the century, but the deposits were exhausted in 1979. The economy now relies heavily on income from abroad, from the sale of fishing licenses, development assistance, worker remittances and tourism. Given its limited domestic resources, the country depends on imports for most of its basic food needs as well as manufactured goods. Most islanders engage in subsistence activities ranging from fishing to the growing of food crops like bananas, breadfruit and papaya. Kiribati’s principal trading partner is Australia. Agricultural imports increased at an annual rate of 2.1 percent from 1992 to 2002. Wheat flour is the main agricultural import, in addition to sugar and tobacco products. In the same period, agricultural exports decreased 2.0 percent annually. The leading export is the coconut product copra, which accounts for about two-thirds of export revenue. Other exports include pet fish, shark fins and seaweed.
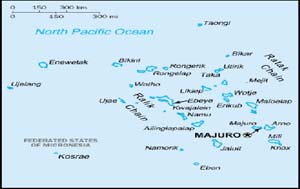
MARSHALL ISLANDS

|
Land Use (2002) |
Total area (18 000 ha) |
|
Population (2002) |
Total population (52 000) |
|
GDP/GNI(2003) |
Total GDP (US$108 million) |
|
Agricultural Trade (2002) |
Imports (US$0.00 million) |
|
Nutrition (2000-2002) |
Per caput DES (NA) |
The Marshall Islands are comprised of 29 atolls and five major islands, which form two parallel groups-the “Ratak” (sunrise) chain and the “Ralik”(sunset) chain, containing 29 coral atolls, and a total of 1 152 islands and islets. Natural resources are marine resources, including mariculture and deep seabed minerals. The economy is heavily dependent on payments from the United States (more than 80 percent of government revenue) and foreign aid from a variety of sources. Income from the sale of fishery rights totaled around US$3 million in fiscal year 2001. The main agriculture product is copra (dried coconut meat); taro and breadfruit are subsistence crops. Subsistence farming is the main economic activity. Soil quality is generally poor, but fruit and vegetables, coconuts, pandanus taro, and breadfruit are produced for local consumption. The country’s export base is narrow, with copra and coconut accounting for 90 percent of exports. A wide variety of goods, including foodstuffs, consumer goods, machinery and petroleum products are imported.
MICRONESIA, FED. STATES OF

|
Land Use (2002) |
Total area (NA) |
|
Population (2002) |
Total population |
|
GDP/GNI(2003) |
Total GDP |
|
Agricultural Trade (2002) |
Imports (US$13.29 million) |
|
Nutrition (2000-2002) |
Per caput DES (NA) |
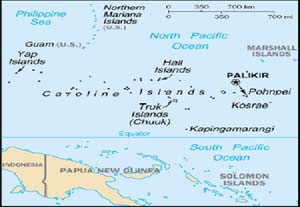
The Federated States of Micronesia (FSM) consists of 607 islands extending 1 800 miles across the archipelago of the Caroline Islands east of the Philippines. The four constituent island groups are Yap, Chuuk, Pohnpei and Kosrae. The economy is heavily dependent on foreign aid with the United States providing around US$2 billion in grants and services from 1986 to 2001. Total official development assistance from all sources was more than US$100 million in 2001, with nearly 90 percent of that total coming from the United States. The fishing industry is highly important. Foreign commercial fishing fleets pay over US$20 million annually for the right to operate in FSM territorial waters (nearly 30 percent of domestic budgetary revenue). The tourist industry is present but has been hampered by a lack of infrastructure. Farming is mainly subsistence, and its importance is declining. The principal crops are coconuts, bananas, betel nuts, cassava and sweet potatoes. Copra and coconut oil are stable exports, but are produced in small quantities. The main agriculture imports are paddy rice, barley beer, beef, chicken and sugar.
NAURU

|
Land Use (2002) |
Total area (2 000 ha) |
|
Population (2002) |
Total population (13 000) |
|
GDP/GNI(2003) |
Total GDP(NA) |
|
Agricultural Trade (2002) |
Imports (US$2 million) |
|
Nutrition (2000-2002) |
Per caput DES (NA) |
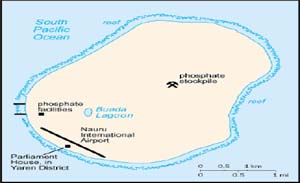
Nauru is a small oval-shaped island in the western Pacific Ocean, located just 42 kilometers south of the Equator. It is one of three great phosphate rock islands in the Pacific Ocean and its economy depends almost entirely on declining phosphate deposits. The island is surrounded by a coral reef, exposed at low tide and dotted with pinnacles. The reef is bounded seaward by deep water, inside by a sandy beach. The only parts of the island suitable for agriculture are the narrow coastal strip and the area surrounding the inland Buada Lagoon. Coconut and pandanus palms grow around the Lagoon. Nauru now lacks money to perform many of the basic functions of government. There is a small amount of agricultural production for domestic consumption but most food, like all other necessities, has to be imported. Owing to porous soil and uncertain rainfall, production is limited to small quantities grown by individuals for home consumption. A few food crops are grown on the inland plateau. Fishing is popular and provides a limited amount of food although commercial fishing is underdeveloped. Main agriculture imports are pig meats, beef, barley beer, dry whole milk, mutton and lamb, and sugar.
NIUE

|
Land Use (2002) |
Total area (26 000 ha) |
|
Population (2002) |
Total population (2 000) |
|
GDP/GNI(2003) |
Total GDP(NA) |
|
Agricultural Trade (2002) |
Imports (US$0.79 million) |
|
Nutrition (2000-2002) |
Per caput DES (NA) |
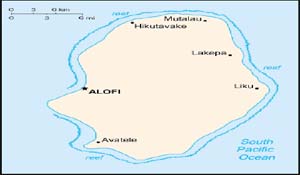
Niue is one of world’s largest coral islands and is located in the South Pacific Ocean, east of Tonga. Its terrain is steep limestone cliffs along the coast and central plateau. Main natural resources are fish and arable land. Niue is self-governing in free association with New Zealand since 1974. The economy suffers from the typical island problems of geographic isolation, few resources, and a small population. The agricultural sector consists mainly of subsistence gardening, although some cash crops are grown for export. Agricultural imports have decreased at an annual rate of 1.4 percent from 1992 to 2002. Pastry and chicken meat are the main agricultural imports, followed by beef and barley beer. Over the same period, agricultural exports have increased 7.6 percent annually. Taro and bananas are the agricultural exports.
PALAU

|
Land Use (2002) |
Total area (46 000 ha) |
|
Population (2002) |
Total population (20 000) |
|
GDP/GNI(2003) |
Total GDP (US$130 million) |
|
Agricultural Trade (2002) |
Imports (NA) |
|
Nutrition (2000-2002) |
Per caput DES (NA) |
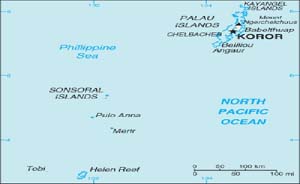
The Republic of Palau consists of eight principal islands and more than 250 smaller ones lying roughly 500 miles southeast of the Philippines. The islands of Palau constitute part of the Caroline Islands chain. About 70 percent of the Palauan population lives in the capital city of Koror on Koror Island. Its terrain varies from the mountainous main island to smaller, reef-rimmed coral islands. Palau has among the highest living standards in the Pacific, with GDP per capita standing at around US$7 140 in 2002. However, rapid population growth and a stagnant economy have seen per capita incomes fall over the last five years and income disparities widen. Tourism and the service sectors are Palau’s main industries contributing more than 80 percent of GDP and employing three-quarters of the work force. Agriculture is mainly on a subsistence level employing 22.2 percent of the workforce and contributing only 3.9 percent to GDP in 2002. The principal crops are coconuts, root crops and bananas.
PAPUA NEW GUINEA

|
Land Use (2002) |
Total area (45 286 000 ha) |
|
Population (2002) |
Total population (5 586 000) |
|
GDP/GNI(2003) |
Total GDP (US$2 793 million) |
|
Agricultural Trade (2002) |
Imports (US$179.94 million) |
|
Nutrition (2000-2002) |
Per caput DES (NA) |
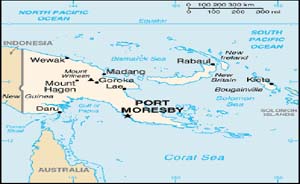
Papua New Guinea (PNG) is a group of islands including the eastern half of the island of New Guinea. Its terrain is mostly mountainous, with coastal lowlands and rolling foothills; less than one-third of the total land area is suitable for cultivation. Forests and woodland cover more than 80 percent of PNG’s land area. PNG has rich natural resources, including, gold, copper, silver, oil and natural gas. Mineral deposits, mostly copper and gold, account for 72 percent of export earnings. The country is endowed with abundant forest and fishery resources. Agriculture is the country’s important economic activity, providing a livelihood for 73.2 percent of the population and accounting for about 23 percent of the total GDP. Main agricultural products include coffee, cocoa, coconuts, palm kernels, tea, rubber, sweet potatoes, fruit, vegetables, poultry and pork. Agricultural imports have decreased by 2.6 percent per annum from 1992 to 2002. The main agricultural imports include rice, meats (e.g. mutton, lamb and beef), wheat and palm oil. Over the same period, agricultural exports have grown at 0.2 percent annually. Palm oil, coffee and cocoa are the country’s three major agricultural exports.
SAMOA

|
Land Use (2002) |
Total area (283 000 ha) |
|
Population (2002) |
Total population (176 000) |
|
GDP/GNI(2003) |
Total GDP (US$261 million) |
|
Agricultural Trade (2002) |
Imports (US$26.68 million) |
|
Nutrition (2000-2002) |
Per caput DES (2 900 Kcal/day)) |
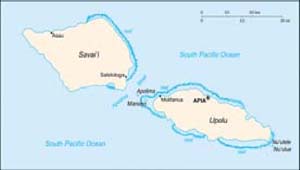
Samoa consists of the two large islands of Upolu and Savai’i and seven small islets and is located about halfway between Hawaii and New Zealand. Its terrain is mountainous with a narrow coastal plain. The economy is based on agriculture, with subsistence farming being the primary economic activity. The primary sector, agriculture, forestry and fishing, employs nearly two-thirds of the labor force and produces approximately 17 percent of GDP. About 34 percent of the workforce engages in subsistence agriculture. The main food crops are coconuts, breadfruit, bananas, cocoa and taro. Tourism is also significant. The government is seeking to improve productivity in agriculture through improved farming systems and by planting species such as hybrid coconuts. There has been a substantial expansion of the fishing industry in recent years. Fresh fish accounted for 63 percent of total export earnings in 2002. Agricultural imports have decreased at an annual rate of 0.5 percent from 1992 to 2002. Chicken meat is the country’s main imported agricultural commodity, followed by mutton and lamb, prepared food, sugar and wheat flour. Over the same period, agricultural exports have decreased 0.2 percent annually. Fish meal, coconuts, fruit juice, taro and copra are the country’s main agricultural exports.
SOLOMON ISLANDS
|
Land Use (2002) |
Total area (2 799 000 ha) |
|
Population (2002) |
Total population (463 000) |
|
GDP/GNI(2003) |
Total GDP (US$240 million) |
|
Agricultural Trade (2002) |
Imports (US$18.44 million) |
|
Nutrition (2000-2002) |
Per caput DES (2 240kcal/day) |
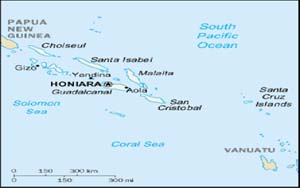
The Solomon Islands form an archipelago in the Southwest Pacific about 1 900 kilometers northeast of Australia. The terrain ranges from ruggedly mountainous islands to low-lying coral atolls. The Solomon Islands stretch for over 1 450 kilometers southeast from Papua New Guinea across the Coral Sea to Vanuatu. Natural resources are forests, fish, agricultural land, marine product, and gold. Main agriculture products are copra, cocoa, palm oil, palm kernels and subsistence crops of yams, taro, bananas and pineapple. More than 72 percent of its labor force is engaged in subsistence farming and fishing. Forests and woodland cover 84.8 percent of the total land area, which explains why the logging industry is the dominant sector within the economy. Coconut products are traditionally the main agricultural output. Other important cash crops and exports include copra and palm oil. Tourism, particularly diving, is an important service industry for Solomon Islands. Agricultural imports have grown at an annual rate of 3.3 percent from 1992 to 2002. Prepared food is the main agricultural import, followed by wheat, sugar, barley beer and cigarettes. Over the same period, agricultural exports have increased at 5.3 percent annually. Oil palm, copra, coconut oil and cocoa beans are the main agricultural exports.
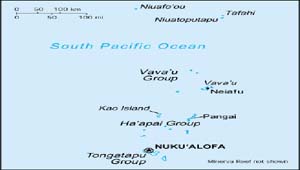
TONGA

|
Land Use (2002) |
Total area (72 000 ha) |
|
Population (2002) |
Total population (103 000) |
|
GDP/GNI(2003) |
Total GDP (US$136 million) |
|
Agricultural Trade (2002) |
Imports (US$24.11 million) |
|
Nutrition (2000-2002) |
Per caput DES (NA) |
Tonga is an oceanic archipelago about two-thirds of the way from Hawaii to New Zealand. It has a small, open economy with a narrow export base in agricultural goods. Squash, coconuts, bananas and vanilla beans are the main crops, and agricultural exports make up two-thirds of total exports. The country must import a high proportion of its food, mainly from New Zealand. Tourism is the second largest source of hard currency earnings following remittances. The country remains dependent on external aid and remittances from Tongan communities overseas to offset its trade deficit. Agriculture accounted for around 28 percent of real GDP in fiscal year 2001/02 (July-June). Agricultural imports have grown at an annual rate of 1.9 percent from 1992 to 2002. Mutton and lamb are the main agricultural imports, followed by chicken meat, non-alcoholic beverages and wheat flour. Over the same period, agricultural exports have decreased at 3.8 percent annually. Squash, vanilla, coconuts, roots and tubers are the main agricultural exports.
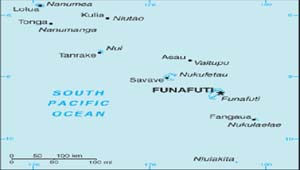
TUVALU

|
Land Use (2002) |
Total area (3 000 ha) |
|
Population (2002) |
Total population (10 000) |
|
GDP/GNI(2003) |
Total GDP $12.2 million (2000 est.) |
|
Agricultural Trade (2002) |
Imports (US$2.16 million) |
|
Nutrition (2000-2002) |
Per caput DES (NA) |
Tuvalu consists of a densely populated, scattered group of nine coral atolls with poor soil, located about one-half of the way from Hawaii to Australia. The country has no known mineral resources and few exports. Subsistence farming and fishing are the primary economic activities. Fewer than 1 000 tourists, on average, visit Tuvalu annually. The cash economy depends largely on remittances from citizens working abroad (many as merchant seamen) and government spending. Government finances are supported by foreign aid and the Tuvalu Trust Fund, a publicly owned investment vehicle established in 1987, with capital mainly provided by Australia (about one-third), the UK and New Zealand, with contributions from Japan and South Korea. Rice is the country’s main agricultural import, followed by barley beer, prepared meat, chicken meat and wheat flour. Copra is the main agricultural export.
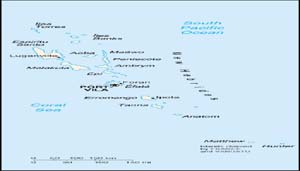
VANUATU
|
Land Use (2002) |
Total area (1 219 000 ha) |
|
Population (2002) |
Total population (207 000) |
|
GDP/GNI(2003) |
Total GDP (US$234 million) |
|
Agricultural Trade (2002) |
Imports (US$15.77 million) |
|
Nutrition (2000-2002) |
Per caput DES (2 570 kcal/day) |
Vanuatu is a ‘Y’ shaped archipelago that comprises 80 islands, northeast of Sydney, Australia and southwest of Honolulu. The two largest islands, Espiritu Santo (or Santo) and Malakula, account for nearly one-half of the total land area. They are volcanic, with sharp mountain peaks, plateaus, and narrow coastal plains. Natural resources are forests, agricultural land, and marine resources. Main agriculture products are copra, cocoa, coffee, cattle and timber. The economy is dominated by subsistence agriculture and services, mostly those associated with tourism and Vanuatu’s status as an offshore financial centre. More than 36 percent of the population depends on subsistence agriculture, with the agricultural sector as a whole accounting generally for around 20 percent of real GDP. The services sector normally accounts for around two-thirds of GDP. Over 35 percent of the workforce is engaged in agricultural activities that range from subsistence farming to smallholder farming of coconuts and other cash crops. Copra is by far the most important cash crop (making up more than 35 percent of the country’s exports), followed by timber, beef and cocoa. Kava root extract exports also have become important. Agricultural imports have decreased at an annual rate of 0.5 percent from 1992 to 2002. Paddy rice is the main agricultural import, followed by sugar, wheat flour, meat, cigarettes and alcoholic beverages. Over the same period, agricultural exports have decreased at 2.9 percent annually. Coconut oil, beef and veal, copra and coconuts are the main agricultural exports.
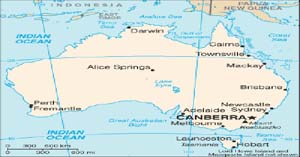
AUSTRALIA

|
Land Use (2002) |
Total area (768 230 000 ha) |
|
Population (2002) |
Total population (19 544 000) |
|
GDP/GNI(2003) |
Total GDP (US$410 590 million) |
|
Agricultural Trade (2002) |
Imports (US$3 229.2 million) |
|
Nutrition (2000-2002) |
Per caput DES (3 090 kcal/day) |
Australia has an abundance of mineral resources and of land suitable for agriculture. Its terrain is varied, but generally low-lying. Urban centres occupy a relatively small proportion of the continent, and the population is concentrated in a narrow strip along the eastern seaboard. Around 61 percent of the arable land is used for agricultural purposes, and 5 percent is occupied by forests. Australia has substantial reserves of economically important minerals: lead, iron ore, bauxite, zinc, ilmenite, rutile and zircon, and uranium reserves. At the beginning of the 1950s agriculture accounted for about 25 percent of Australia’s GDP, but in fiscal year 2001/02 (July-June) agriculture (including forestry and fishing) accounted for only 3.8 percent of GDP. Although mining and agriculture are small in terms of Australia’s GDP, they account for a large share of exports. In 2002/03 rural and mineral exports (including processed goods) accounted for around two-thirds of total merchandise exports. Agricultural imports have grown at an annual rate of 5.6 percent from 1992 to 2002. Prepared food is the main agricultural import, followed by alcoholic beverages, cheese and pig meat. Over the same period, agricultural exports have increased at 3.9 percent annually. Wheat, beef and veal, wool, wine and cotton lint are the main agricultural exports.
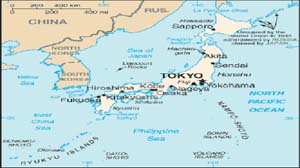
JAPAN
|
Land Use (2002) |
Total area (36 450 000 ha) |
|
Population (2002) |
Total population (127 478 000) |
|
GDP/GNI(2003) |
Total GDP (US$3 978 782 million) |
|
Agricultural Trade (2002) |
Imports (US$33 627.4 million) |
|
Nutrition (2000-2002) |
Per caput DES (2 780 kcal/day) |
The Japanese archipelago, which includes some 7 000 islands, stretches for around 3 000 km from north to south through several climatic zones. Some 70 percent of Japan’s landmass is mountainous terrain that is essentially uninhabitable, so the residual areas are used intensively. Japan has few natural resources and a negligible amount of mineral resources and fish. The main agriculture products are rice, vegetables, fruit, milk, meat and silk. Only 13 percent of Japan’s land is suitable for cultivation. With per hectare crop yields among the highest in the world, Japan maintains an overall agricultural self-sufficiency rate of about 50 percent on fewer than 5.6 million cultivated hectares. Japan normally produces a slight surplus of rice but imports large quantities of wheat, sorghum and soybeans. Manufacturing has been the mainstay of Japan’s economy since the 1960s and today accounts for just over 20 percent of GDP. Although in economic terms agriculture is becoming less important (accounting for 1.4 percent of GDP in 2001 and employing 3.6 percent of the workforce), it remains influential in politics due to the electoral system. Agricultural imports have grown at an annual rate of 0.1 percent from 1992 to 2002. Pork is the main agricultural import, followed by cigarettes, maize, beef and veal, soybeans and wheat. Over the same period, agricultural exports increased at 2.1 percent annually. Prepared food, cigarettes, wheat flour, fruit seeds, fruit, food wastes and pastry are the main agricultural exports.
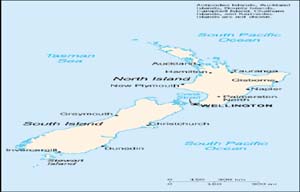
NEW ZEALAND

|
Land Use (2002) |
Total area (26 799 000 ha) |
|
Population (2002) |
Total population (3 846 000) |
|
GDP/GNI(2003) |
Total GDP (US$58 178 million) |
|
Agricultural Trade (2002) |
Imports (US$1 304.6 million) |
|
Nutrition (2000-2002) |
Per caput DES (3 220 kcal/day) |
New Zealand is comprised of two main islands (the North and South Islands) and smaller outlying islands in the southwest Pacific Ocean. New Zealand has a mild and temperate climate which is well suited to pastoral agriculture and horticulture (over half of the total land area), with an additional 27.4 percent covered by forest. Terrain is highly varied, from snowcapped mountains to lowland plains. Natural resources are timber, natural gas, iron sand and coal. Agriculture products are meat, dairy products, and forestry products. The agriculture, forestry and fishing sectors directly accounted for only around 8 percent of GDP in 2002 employing nearly 9 percent of the workforce. Leading agricultural exports include meat, dairy products, forest products, fruit and vegetables, fish and wool. Grasslands farming is the basis of its agricultural system since around half of its total land area is used for pastoral farming. Wheat, barley and peas are the major arable crops and are grown mainly in the Canterbury region. Fishing is a major export industry and earned NZ$1.2 billion, 4.2 percent of total exports, in 2002/03. Agricultural imports have grown at an annual rate of 5.7 percent from 1992 to 2002 and reached US$1.1 billion in 2001. Prepared food is the main agricultural import, followed by wine, wheat and alcoholic beverages. Over the same period, agricultural exports have increased by 2.3 percent annually. Mutton and lamb, dry whole milk, beef and veal, butter, kiwi fruit and wool are the main agricultural exports.
![]()
![]()
![]()