![]()
![]()
![]()
The Asia-Pacific region is the world's largest producer of fish, from both aquaculture and capture fishery sectors. In 2002, this amounted to 46.9 million tonnes from aquaculture and 44.7 million tonnes from capture fisheries. However, it is common knowledge in the region that production from many small-scale operators, especially in inland areas, is not recorded. As expected, there is considerable variation in general trends among the five main sub-regions of Asia and the Pacific. Most of the growth in both aquaculture and capture fisheries has come from China, South Asia and Southeast Asia. Areas such as Japan, Korea DPR and Korea RO have shown a steady reduction in the supply of capture fish and consistent production in aquaculture. Oceania's production is minor compared with the other sub-regions, but continues to increase, although many of the fisheries in the Pacific small island developing States that operate at a subsistence level are not recorded.
Production from the Asia-Pacific region's capture fisheries totalled 44.7 million tonnes in 2002. The region has been the world's largest producer of fish for decades, with 48.0 percent of global production in 2002. In inland waters, the regional share has increased to 64.7 percent. Of the top 10 producers of capture fish in the world, five States came from the Asia-Pacific area, namely China PR (1st), Indonesia (4th), Japan (5th), India (7th) and Thailand (9th). Total capture fisheries production has steadily increased since 1950, mainly from the marine capture fisheries sector (Figure 1).
China PR remains by far the largest producer in the region with a reported production of 16.3 million tonnes in 2002, representing 36 percent of regional production. Chinese production is more than three times greater than that of Indonesia, which is the second largest producer in the region. Because of its enormous scale of production and remarkably high growth rate, China[7] is treated as a distinct sub-region in this review.
Total capture fishery production from marine waters for all the sub-regions, except China, peaked in 1989 at 24.7 million tonnes and gradually declined to 24.0 million tonnes in 2002. The sub-region grouped as "other Asia" was once the top contributor in the area, but has experienced a serious and continuous decline in production since 1988. In contrast, Southeast Asia has constantly increased production and maintained the largest share of the APFIC region since 1993.
In inland waters, capture fisheries production[8] has generally increased and its reported growth in the late 1990s was remarkable. However, this period also coincided with a change in the way several States estimated their inland fisheries production and it is likely that earlier production was underestimated. Even today, inland production figures may not reflect the true situation - for example, Coates[9] estimated that production from Southeast Asia was possibly under-reported by a factor of between 2.5 and 3.6.
Total inland production of the region in 2002 was reported as 3.4 million tonnes. South Asia and Southeast Asia contributed the greatest production compared with other sub-regions (Figure 2).
|
Top 10 producers of capture fish in 2002 were China, Peru, USA, Indonesia, Japan, Chile, India, Russian Federation, Thailand, and Norway, of these five are in the Asia-Pacific region. |
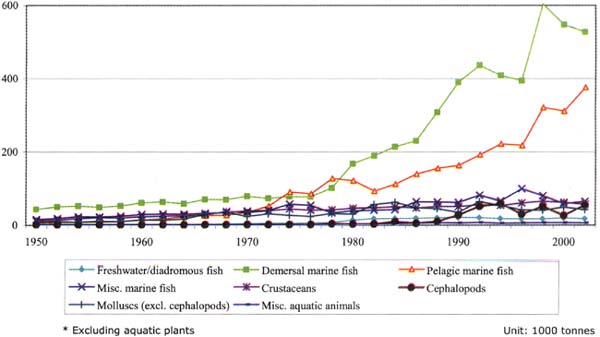
Total capture fishery production, however, masks considerable differences in the trends of the main species groups (Figure 3). Demersal marine fish were at the highest level of production of 5.2 million tonnes as early as 1974 and then declined to the lowest level at 3.7 million tonnes in 1983. Production then gradually recovered to 4.4 million tonnes in 2002.
Figure 1
Trends in global capture
production
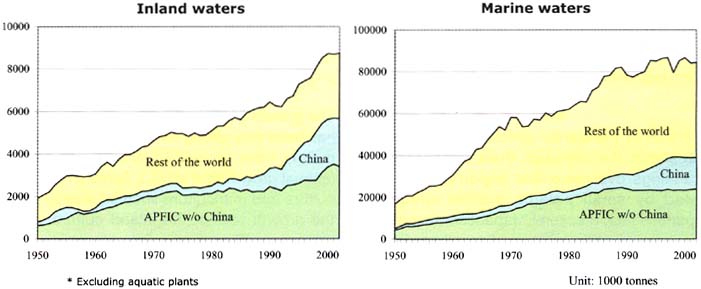
Figure 2
Trends in capture production by
sub-region outside China
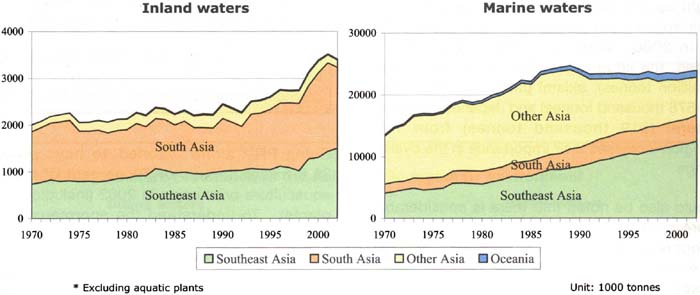
Figure 3
Trends in capture production by species
group outside China
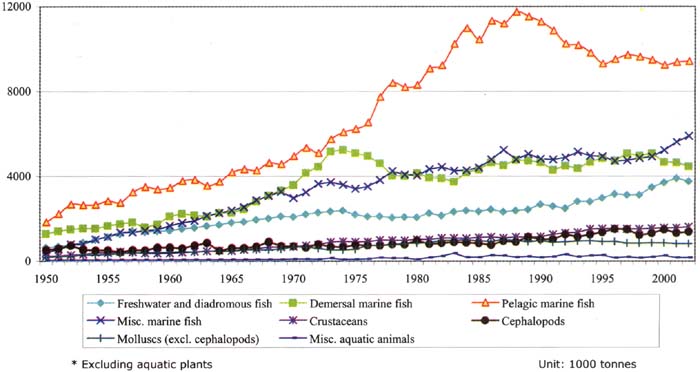
Pelagic marine fish followed the same upward and then downward trends, peaking at 11.7 million tonnes in 1988 and subsequently decreasing to the production levels of the early 1980s by 2002 (9.4 million tonnes). Other species groups such as freshwater/diadromous fish, crustaceans and cephalopods have grown steadily while mollusc production has levelled off at around 900 thousand tonnes.
A comparison of the top 20 species in the region (Table 2) shows that although there are changes in the rankings over time, the region's catch is dominated by small pelagic marine species (e.g. Japanese jack mackerel, Japanese anchovy, chub mackerel, Pacific saury, Indian oil sardine, Indian mackerels and scads).
It is significant that the reduction in catch of single dominant species such as Alaska pollock[10] in the early 1970s and chub mackerel[11] in the late 1970s brought up the relative ranking of large pelagic marine species (i.e. skipjack tuna and yellowfin tuna) in 2000. When the Chinese figures are included, the large catches of largehead hairtail (1.3 million tonnes), akiami paste shrimp (Acetes spp.) (578 thousand tonnes) and Japanese Spanish mackerel (519 thousand tonnes) from this sub-region increases their importance in the overall rankings
It should also be noted that there is considerable capture production not identified to the species level but recorded as marine/freshwater fishes nei (not elsewhere included), marine/freshwater molluscs nei and marine/freshwater crustaceans nei. The quantity reported under these categories has been increasing significantly in recent years, which indicates a worrying trend in available statistical quality. In 2002, 16.8 million tonnes of capture production was not identified to species, order, or family level.
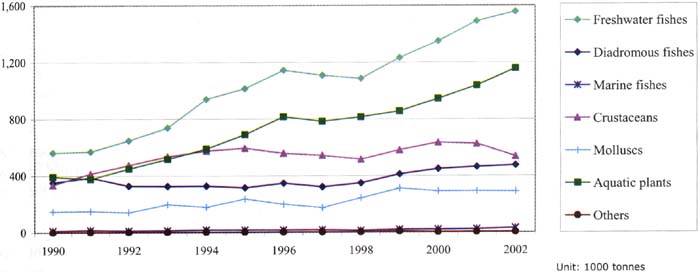
The Asia-Pacific region is by far the world's largest contributor to world aquaculture, producing 46.9 million tonnes[12] or 91 percent of global aquaculture production. In terms of production by value, the region's share is slightly less, at 82 percent of total value of global aquaculture production. Even when aquatic plant production is excluded (the vast majority of which originates in the Asia-Pacific area), the region still remains the dominant aquaculture production area, representing 89 percent of global aquaculture production by quantity and 80 percent by value.
The growth of aquaculture production in the region has been very strong for the last ten years, resulting mainly from increased production from China (annual growth rate of 13.8 percent[13]). Both inland culture and mariculture showed steady growth but the growth rate of the inland culture sector was more rapid (Figure 4).
|
Top 10 aquaculture producer States by quantity (excluding aquatic plants) in 2002 were China PR, India, Indonesia, Japan, Bangladesh, Thailand, Norway, Chile, Viet Nam, and USA. Seven of these are Asian States, dominating the top 6 ranks. By value, China PR, Japan, India, Chile, Thailand, Indonesia, Norway, Viet Nam and Bangladesh are amongst the top 10 producer States. (see Table 3) |
China PR[14] alone reported to have produced 36.6 million tonnes or 79 percent of the world aquaculture production in 2002 (including aquatic plants). To understand the enormous scale of aquaculture production in China, it can be compared with the total fisheries production of Peru, the world second largest fisheries producer after China PR, which was 8.8 million tonnes in 2002 (including both capture and aquaculture). This was still less than one quarter of China's aquaculture production alone. Since China PR is such a predominant producer, the scale of reported production can mask other regional trends; therefore, China[15] will be treated separately and presented as a sub-region in its own right.
Even excluding China, the Asia-Pacific region still remains an important production area for aquaculture, exhibiting steady growth regardless of the culture environment. In particular, inland culture doubled its production from 1854 thousand tonnes in 1990 to 4 478 thousand tonnes in 2002. Such advances far exceed the growth of aquaculture in the rest of the world (Figure 5).
Figure 4
Trends in global aquaculture
production
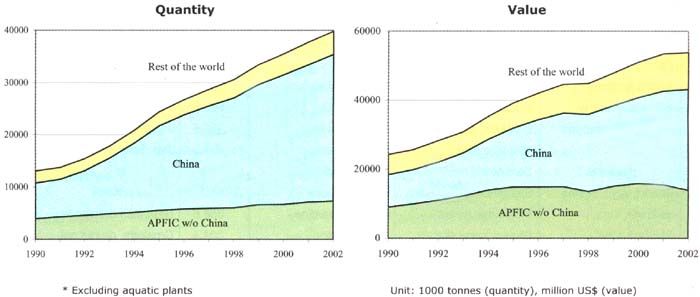
Figure 5
Trends in aquaculture production of the
Asia-Pacific region by environment
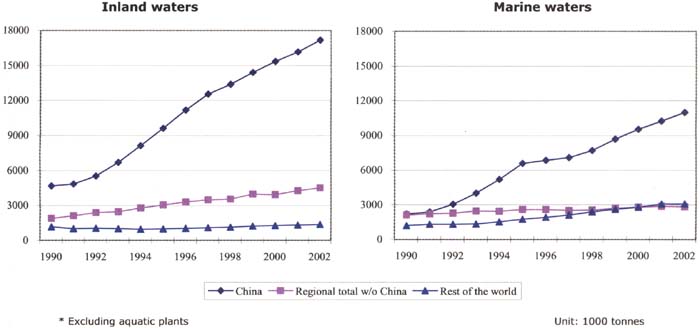
Table 2
Top twenty capture production species in
the Asia-Pacific region
| |
1960 |
1980 |
2000 |
(production) |
2000 with China |
(production) |
|
1 |
Jap. jack mackerel |
Chub mackerel |
Skipjack tuna |
1 333.1 |
Japanese anchovy |
1 853.9 |
|
2 |
Jap. flying squid |
Alaska pollock |
Japanese anchovy |
582.8 |
Largehead hairtail |
1 420.5 |
|
3 |
Japanese anchovy |
Skipjack tuna |
Yellowfin tuna |
572.9 |
Skipjack tuna |
1 417.3 |
|
4 |
Chub mackerel |
Natantian decapods |
Jap. flying squid |
570.4 |
Scads nei |
1 163.5 |
|
5 |
Pacific saury |
Jap. flying squid |
Scads nei |
523.7 |
Chub mackerel |
872.9 |
|
6 |
Alaska pollock |
Japanese anchovy |
Chub mackerel |
522.2 |
Akiami paste shrimp |
594.8 |
|
7 |
Indian oil sardine |
Indian oil sardine |
Natantian decapods |
500.6 |
Yellowfin tuna |
585.6 |
|
8 |
Natantian decapods |
Croakers, drums nei |
Sardinellas nei |
462.5 |
Japanese flying squid |
576.3 |
|
9 |
Scads nei |
Yellowfin tuna |
Croakers, drums nei |
461.5 |
Jap. Spanish mackerel |
553.7 |
|
10 |
Indian mackerel |
Sardinellas nei |
Indian mackerels |
458.1 |
Jellyfishes |
504.4 |
|
11 |
Sharks, rays, skates |
Stolephorus anchovies |
Alaska pollock |
446.2 |
Alaska pollock |
460.0 |
|
12 |
Yellowfin tuna |
Indian mackerels |
Indian oil sardine |
358.6 |
Natantian decapods |
449.6 |
|
13 |
Skipjack tuna |
Sharks, rays, skates |
Yesso scallop |
304.4 |
Croakers, drums nei |
437.5 |
|
14 |
Clupeoids nei |
Pacific saury |
Pacific saury |
288.7 |
Sardinellas nei |
429.0 |
|
15 |
Croakers, drums nei |
Scads nei |
Tuna-like fishes nei |
287.3 |
Indian mackerels nei |
387.0 |
|
16 |
Indian mackerels nei |
Clupeoids nei |
Cephalopods nei |
282.1 |
Cuttlefish, bobtail squids |
386.3 |
|
17 |
Bigeye tuna |
Tuna-like fishes nei |
Clupeoids nei |
278.3 |
Indian oil sardine |
369.2 |
|
18 |
Stolephorus anchovies |
Ponyfishes nei |
Stolep. anchovies |
276.1 |
Gazami crab |
365.8 |
|
19 |
Sea catfishes nei |
Bigeye tuna |
Sharks, rays, skates |
272.3 |
Silver pomfrets nei |
309.4 |
|
20 |
Chumsalmon |
Carangids nei |
Jap. jack mackerel |
271.5 |
Tuna-like fishes nei |
309.0 |
|
Unit: 1 000 tonnes
|
Table 3
Top ten aquaculture producer States in
2002
|
By quantity |
By value |
||||
|
Country |
(1 000 tonnes) |
Country |
(million US$) |
||
|
1 |
China |
27 767 |
1 |
China |
28 428 |
|
2 |
India |
2 192 |
2 |
Japan |
3 394 |
|
3 |
Indonesia |
914 |
3 |
India |
2 539 |
|
4 |
Japan |
828 |
4 |
Chile |
1 634 |
|
5 |
Bangladesh |
787 |
5 |
Thailand |
1 436 |
|
6 |
Thailand |
645 |
6 |
Indonesia |
1 418 |
|
7 |
Norway |
554 |
7 |
Norway |
1 155 |
|
8 |
Chile |
546 |
8 |
Viet Nam |
1 136 |
|
9 |
Viet Nam |
519 |
9 |
Bangladesh |
1 126 |
|
10 |
USA |
497 |
10 |
Brazil |
909 |
| |
Other |
4 550 |
|
Other |
10 621 |
| |
TOTAL |
39 799 |
|
TOTAL |
53 798 |
| Excluding aquatic plants |
Table 4
Top twenty cultured species in Asia-Pacific region by quantity
|
Inland waters |
|||||
|
1990 |
2002 |
||||
|
1 |
Silver carp |
1 416.6 |
1 |
Silver carp |
4 009.6 |
|
2 |
Grass carp |
1 042.0 |
2 |
Grass carp |
3 494.5 |
|
3 |
Bighead carp |
671.8 |
3 |
Common carp |
2 955.3 |
|
4 |
Common carp |
658.4 |
4 |
Bighead carp |
1 715.5 |
|
5 |
Tilapias |
282.8 |
5 |
Crucian carp |
1 700.6 |
|
6 |
Rohu |
244.7 |
6 |
Tilapias |
1 126.4 |
|
7 |
Catla |
235.3 |
7 |
Rohu |
578.4 |
|
8 |
Crucian carp |
215.6 |
8 |
White amur bream |
564.1 |
|
9 |
Japanese eel |
163.5 |
9 |
Catla |
469.1 |
|
10 |
White amur bream |
161.6 |
10 |
Mrigal carp |
424.0 |
|
11 |
Mrigal carp |
160.1 |
11 |
Chinese river crab |
340.0 |
|
12 |
Clarias catfishes |
61.1 |
12 |
Black carp |
225.3 |
|
13 |
Barb |
47.0 |
13 |
Japanese eel |
222.4 |
|
14 |
Climbing perch |
39.4 |
14 |
Giant river prawn |
191.4 |
|
15 |
Black carp |
37.9 |
15 |
Clarias catfishes |
182.1 |
|
16 |
Milkfish |
34.5 |
16 |
Mandarin fish |
130.0 |
|
17 |
Cyprinids nei |
25.6 |
17 |
Soft-shell turtle |
119.7 |
|
18 |
Gourami |
24.9 |
18 |
Barbs |
79.0 |
|
19 |
Trouts |
24.7 |
19 |
Milkfish |
55.3 |
|
20 |
Giant river prawn |
18.5 |
20 |
Gouramis |
46.7 |
|
|
Misc. freshwater fishes |
776.8 |
|
Misc. freshwater fishes |
2 815.6 |
|
Marine/brackish waters |
|||||
|
1990 |
2002 |
||||
|
1 |
Milkfish |
399.6 |
1 |
Giant tiger prawn |
508.6 |
|
2 |
Giant tiger prawn |
289.7 |
2 |
Milkfish |
472.5 |
|
3 |
Fleshy prawn |
185.1 |
3 |
Fleshy prawn |
385.5 |
|
4 |
Japanese amberjack |
161.6 |
4 |
Marine crabs nei |
178.3 |
|
5 |
Silver seabream |
52.0 |
5 |
Japanese amberjack |
162.7 |
|
6 |
Tilapias |
39.2 |
6 |
Silver seabream |
73.4 |
|
7 |
Banana prawn |
32.8 |
7 |
Other penaeus shrimps |
65.7 |
|
8 |
Metapenaeus shrimps |
28.6 |
8 |
Tilapias |
50.9 |
|
9 |
Coho salmon |
23.6 |
9 |
Banana prawn |
42.9 |
|
10 |
Other penaeus shrimps |
21.0 |
10 |
Bastard halibut |
33.2 |
|
11 |
Kuruma prawn |
9.3 |
11 |
Metapenaeus shrimps |
22.4 |
|
12 |
Barramundi |
7.9 |
12 |
Groupers |
21.0 |
|
13 |
Mullets |
7.9 |
13 |
Barramundi |
19.7 |
|
14 |
Bastard halibut |
7.1 |
14 |
Scorpionfishes |
15.3 |
|
15 |
Indian white prawn |
6.7 |
15 |
Indo-Pacific swamp crab |
14.5 |
|
16 |
Japanese jack mackerel |
5.9 |
16 |
Atlantic salmon |
14.4 |
|
17 |
Indo-Pacific swamp crab |
3.8 |
17 |
Mullets |
17.4 |
|
18 |
Tilapias |
3.8 |
18 |
Indian white prawn |
9.5 |
|
19 |
Puffers |
2.9 |
19 |
Coho salmon |
8.0 |
|
20 |
Groupers |
2.8 |
20 |
Chinook salmon |
7.0 |
|
|
Misc. fishes |
38.6 |
|
Miscellaneous fishes |
578.1 |
|
|
Misc. crustaceans |
4.5 |
|
Misc. crustaceans |
230.7 |
|
* Colourd cells indicate carnivorous species |
* Excluding aquatic plants and molluscs |
Unit: 1 000 tonnes |
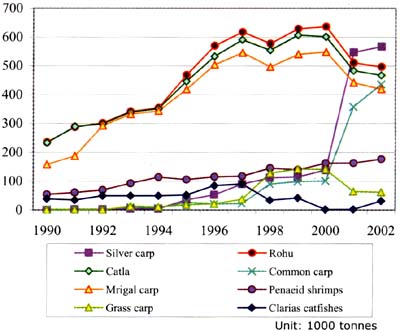
A comparison of the top twenty cultured species[16] in the region between 1990 and 2002 (excluding aquatic plants and molluscs) shows that there has been little change in the higher ranked species in inland waters, which are dominated by Chinese and Indian carps. It is worth noting that the number of carnivorous species has increased during the past ten years. In marine waters, although there are changes in the order of species, major cultured species are generally dominated by high-valued carnivorous species such as penaeid shrimp, jacks, sea breams and salmons. Production of crabs has made significant advances in recent years (i.e. Chinese river crab in inland waters and marine crabs in marine waters) (Table 4).
South Asia - capture fisheries
The South Asian sub-region showed very strong and continuous growth during 1980-2002, nearly doubling its capture production from 3.1 million tonnes in 1980 to 6.0 million tonnes in 2002 (Figure 6). Although overall growth largely resulted from production in marine waters, South Asia has the largest share of inland capture production (29 percent of total capture fisheries production) among sub-regions in the Asia-Pacific area. Inland production was relatively stable during late 1970s and 1980s, but grew rapidly from the early 1990s. It reached the highest level of production at 1.9 million tonnes in 2001 but showed a sharp decrease in 2002 for the first time in the past 10 years.
It is notable that there are no dominant species among the top production species in this area. In comparison with top production species of other sub-regions, the combination of South Asian species is unique in the sense that freshwater species (Cyprinids nei: 5th), diadromous species (Hilsa shad: 3rd) and demersal species (Croakers/drums: 2nd and Bombayduck: 9th) are ranked high in the list (Table 5).
Freshwater fish and diadromous fish has been the number one production group for the last four decades (except in 1992) and achieved very rapid growth in the 1990s. Among marine species, pelagic fishes and demersal fishes showed almost parallel increasing trends with similar levels of production in 2002 (1 254 thousand tonnes and 1 190 thousand tonnes respectively). Crustacean production has been relatively stable and production levels of molluscs including cephalopods in this area have been very low (Figure 7).
Table 5
South Asia capture fisheries production,
top ten species
|
Species |
Tonnes (1 000) |
|
Indian oil sardine |
365.8 |
|
Croakers, drums nei |
296.3 |
|
Hilsa shad |
220.8 |
|
Natantian decapods nei |
198.7 |
|
Cyprinids nei |
183.8 |
|
Skipjack tuna |
181.5 |
|
Giant tiger shrimp |
157.1 |
|
Clupeoids nei |
140.9 |
|
Bombay-duck |
135.9 |
|
Hairtails, scabbardfishes |
134.2 |
|
Marine fishes nei |
1 081.7 |
|
Freshwater fishes nei |
1 199.7 |
South Asia - aquaculture
South Asia's production increased rapidly from 1 179 thousand tonnes in 1990 to 2 807 thousand tonnes in 2002. A notable feature of the aquaculture sector in South Asia is that the majority of production comes from inland waters and hence the growth of the sector has been mostly due to increasing freshwater culture (Figure 8).
|
Top five cultured species in 2002 were all freshwater carps (Silver carp, Rohu, Catla, Common carp and Mrigal) and their aggregated production was 2 390 thousand tonnes accounting for 79 percent of total aquaculture production of the sub-region. |
Reported production of freshwater finfishes alone constituted 93 percent of total aquaculture production in 2002. Although Indian carps (Rohu, Catla and Mrigal carp) have been the mainstays of the region's cultured species, there have been notable increases in the production of introduced Chinese carps in recent years. Silver carp production has increased almost five-fold in two years (1998-2000) becoming the top cultured species in 2002 for the first time. Similarly common carp production recorded very rapid increases since 2000. During the same period the production of indigenous carps showed sharp declines (Figure 9).
Figure 6
Trends in capture production of South
Asia by environment
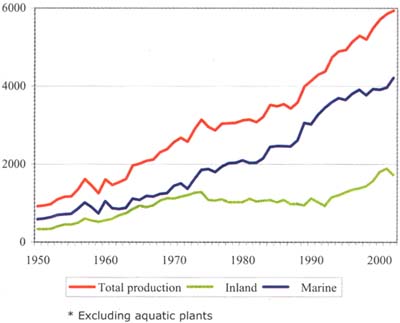
Figure 7
Capture production of South Asia by
major species groups
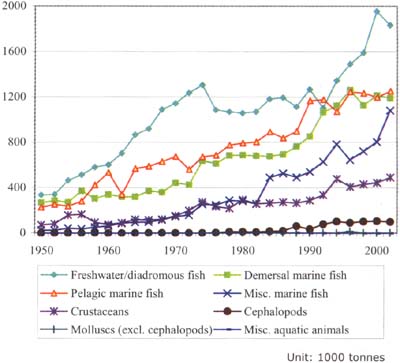
Figure 8
Trends in aquaculture production of
South Asia by major species groups
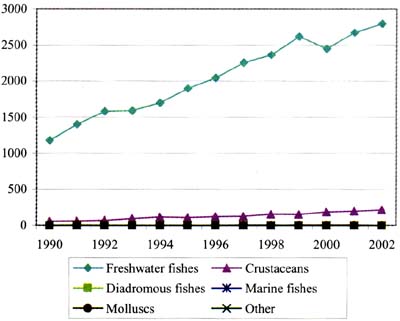
Figure 9
Aquaculture production of major species
in South Asia
Mariculture in South Asia has not been an area of remarkable growth except for the production of crustaceans. Marine crustacean production, mostly comprised of Penaeid shrimp, has increased steadily and reached 177 thousand tonnes in 2002. In general, the level of diversification of cultured species is relatively low in this area and there has been very limited or no reported marine finfish production.
Southeast Asia - capture fisheries
Similar to the situation in South Asia, production growth in Southeast Asia has been very strong for the past four decades with marine capture production increasing linearly through this period. The production level of 14 million tonnes in 2002 (total capture production) was second only to the China sub-region.
Inland production increased gradually and reached 1.5 million tonnes in 2002. Considering the rich freshwater resources in the area, it is commonly thought that the proportion of inland capture production, which constitutes only approximately 11 percent of total production[17], might be particularly underestimated in this sub-region (Figure 10).
In terms of production by main species groups, catches of the pelagic marine fish group and marine fish nei group have grown strongly and are a major driving force of the overall production growth (Figure 11). Other species groups (freshwater/diadromous fish, demersal fish, crustaceans and cephalopods) exhibited similar increasing trends, maintaining nearly the same share of production. The proportion of unidentified marine fish (marine fish nei) is notably high (29 percent of total production) in this subregion because many States do not segregate marine fish production.
Table 6
Southeast Asia capture fisheries
production, top ten species
|
Species |
Tonnes 1 000) |
|
Scads nei |
550.7 |
|
Indian mackerels nei |
460.0 |
|
Sardinellas nei |
437.4 |
|
Skipjack tuna |
348.4 |
|
Natantian decapods nei |
323.3 |
|
Stolephorus anchovies |
295.6 |
|
Tuna-like fishes nei |
254.3 |
|
Yellowfin tuna |
242.7 |
|
Carangids nei |
239.3 |
|
Threadfin breams nei |
214.4 |
|
Marine fishes nei |
4 079.7 |
|
Freshwater fishes nei |
1 032.0 |
Table 6 shows the top ten production species in Southeast Asia. Eight of the top ten production species are marine pelagic fishes and the top three ranks are dominated by the small pelagic fish group (scads, Indian mackerels, and sardinellas). The large pelagic fish group (skipjack tuna, tuna-like fishes, yellowfin tuna and carangids) also has relatively high production.
Southeast Asia - aquaculture
Aquaculture production in Southeast Asia is very diversified, comprising 39 percent of freshwater fish, 29 percent of aquatic plants, 13 percent of crustaceans, 13 percent of marine/diadromous fishes and 7 percent of molluscs (by quantity). In terms of production by value, highly priced crustaceans constituted an increased share of 49 percent of the total production, followed by freshwater fish at 35 percent (Figure 12).
The growth trend is particularly strong for freshwater finfish culture, which has increased from 564 thousand tonnes in 1990 to 1 556 thousand tonnes in 2002 with an average annual increment of 83 thousand tonnes. In the mariculture sub-sector, aquatic plants showed surprising production growth. Crustaceans have been a major cultured species throughout the sub-region, although this has declined since 2000 (Figure 13).
|
Top ten cultured species in Southeast Asia (by quantity, excluding aquatic plants) were milkfish, giant tiger shrimp, tilapias, common carp, clarias catfishes, blood cockle, green mussel, rohu, barbs and gouramis. |
Zanzibar weed (Eucheuma cottonii) is the most widely cultured aquatic plant in the region with a production of 778 thousand tonnes in 2002. Apart from aquatic plants, Giant tiger shrimp (Penaeus monodon) maintained the position of top produced species until 2001, although very recently the massive increase in production of P. vannamei is challenging this position. P. monodon production decreased sharply in 2002, back to the production level of 1992.
Figure 10
Trends in capture production of
Southeast Asia by environment
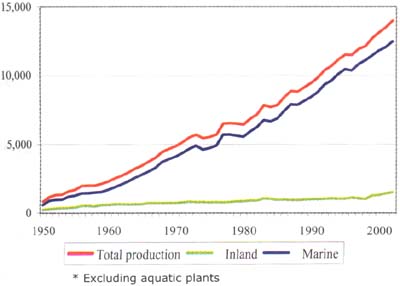
Figure 11
Capture production of Southeast Asia by
major species groups
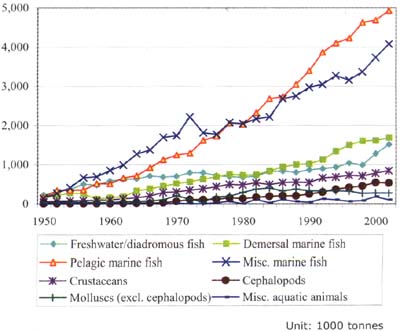
Figure 12
Aquaculture production of Southeast
Asia: proportion of major species groups
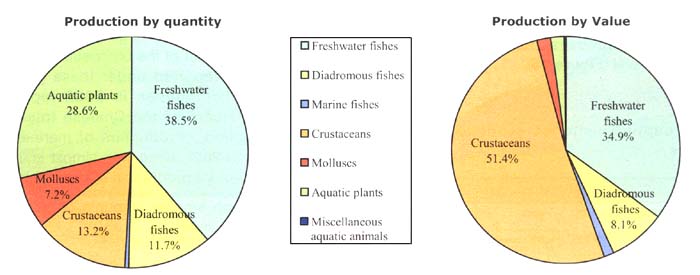
Figure 13
Trends in aquaculture production of
Southeast Asia by major species groups
China - capture fisheries
Chinese capture fisheries production can be divided into three periods that show distinct trends (Figure 14). The first period, 1950 to 1985, is characterized by relatively low rates of growth, during which all species groups exhibited a very similar pattern, albeit with some annual fluctuations. In the second period, 1986 to 1998, China reported very rapid and substantial growth in production in almost all segments of capture fisheries. Between 1992 and 1997, annual increments of total production constantly exceeded one million tonnes (the highest annual increment was 1.7 million tonnes in 1994/1995). The third period started with the introduction of the zero growth policy in 1998; total production started to decline for the first time in twenty years. The degree of decline was higher in marine production than in inland production.
Although most species groups showed similar rapid growth trends during the second period, trends in the third period varied widely. Production of the marine fish nei group declined sharply, whilst the crustacean group continued to grow. During this period, molluscs maintained the same production level (Figure 15).
Table 7
China capture fisheries production, top
ten species
|
Species |
Tonnes 1 000) |
|
Largehead hairtail |
1 296.2 |
|
Japanese anchovy |
1 174.5 |
|
Scads nei |
608.3 |
|
Akiami paste shrimp |
578.6 |
|
Japanese Spanish mackerel |
518.8 |
|
Chub mackerel |
450.3 |
|
Silver pomfrets nei |
386.3 |
|
Gazami crab |
347.1 |
|
Golden threadfin bream |
309.4 |
|
Cuttlefish, bobtail squids nei |
299.7 |
Table 7 shows the top ten production species in China in 2002. Largehead hairtail and Japanese anchovy catches were extremely high with both species exceeding one million tonnes. A distant second group includes a variety of species group such as small pelagic fish (scads and chub mackerel), large pelagic fish (Japanese Spanish mackerel), bentho-pelagic fish (silver pomfrets), demersal fish (golden threadfin bream), crustaceans (akiami paste shrimp and gazami crab) and cephalopods.
Table 8
Unidentified capture production in
China
|
Species group |
Tonnes (1 000) |
|
Marine fishes nei |
3 595.5 |
|
Marine molluscs nei |
1 376.7 |
|
Marine crustaceans nei |
1 215.0 |
|
Freshwater fishes nei |
924.2 |
|
Freshwater crustaceans nei |
772.7 |
|
Freshwater molluscs nei |
551.0 |
|
Total of "nei" groups |
8 435.1 |
|
Total capture production |
17 767.2 |
There are several notable differences in the Chinese production figures compared with other subregions.
These include:
Remarkably high proportion of crustaceans in Chinese production (18.8 percent in 2002) compared to those of other sub-regions. Proportions of crustaceans in Southeast Asia, South Asia and other Asia were 6.1 percent, 8.3 percent and 3.9 percent respectively.
The large quantity of production reported within unidentified large groupings which far exceeded that of the other sub-regions. Total quantity reported under these groups was 8.4 million tonnes in 2002 representing 47.5 percent of the Chinese total capture production. Production of marine fish nei group in 2002 alone was almost equal to the total capture production of India (Table 8).
The much smaller amounts of small pelagic fish in the catch.
China - aquaculture
China has continued to show strong growth in all culture environments. Growth in inland culture came mainly from increased production of finfish culture, which according to official information is being achieved through the intensification of existing systems rather than any significant increase in production area. Growth in production from marine waters has been driven by two major groups, namely molluscs and aquatic plants (Figure 16).
Figure 14
Trends in capture production of China
by environment
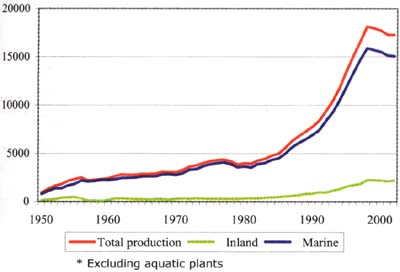
Figure 15
Capture production of China by major
species groups
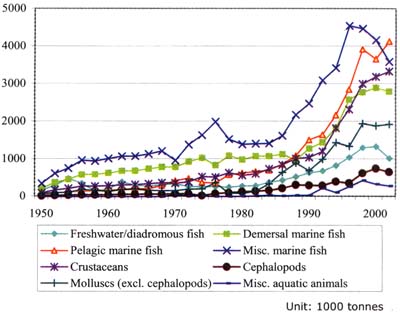
Figure 16
Trends in aquaculture production of
China by environment
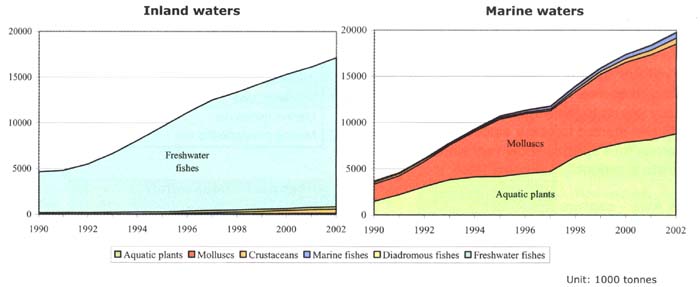
Figure 17
Trends in top eight cultured species in
China (aquatic plants and molluscs)
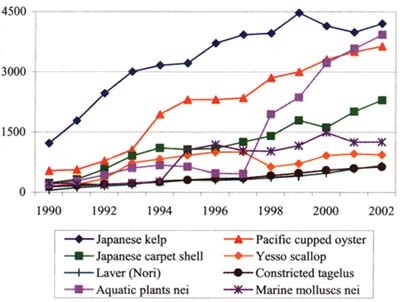
Figure 18
Trends in major cultured carnivorous
species production in China
In China generally, the production of most cultured species showed an increasing trend. However, there are a number of species worth highlighting, as follows:
Japanese kelp (Laminaria japonica): this species has been the top cultured species in China and its production growth is remarkable; increasing from 1 222 thousand tonnes in 1990 to 4 208 thousand tonnes in 2002.
Miscellaneous aquatic plants: this massive volume of aquatic plants is not reported at the species level. However, production jumped from 196 thousand tonnes in 1990 to 3 931 thousand tonnes in 2002. The highest annual increment was 1 485 thousand tonnes between 1997 and 1998. As this group and Japanese kelp are not particularly easy to culture intensively, these increases suggest the expansion of additional areas of seaboard for their culture. A description of the areas under seaweed culture and production intensity in China would be very useful.
Pacific cupped oyster: this is another cultured species that has made outstanding growth; increasing from 532 thousand tonnes in 1990 up to 3 646 thousand tonnes in 2002. Mollusc production is also difficult to intensify and increased production suggests developments of new production areas as in the case of aquatic plants (Figure 17).
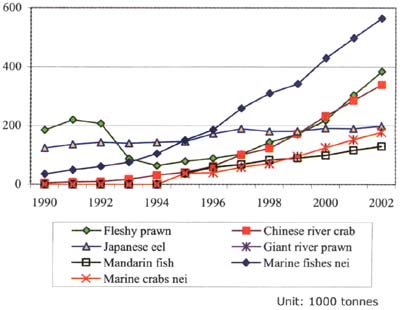
Carnivorous species: Production of high value carnivorous species such as mandarin fish, Chinese river crab and marine finfish had been relatively low up to the early 1990s. However, rapid growth has started to occur since 1995. Many of the carnivorous species show very similar patterns of growth in production (Figure 18).
Other Asia - capture fisheries
Since reported inland production in this region is low, the trend in total capture fisheries production is almost identical to the trend in marine production. Total production increased towards its peak production of 13.6 million tonnes in 1988, and thereafter decreased steadily (Figure 19). In its best years, the sub-region's share of global capture production was estimated as high as 40 percent.
Production by main species groups (Figure 20) provides a more detailed picture of the situation of the fisheries sector. During the late 1960s to early 1970s, demersal fish became the most important production group with a very rapid growth rate, achieving a three-fold increase in fifteen years. However, after the peak production of five million tonnes in 1974, it started to decline, gradually at first, but with a sharp decline after 1976. The current level of demersal fish production is as low as in the early 1950s. This reduction was compensated for by increased production of marine pelagic fish, the strong growth of which contributed to an overall increase of capture production until 1988, but then a similar decline to that of demersal fish production occurred. Current production levels have dropped to those of the early 1960s.
In terms of major production species, pelagic species predominate in this area. It is also notable that there is high production of cephalopods (Japanese flying squid) and molluscs (Yesso scallop) (Table 9).
Table 9
Other Asia capture fisheries production,
top ten species
|
Species |
Tonnes (1 000) |
|
Japanese anchovy |
679.5 |
|
Japanese flying squid |
500.2 |
|
Skipjack tuna |
479.2 |
|
Chub mackerel |
420.8 |
|
Yesso scallop |
306.7 |
|
Alaska Pollock |
298.0 |
|
Pacific saury |
232.5 |
|
Japanese jack mackerel |
222.1 |
|
Chum salmon |
211.7 |
|
Yellowfin tuna |
164.5 |
|
Marine fishes nei |
649.3 |
|
Marine crustaceans nei |
67.4 |
Other Asia - aquaculture
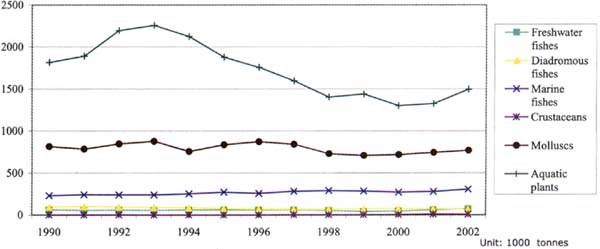
In other Asia, particularly in East Asian States, aquatic plants continue to be predominant, accounting for 54 percent of total production. This is followed by molluscs (28 percent) and marine finfish (11 percent). However, the high economic value of marine finfish makes this species group the largest contributor in terms of value, constituting 42 percent of total production value (Figure 21).
Production trends by major species groups show that aquaculture production in this region has been very stable; most of the major species groups have been maintained at the current level of production for the last ten years. The only exception to this is aquatic plant production, which peaked in 1993 then decreased by almost half in 2000 (Figure 22).
It is notable that the percentage of carnivorous fish in the total for fish production is very high in this subregion (82 percent in 2002) compared with South Asia, Southeast Asia and China, which all have levels below 10 percent.
Figure 19
Trends in capture production of other
Asia by environment
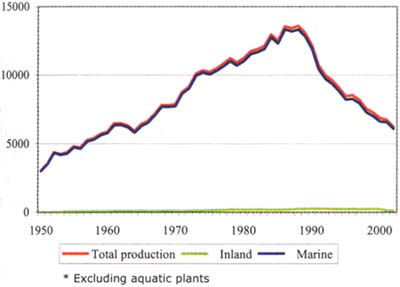
Figure 20
Capture production of other Asia by
major species groups
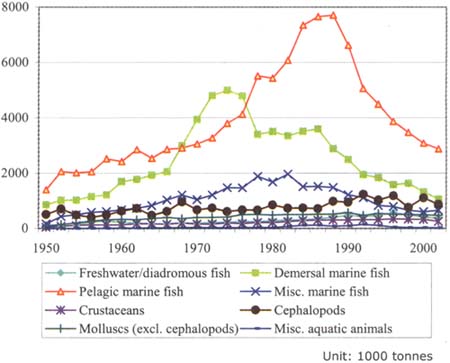
Figure 21
Aquaculture production in other Asia:
proportion of major species groups
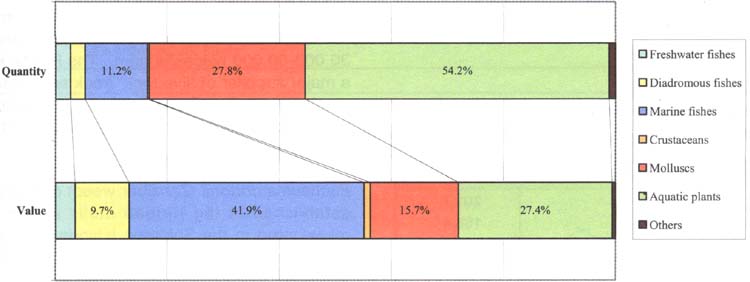
Figure 22
Trends in aquaculture production of
other Asia by major species groups
Oceania - capture fisheries
Similar to the other Asia sub-region, Oceania's capture production consists mainly of fish taken from marine waters. Although there have been annual fluctuations, it has continued to increase (Figure 23). Capture fisheries are often conducted on subsistence scale in many small island States and hence production may not be well represented in the official statistics. An effect of this is that general trends in production are basically determined by a few larger States such as Australia and New Zealand with well established commercial fisheries sectors, with the exception of offshore pelagic fisheries. Commercial offshore production has increased in many small island States and contributed to the increase in total production. Rapid growth of demersal fish production has mainly come from the States in temperate waters (i.e. New Zealand and Australia) (Figure 24).
The top ten species produced from capture fisheries in Oceania (Table 10) are distinct from those of the rest of the region as the majority of them are from the temperate waters of New Zealand and Australia.
Table 10
Oceania capture fisheries production,
top ten species
|
Species |
Tonnes (1 000) |
|
Blue grenadier |
201.7 |
|
Skipjack tuna |
166.4 |
|
Wellington flying squid |
50.0 |
|
Yellowfin tuna |
47.8 |
|
Southern blue whiting |
42.1 |
|
Albacore |
33.1 |
|
Jack and horse mackerels |
32.3 |
|
Snoek |
23.3 |
|
Orange roughy |
22.6 |
|
Pink cusk-eel |
21.9 |
|
Marine fishes nei |
62.6 |
Oceania - aquaculture
Aquaculture in the Oceania sub-region occurs in two distinctly different environs; larger developed States in temperate waters and small developing island States in tropical waters. Aquaculture production from the small island States is relatively limited. The aggregated production of all island States was 29 462 tonnes in 2002 (less than one percent of aquaculture production in the Asia-Pacific region).
The major cultured species in terms of quantity are seaweed, clams, penaeid shrimp, tilapia and milkfish. Two commodities and three States dominate the value of commercial aquaculture production in region. They are cultured black pearl from French Polynesia and the Cook Islands and shrimp from New Caledonia. In 2002 the total export value was US$ 153 million.
Live reef fish, aquarium fish and pearls, which are relatively low in quantity but high in value commodities, bring significant income to some Pacific Islands. The Pacific is an important source of trade in the marine aquarium industry. Although the target species are mostly caught from the wild, there is an increasing desire for culture-based sources. Giant clam culture for the ornamental trade is widespread throughout the region and the total export is probably in the range of 30 000-50 000 pieces/annum. The Pacific is also a major supplier of 'live rock' (rock encrusted with coralline algae) with approximately 50 000 pieces of live rock currently being cultured in the Fiji Islands.
Eucheuma cottonii (Zanzibar weed) culture is well established in the Kiribati atolls and is being rejuvenated in the Solomon Islands and Fiji with forecasted production in the order of 1 500 tonnes for 2004.
Interest in inland freshwater aquaculture is growing, particularly amongst the larger Melanesian States such as Fiji and Papua New Guinea. At present the most commonly farmed species are tilapia, common carp and Macrobrachium prawns.
The larger States in the region (New Zealand and Australia) have shown a steady growth in aquaculture production, which is largely attributable to increased production of finfish species. Major cultured species of these States were marine molluscs, salmonids and tunas.
Figure 23
Trends in capture production of Oceania
by environment
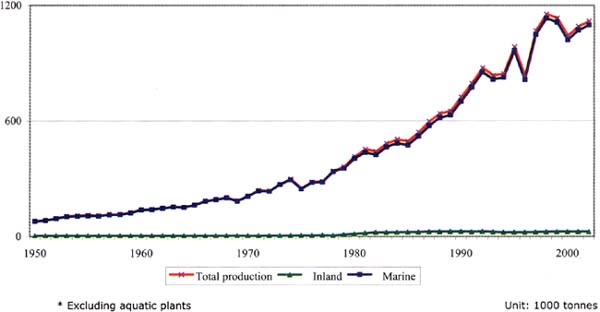
Figure 24
Capture production of Oceania by major
species groups
|
[7] In this document, "China"
refers to the sub-region that includes China PR, Hong Kong SAR and Taiwan
POC. [8] It is common understanding that fisheries information systems in the region have been particularly weak in inland areas. The relatively low level of inland capture production could be simply a reflection of poor quality of information. Constant increase of freshwater/diadromous production for some States could implicate the excessive reliance on estimation rather than actual measurement of production. [9] Coates, D. (2003). An overview of inland capture fishery statistics of Southeast Asia. In: New approaches for the improvement of inland capture fishery statistics in the Mekong Basin. FAO & MRC, RAP Publication 2003/01. 45 pp. [10] Its highest production was 2.7 million tonnes in 1973. [11] Its highest production was 1.7 million tonnes in 1978. [12] It should be noted that regionally aggregated figures in this report are based on national data, the quality of which is known to be very uneven among States. Some national figures are estimates or repetitions of the data previously reported to FAO. [13] For the period of 1991-2001 without aquatic plants production. [14] The massive scale of China PR's aquaculture production challenges statistical collection and there are uncertainties regarding the quantities reported. [15] See footnote 7. [16] There is significant volume of aquaculture production reported by large group of species, e.g. 3 394 thousand tonnes of fin fish production in 2002 were not identified at family, order or species level. Consequently, the species items totals could have underestimated the real production of the individual species. [17] see footnote 8. |
![]()
![]()
![]()