![]()
![]()
![]()
F. Padovani[9]
Introduction
The importance of timely and reliable information for strengthening SFM and forestry sector planning and policy formulation is well recognized. All of the global, national and local initiatives to promote SFM indicate the need to strengthen the information system. But collection, processing and analysis of information are very resource demanding and there is an urgent need for rationalization of these processes. With several agencies involved in the collection of diverse data, there is multiple duplication of information and often national resources are stretched beyond their capacities. This sometimes leads to poor responses.
Since its establishment, FAO has been at the forefront of developing inter-institutional collaboration in data collection and other related activities. FAO and the UN/ECE have been collaborating in data collection and dissemination for nearly five decades, benefiting both the member countries and the organizations. In the mid-1990s, the EUROSTAT (of the European Union) became a collaborator and in 1998 the ITTO Council agreed to join the system. Representatives from the four organizations convened in September 1998 and January 1999; this led to greater efforts for collaboration and the development of the JFSQ, merging the ongoing work of FAO, ECE, EUROSTAT and ITTO.
The JFSQ now includes the FAO Forest Products Questionnaire, the FAO UN/ECE EUROSTAT Timber Bulletin Questionnaire and the ITTO Forest Products Enquiry that many countries received from individual organizations until 1998.
This joint questionnaire responds to requests from member countries of all four partner organizations to rationalize the data collection process and data dissemination. More particularly, it aims to reduce multiple requests for information from member countries. The JFSQ is accessible at ftp://ftp.fao.org/fo/fon/fons/jq/jfsq.htm.
The basic principles and methods of cooperation include:
Each item of information is requested only once from each country.
Information from the JFSQ is shared between the four organizations.
Each organization continues to use the information it receives according to its own mandate, which remains completely unchanged by practical cooperation in data collection
There is one national correspondent for forest sector statistics in each country and the national correspondent only completes one form (including the questionnaires of the four organizations).
The completed questionnaire is sent to one focal organization, which then provides the information required for the three other groups participating in the activity.
Each organization focuses on the data validation efforts in a limited number of countries, trusting their partners to work with other countries.
The information received through the joint questionnaire is distributed to all four organizations. In this way, the supply of information to international organizations is streamlined and avoids duplication of efforts.
The structure and contents of the JFSQ
The contents of the JFSQ are as follows:
|
JQ1, JQ2 |
Basic questionnaire for all countries on removal, production and trade |
|
SP1 |
All countries, for secondary wood and paper products and trade values |
|
EU1, EU2 |
For EU and EFTA countries, requesting data on removal by species and intra-EU and extra-EU trade |
|
DT1, DT2 |
Direction of trade, for non-ECE countries (for ECE countries, this information is derived from general trade data sets, notably COMTRADE) |
|
ITTO1, ITTO2, ITTO3 |
For ITTO members, requesting data on trade in tropical species, and on market conditions and forecasts |
|
ECE1, EU1, EU2 |
For ECE members; requests more detailed information on trade of temperate species |
The four secretariats distribute the JFSQ to all countries (Table 1). The corresponding languages (English/French/Spanish) are indicated under the FAO logo.
Coverage
|
JQ and DOT and SP1: |
All countries |
|
ECE: |
All ECE countries |
|
ITTO: |
All ECE members of ITTO |
|
EU: |
All EU and EFTA members (candidates to the EU will also be requested to complete this questionnaire) |
|
FAO: |
All non-EFTA, non-ECE and non-ITTO countries |
The data structure
The statistical data collection categories for core forest products are structured hierarchically and are mutually exclusive, covering production or trade (quantity and value). The product categories are given in the forms (JQ1, JQ2, DOT1, DOT2), which are the basic forms for the Yearbook of forest products, the flagship FAO statistical publication on forest products.
The FAO coding (country codes and product codes) is embedded within the JQ1&2 and DOT1&2 and SP1.
The national correspondent’s address
A clear and complete address is required and is essential for any clarification or follow-up that is required.
Table 1. Geographical distribution of the JFSQ and returns
|
FOREST SECTOR QUESTIONNAIRE |
Status of Returns |
2001 Reply |
updated |
2000 Reply |
updated |
||||||||||||
|
Distribution by |
Media Print Electronic |
Last Return |
JQ1 |
JQ2 |
DOT1 |
DOT2 |
ITTO |
SP1 |
JQ1 |
JQ2 |
DOT1 |
DOT2 |
ITTO |
SP1 |
|||
|
Countries |
|
|
|
|
|
|
|
|
|
|
|||||||
|
Australia |
FAO |
E |
21/11/2002 |
X |
X |
X |
X |
X |
X |
U |
X |
X |
X |
X |
X |
X |
U |
|
China |
FAO |
E |
25/10/2002 |
X |
X |
X |
X |
X |
X |
U |
X |
X |
|
|
|
|
U |
|
Cooks Is |
FAO |
E |
4/09/2002 |
|
X |
|
|
|
X |
U |
X |
X |
X |
X |
X |
X |
U |
|
Fiji |
ITTO |
E |
5/09/2001 |
|
|
|
|
|
|
|
X |
X |
X |
X |
X |
X |
U |
|
Maldives |
FAO |
P |
1997 |
|
|
|
|
|
|
|
|
|
|
|
|
|
|
|
Mongolia |
FAO |
P |
1993 |
|
|
|
|
|
|
|
|
|
|
|
|
|
|
|
Myanmar |
ITTO |
E |
27/09/2002 |
X |
X |
X |
X |
X |
X |
U |
X |
X |
X |
X |
X |
X |
U |
|
Papua New Guinea |
ITTO |
P |
1999 |
|
|
|
|
|
|
|
|
|
|
|
|
|
|
|
Samoa |
FAO |
P |
1983 |
|
|
|
|
|
|
|
|
|
|
|
|
|
|
|
Solomon Is |
FAO |
P |
25/06/2002 |
X |
X |
X |
|
|
|
U |
|
|
|
|
|
|
|
|
Tonga |
FAO |
P |
1983 |
|
|
|
|
|
|
|
|
|
|
|
|
|
|
|
Vanuatu |
ITTO |
E |
13/09/2002 |
X |
X |
|
|
X |
X |
U |
X |
X |
X |
X |
X |
X |
U |
|
as of 27/11/2002 |
|||||||||||||||||
Definitions
All terms and definitions have been harmonized and cross-referenced with the Customs Cooperation Council Harmonised System 1996 (HS96) and the UN Standard International Trade Classification Revision 3 (SITC rev.3 January 1988).
It became necessary during the revision of the questionnaire to agree on certain terms and definitions, as well as a system of cross-references to international multisector classifications. Participants are invited to review the joint questionnaire paying particular attention to this point because the questionnaire, through its concepts and use of terms is setting the framework for all international analysis of developments in the sector. It is of the utmost importance that the framework is coherent and realistic.
Timetable
“It is requested that the 2001 JFSQ be completed with all of the details for the calendar year 2001 and that one copy is sent in time to reach the different organizations by 20 August 2002 or earlier if possible.” This is a common sentence employed by all organizations.
Some work still needs to be done in harmonizing the different dates for despatching the questionnaires and the deadline for returning them. This is very important if a more accurate annual picture of the forestry sector is to be obtained. Obviously, this depends on the timetable priorities within each organization. The statistical information cycle for the FAO Yearbook of forest products is reported in Annexe 1.
The fact that a country receives the JFSQ (containing the data for the four organizations) only once is a major improvement in organizing data collection and ensuring consistency in reporting. In my opinion, this is one of the main reasons why the data quality of all four organizations has been criticized heavily in the past. Previously, the same information was requested from the national correspondent at four separate intervals by the four different organizations during the year. Naturally the national correspondent provided only the most recent data available (at different periods in the year), with the ensuing consequences of inconsistency in subsequent documentation.
Data validation
Data dialogue with correspondents will be carried out by EUROSTAT for EU/(EFTA) countries, by ECE/FAO for all other ECE members, ITTO for its member countries and by FAO for all remaining countries. When sectoral or regional analysis or data revision is carried out, each organization can request clarification from national correspondents.
EUROSTAT, FAO and ITTO will receive all the JFSQ returns for their respective members in the ECE region from ECE/FAO Geneva for inclusion in their respective systems/publications. In the same way ITTO will send the JFSQ to FAO, ECE/FAO and EUROSTAT for their respective members.
It is assumed that the country returns are always comprehensive. But on occasion they are incomplete for very different reasons.
Some basic data validation approaches are used to monitor the quality of the data received and to decide whether to accept them or to find an alternative data source. Frequently, when necessary confirmation cannot be obtained, estimates based on the previous year’s data are provided by flagging the information with an “F” or an “*”.
The basic validation routines for the possible items/aggregates are:
Net Consumption (C=P+I-E where P = Production, I = Imports and E = Exports)
For production, consistency of items/aggregates over time
Self-sufficiency
For trade, Import/Export Unit Value, over time, between regions, stratified by volume
Conversion factors of forest products in roundwood equivalent
Graphs, display over time
Others
In relation to the JFSQ in MS Excel, as in the past, the equivalence approach is used. This is possible because an empty questionnaire is provided where all the elements or aggregates have to be entered; a section within the spreadsheet was developed for the validation of the data entered. The equivalence was: 0 = aggregate (item1+item2+item3+...).
In the inputs there are unassociated automatic calculations, which in the past created problems for the national correspondents. Now the national correspondent can enter data available on hand and insert personal calculations, estimations, conversions, etc. In particular, the national correspondent can verify and identify any discrepancies and correct the data accordingly.
The aggregates are not calculated automatically or left unprotected on purpose. This is because if for some reason the national correspondent does not have the items or there is the risk of a confidentiality breach the correspondent can still allocate the aggregate. This exception is becoming more and more frequent in the pulp and paper production sector.
International organizations depend on national institutions to make the data available. The quality of international data depends first on the quality of data collected by national institutions and secondly on success in capturing that data for international use.
Availability of the JFSQ
The JFSQ is provided in MS Excel and is available in various media. On hard copy, it can be sent via ordinary mail. But essentially the JFSQ is sent as a file attachment to the e-mail addresses of the national correspondents who request it. Notes on the JFSQ are provided by FAO (Annexe 2). In order to streamline the work of national correspondents and secretariats it can be downloaded also from ftp://ftp.fao.org/fo/fon/fons/jq/jfsq.htm
The electronic spreadsheet version of the questionnaires in MS Excel comes in three languages (English/French/Spanish) and can be customized according to the language of the member country. This spreadsheet has a number of features that will help with data entry and transmission. Other languages such as Russian, Chinese and Arabic are available.
The Virtual Questionnaire (http://apps2.fao.org:8000/VirtualQuestionnaires), an online data entry component of the JFSQ is under development. When it is ready, a country will be able to enter country data directly into the FAOSTAT working system on real time. At present all ECE country data are uploaded via the Geneva office. Within this year we will conduct a trial with selected countries.
JFSQ returns
The JFSQ Returns are reported in Table 1.
Data dissemination
Each organization will consolidate and disseminate the country data collected according to its mandate.
As usual FAO will disseminate the data through the Yearbook of forest products and FAOSTAT/CD annually and on the Internet in July and December.
Action to be taken
Participants’ views on these matters should be reported to the appropriate bodies of the organizations who will be invited to review the joint questionnaire. In February 2003, a revised version will be prepared for use in 2003 and subsequent years, taking into account all of the comments received.
Conclusion
This general enhancement has been made possible for several reasons, but the key element has been the general availability of information technology and the World Wide Web within the administrations of most institutions/governments.
National correspondents at this workshop are invited to review the JFSQ and to provide inputs/suggestions with regard to data collection and analysis, specifically focusing on national and global needs for sector policy and planning and sustainable forest and forest product management.
Annex 1. FAO Yearbook of forest products statistical information cycle (2001-2002)
Detailed plan:
1. IWGFS meeting
Date: 15-16/2/2001
Finalization of the JFSQ 2001
2. Dispatch of the Joint Forest Sector Questionnaire (JFSQ)
Date: 30/4/2001
The JFSQ in English, French and Spanish will be distributed to FAO correspondents in printed form. A note is included, which describes the objectives of the annual enquiry and expected returns of the JFSQ and the availability of a customized MS Excel Workbook at FTP ready for downloading via the WWW or a copy of it can be obtained via e-mail or by pouch.
Selected countries will use the online Virtual Questionnaire.
3. JFSQ/returns and sharing
Date: 15/6/2001 to 31/10/2001
Each country data returns is processed, validated and loaded within 10 days in the working system.
The JFSQ is shared between:
ITTO: weekly the JFSQs are sent to ITTO or received from ITTO
ECE: JQ1 and JQ2 from the ECE are uploaded in the working system by 20/6/2001
EUROSTAT: JQ1-2 on CIRCA by mid-June and DOT1-2 by September
A reminder to FAO correspondents is sent in early September. If required the country data are enriched with unofficial data sources. The country data are available to our partners in a WRITE or READ mode for validation and usage. Basic validation: ECE-EUROSTAT to June 20; FAO-ITTO to Sept 30. Analytical validation: ECE-EUROSTAT (21-25 June); FAO-ITTO (1-15) October.
Internet quarterly updates for WWW dissemination
Date: 30/06/2001; 31/10/2001
Preliminary data available for selected countries and products in June and final data by November.
4. Yearbook of forest products publication
Date: 1/6/2001-30/9/2001 (prototype); 1/11/2001-30/11/2001 (final)
Revisions: multilingual text (5 languages); report writing and FTP procedures.
Data validations: regional, country, products, aggregates, data level over time.
5. Production and release of statistical products
Date: 30/01/2002
Yearbook of forest products publication,
FAOSTAT/CD,
Yearbook of forest products publication is in PDF on the WWW.
6. Dissemination/promotion of the statistical products
Date: 1/3/2002 onwards
Distribution of the Yearbook of forest products and the FAOSTAT/CD.
7. Ongoing activities
Date: ongoing over the year
Historical data revision, processing, validation, feedback, research, e-mail, revisions of classifications, revision of geographical and product aggregations, support to data user, etc.
Annex 2. Notes to National Correspondents

Notes to National Correspondents
Dear colleagues
Enclosed please find the 2001 Joint Forest Sector Questionnaire. The participating agencies include United Nations/Economic Commission for Europe (UN/ECE), European Union (Eurostat), Food and Agriculture Organization (FAO) and International Tropical Timber Organization (ITTO). This joint questionnaire is in response to requests from member states of all four-partner organizations to rationalize our approaches to forest sector data collection and dissemination.
The information received through the joint questionnaire is distributed to all the four organizations. In this way, the supply of information to international organizations is concentrated, streamlined and no duplication of efforts is envisaged.
Please fill in all the questionnaires attached to this letter: we will pass on, the data you supply, to the other organizations of which your country is a member.
All the terms and definitions have been harmonized and cross-referenced to Customs Cooperation Council Harmonised System 1996 (HS96) and the UN Standard International Trade Classification revision 3 (SITC rev.3 January 1988).
It is requested that the 2001 Questionnaire be completed with all details for the calendar year 2001 and that one copy sent in time to reach
FAO,
R. Michael Martin, Chief
Forestry Information and Liaison Unit
Forestry Department, Policy and Planning Division,
Via delle Terme di Caracalla, 00100 Rome, Italy,
Facsimile No:(+39 06) 5705-5137 or 5705-5514
E-mail: [email protected]
by 20 August 2002 or earlier if possible.
We have available an electronic spreadsheet version of the questionnaires in Excel. This spreadsheet has a number of features that will help in your data entry and transmission. It is available at:
ftp://ftp.fao.org/fo/fon/fons/jq/jfsq.htm
or can be obtained from [email protected] or [email protected].
Thank you for working with us to improve global forest sector statistics.
Yours sincerely
F. Padovani
Introduction
The aims of this workshop were to: (1) establish and reinforce the network/working group of statistical correspondents in the 16 member countries of FAO and ITTO; (2) provide training on standardized international definitions and tabular formats for completing the JFSQ; (3) review current forest product statistics at national and regional levels; (4) identify the main weaknesses and constraints concerning forest statistics and to develop a set of alternative frameworks for improving national statistical processes; (5) encourage information sharing among countries and with international organizations.
This paper describes the role and the responsibilities of a national correspondent within and outside the correspondent’s country as well as some daily aspects of a forestry statistical office and its contribution to encouraging SFM.
The objective of a forestry statistical office
The main objective of a forestry statistical office is to provide statistics that improve the effectiveness of decision-making. This can be achieved by (1) collecting data of the highest quality and of the most use; (2) collecting data in a timely and cost-effective manner; (3) producing the most appropriate and accessible data products; (4) teaching the benefits and methods of using statistical information to potential data users to create more effective decision-makers.
A statistical information cycle
The key component of a forestry statistical office is the organization of the statistical information cycle, which can be structured in the following steps:
As soon as the need for a decision, action, policy, or programme is perceived:
any constraints and the information needed to implement it are defined
the information collection operation is designed, promoted, conducted and the data are collected
the information gathered is processed
the information products are produced and released
the information products are promoted and disseminated to the user
using the knowledge gained from the information products, the user makes the decision or initiates the action, policy or programme
based on information-use experience, new information needs are identified or feedback is supplied on how to improve the existing information.
For our type of data, we have annual cycles. This approach has to be repeated every time in order to keep statistical applications up to date and to respond to the needs of data consumers.
Building support for a statistical office
There is a need to build understanding and support for statistical work. Some suggestions are:
1) To take the initiative by actively promoting the value of your products and not waiting for the policy-maker or potential data user to make an approach.
2) Begin with motivation. Show the rewards of using the data. Demonstrate why your audience should heed your advice and talk about statistics.
3) Keep it simple at the beginning. Discuss only what the audience is likely to use. Avoid too much detail.
4) Build support vertically. Explain the value of your work to your superiors and subordinates within the government.
5) Build support horizontally. Visit other government agencies at your level and explain how you may help them.
6) Build external support among private businesses, organizations and individuals outside the government.
7) Recognize that you produce a valuable product. To succeed you must prove the value of your product to validate the value of your organization and your work.
8) Consult all types of data users and allow them to suggest improvements to what you collect and how the products are designed and delivered.
Despite the data being in the form the consumer expects and wants, and being in close proximity to the consumer’s required location, a conflict of interests between the data producer and data consumer will always occur.
These dynamics generate constraints that sometimes provide good opportunities to move forward. The solutions to constraints can be integrated in the statistical information cycle with the support of the forestry information centre, with appropriate hardware, software and human resources.
The cost of statistics
As reported earlier, one of the main objectives of a forestry statistical office is collecting data in a timely and cost-effective manner.
Figure 1. The relation between uncertainty and the cost of statistics
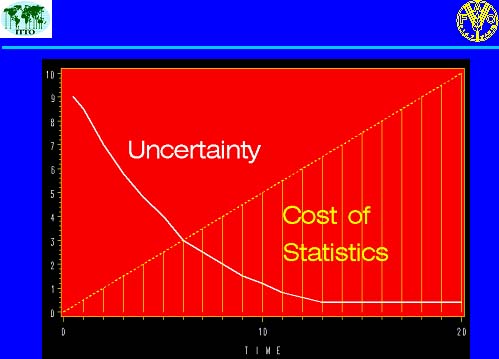
The relation between uncertainty and the cost of statistics (Figure 1) is reciprocal, but not linked linearly. Costs grow linearly, but uncertainty decreases linearly; however zero is never reached. For national correspondents, this leads to the issue of where the ideal point in the uncertainty curve is found.
Supplying and marketing statistical data products
We should assume that in the individual decision-making process, facts and statistics are not the only ingredients that are necessary to reach an effective decision. In addition, other resources and skills are required such as knowledge of the problems and specific experience, analysis and judgement to reach decisions, possibly based on a consensus at local, national, regional and global levels.
The kinds of products that a forestry statistical office should deliver are statistical, methodological, analytical and geographic. These should be disseminated to different users using different media such as publications, microfiche, computer files, CD-ROMs, online databases, video tapes and the Internet.
Each has advantages and disadvantages according to the type of user (general public, libraries, universities, government agencies, private companies, local agencies, and freelance consultants). In addition a demand for the “goods” produced has to be created by promoting and explaining the benefits of using statistics and the benefits of planning. These benefits are:
Encouragement of systematic thinking
Improved coordination of efforts
Improved performance standards
Sharpening of guidance for objectives, policies and decisions
Contingency readiness
Involvement of leaders
Confidence and priority for sector statistics comes when leaders demand accurate information and use it. The rewards of data dissemination are diverse. There is a variety of improvements, which are difficult to quantify; however statistics definitely create a form of culture that improves:
National and local economies
Management of social programmes
Data quality (from feedback)
Support for statistical efforts
Interest in international investment
The heart of any institution is data. Elaborated, this means:
Understanding your data is critical to understanding your institution, your business, your status quo.
Today’s information resource managers faced a number of problems in replying to the data demand at the end of the 1990s.
The distribution of data throughout organizations has created islands of information, making data access difficult.
The growing legions of computer users with different levels of experience are demanding more and more applications. But the cost of supporting such a diverse user community is creeping out of control.
The scope of computer science has expanded beyond such traditional applications as number crunching and file management, covering every aspect of the executive information system for business.
Different hardware systems have created an electronic maze that makes the integration of computing environments almost impossible.
How can these challenges be met?
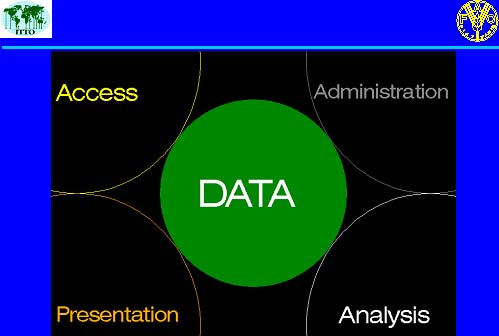
With an integrated applications system, complete control is achieved for data access, management, analysis and presentation (see Figure 2). This is applicable to any user (new or old) and any environment (from the data centre to the desktop).
The first task in any application is to identify and access the data you need.
Next the data must be arranged - to manage the facts and figures so that they can be used most effectively (administration).
Then, you must be able to work the data - to analyse the information and discover the meaning.
Finally, the data must be presented, to understand more clearly and communicate the significance of what has been learned.
These four fundamental data-driven tasks, common to all applications, are the foundation of an integrated information system.
Figure 2. The fundamental data-driven tasks
Conclusion
The work of FAO on forestry statistics is an important contribution to international approaches for improving the information on forests and the contribution of the forestry sector to national and rural economies. Adequate information is essential for a clear understanding of the problems and the formulation of sound policies and programmes, which will ensure the conservation of forests and secure the benefits of their products and services for people internationally.
F. Padovani
Fuelwood may come in many forms - stacks, bundles, baskets and headloads. Industrial roundwood is measured in the log (overbark or underbark); different measurement conventions and various rounding conventions are used. When measured by weight, moisture content is assessed. The measurement of sawnwood and wood-based panels is simpler because the products are regular in shape, but some measurement and rounding conventions may apply. Pulp is measured by weight and moisture content is calculated. Paper is measured by weight.
Standard conversions to metric measures are attached (Table 1), together with some approximate equivalents to forest measures and weight (Tables 2, 3 and 4). Because of the particular importance of wood as an energy source in Asian countries, approximate conversions from volume and weight to units of energy content are given in Table 5.
Table 1. Standard conversion factors for preparing production and trade tables
|
Units |
Metric equivalent |
|
1 inch/pouce/puigada |
= 25.4 millimetres/millimetres/milimetros |
|
1 square foot/pied carré/pie cuadrado |
= 0.0929 square metre/mètre carré/metro cuadrado |
|
1 cubic foot/pied cube/pie cubico |
= 0.02832 cubic metre/mètre cube/metro cubico |
|
1 short ton/tonne courte/tonelada corta |
= 0.9072 metric tonne/tonne métrique/tonelada metrica |
|
1 long ton/tonne longue/tonelada larga |
= 1.016 metric tonne/tonne métrique/tonelada metrica |
Table 2. Approximate equivalents for forest measures
|
Products and units |
Solid volume without bark |
|
|
|
Cubic metres |
Cubic feet |
|
Sawlogs - veneer logs/grumes, sciages + placage/ trozas, aserrada + chapas |
|
|
|
1 000 board super feet |
4.53 |
160.0 |
|
Pulpwood/bois de trituration/madera para pulpa |
|
|
|
1 stere/1 stère/1 estereo |
0.72 |
25.4 |
|
1 cord/1 corde/1 cuerda |
2.55 |
90.0 |
|
Pitprops/bois de mine/madera para minas |
|
|
|
1 piles cubic fathom/1 fathom (pied cube empilé)/1 fathom (pie cubico hacinado) |
4.28 |
151.1 |
|
1 cord/1 corde/1 cuerda |
2.42 |
85.3 |
|
Fuelwood/bois de chauffage/leña |
|
|
|
1 stere/1 stère/1 estereo |
0.65 |
23.0 |
|
1 corde/1 corde/1 cuerda |
2.12 |
74.9 |
|
1 000 stacked cubic feet/1 000 pieds empilés/1 000 pies cubicos hacinados |
18.41 |
650.0 |
Table 3. Forest product measures
|
Product and unit |
Cubic metres |
Cubic feet |
1 000 board feet |
Standard (Petrograd) |
|
Roundwood/bois rond/madera en rollo |
|
|
|
|
|
1 hoppus cubic foot/1 pied cube hoppus/1 pie cubico hoppus |
0.03605 |
1.273 |
|
|
|
1 ton of 5 hoppus cubic feet/1 tonne de 50 pieds cubes hoppus/1 tonelada de 50 pies cubicos hoppus |
1.8027 |
63.66 |
|
|
|
1 cunit |
283.16 |
100 |
|
|
|
1 cord1/1corde1/1cuerda1 |
3.625 |
128 |
|
|
|
1 stere1/1stère1/1estero1 |
1 |
35.315 |
|
|
|
1 fathom1 |
6.1164 |
216 |
|
|
|
Sawnwood/sciages/madera aserrada |
|
|
|
|
|
1 standard (Petrograd) |
4.672 |
165 |
1.98 |
1 |
|
1 000 board super feet2/1 000 pieds planches superficiels2/1 000 pies madereros superficiales2 |
236 |
83.33 |
1 |
0.505 |
|
1 ton of 50 cubic feet/1 tonne de 50 pieds cubes/1 tonelada de 50 pies cubicos |
1.416 |
50 |
0.6 |
0.303 |
|
Panels/panneaux/tableros |
|
|
|
|
|
1 000 square metres (1 millimetre thickness) |
1 |
35.315 |
0.4238 |
|
|
1 000 square feet (1.8 inch thickness) |
0.295 |
10.417 |
0.125 |
|
1 Stacked volume. 2 See “Notes on the Tables” in the Yearbook of forest products.
Table 4. Weight and volume
|
Products |
G |
C |
NC |
G |
C |
NC |
|
|
kg/CUM |
CUM/MT |
||||
|
Fuelwood/bois de chauffage/leña |
725 |
625 |
750 |
1.38 |
1.60 |
1.33 |
|
Charcoal/charbon de bois/carbon veg |
167 |
|
|
|
|
|
|
Sawlogs - veneer logs/grumes, sciages + placage/trozas, aserrada + chapas |
|
|
|
|
|
|
|
Tropical/tropicale/tropicales |
|
|
730 |
|
|
1.37 |
|
Others/autres/otras |
|
700 |
800 |
|
1.43 |
1.25 |
|
Pitprops/bois de mine/madera para minas |
725 |
700 |
800 |
1.38 |
1.43 |
1.25 |
|
Pulpwood/bois de trituration/madera para pulpa |
675 |
650 |
750 |
1.48 |
1.54 |
1.33 |
|
Other industrial roundwood/autre bois rond industrial/otras maderas en rollo industrial |
750 |
700 |
800 |
1.33 |
1.43 |
1.25 |
|
Sawnwood/sciages/madera aserrada |
|
550 |
700 |
|
1.82 |
1.48 |
|
Sleepers/traverses/traviesas |
780 |
|
|
1.28 |
|
|
|
Veneer sheets/feuilles de placage/hojas de chapa |
750 |
|
|
1.33 |
|
|
|
Plywood/contreplaque/madera terciada |
650 |
|
|
1.54 |
|
|
|
Particle board/panneaux de particules/tableros de particulas |
650 |
|
|
1.64 |
|
|
|
Fibreboard compressed/panneaux fibres durs/tableros fibra, prensados |
950 |
|
|
1.053 |
|
|
|
MDF (medium density fibreboard) |
|
|
|
2 |
|
|
|
Insulating board/panneaux fibres isolants/tableros fibra aislantes |
250 |
|
|
4 |
|
|
Note: G = general; C = coniferous; NC = non-coniferous
Table 5. Fuelwood and charcoal energy equivalents
|
|
MTCE |
Giga-joules (10°) |
Giga calories (10°) |
MTOE |
|
1 MT anthracite |
1.00 |
31.4 |
7.0 |
0.70 |
|
1 MT coal |
1.00 |
31.4 |
7.0 |
0.70 |
|
1 MT lignite |
0.67 |
21.6 |
4.8 |
0.48 |
|
1 MT coke (BR) |
0.81 |
28.5 |
7.0 |
0.70 |
|
1 MT gasoline |
1.50 |
44.0 |
10.5 |
1.05 |
|
1 MT charcoal |
0.99 |
28.9 |
6.9 |
0.69 |
|
1 MT wood (20-30% mc) |
0.5 |
14.3 |
3.5 |
0.35 |
|
1 MT wood (green) |
0.35 |
10.0 |
2.5 |
0.25 |
|
1 m3 fuelwood (solid 20-30% mc) |
0.33 |
9.4 |
2.6 |
0.26 |
|
1 m3 fuelwood (solid 0% mc) |
0.43 |
14.0 |
3.4 |
0.34 |
|
1 m3 fuelwood (solid green) |
|
7.2 |
1.8 |
0.18 |
|
1 m3 fuelwood (piled) |
0.18 |
5.0 |
1.2 |
0.12 |
|
1 MT bagasse (30% mc) |
0.50 |
14.3 |
3.5 |
0.35 |
|
1 MT dung cakes |
0.30 |
8.6 |
2.1 |
0.21 |
|
1 MT ethyl alcohol |
0.94 |
27.6 |
6.6 |
0.66 |
|
1 MT sawdust |
0.39 |
11.1 |
2.7 |
0.27 |
|
1 MT crude oil |
1.46 |
42.7 |
10.2 |
1.00 |
Note: 1 MT crude oil = 7.30 bb (barrels); MTCE = metric tonne coal equivalent; 1 MTCE = 0.68 bb crude oil; MTOE = metric tonne oil equivalent; 1 MTOE= 5 bb crude oil; mc = moisture content; 1 m3 fuelwood = 1.6 bb crude oil
F. Padovani
Statistics on forest product exports are collected by the producing enterprises, by forest authorities and by customs offices. Usually, the assembly of formal statistics on trade is carried out by the customs office in relation to the trade ministry’s central statistics office or central bank.
Trade statistics are arranged according to internationally agreed trade classifications. Most countries use either (1) the UN Standard International Trade Classification - SITC (the latest version is Revision 3, introduced in 1988 - SITC Rev. 3), or (2) the Customs Cooperation Council trade classification (CCCN or BTN), up to 1988. Since 1988, many countries have shifted to the new Harmonised System (HS) classification.
FAO collects international trade data on forest products according to a standard format, which follows the SITC and HS systems of classification as well.
More information about the World Customs Organization, the Harmonised System, all the commodities traded internationally and their six-digit HS code numbers, can be found at http://www.wcoomd.org/
The HS classification can also be viewed at: http://europa.eu.int/comm/eurostat/ramon/. Click on “english”, then “classifications” and it can be read under “H”. More information about the United Nations Standard International Trade Classification is available at: http://esa.un.org/unsd/cr/registry/default.asp; access SITC Rev.3. The SITC classification is also located at: http://esa.un.org/unsd/cr/registry/regcst.asp?Cl=14&Lg=1
Steve Johnson[10]
Background
Forest product trade is extremely important to many countries. Market and sector studies rely on information on trade and trade flows at the international level. Two main systems exist for categorizing products to ensure consistency of reporting between countries.
Harmonised Commodity Description and Coding System (HS)
Over 170 countries use the HS for reporting trade flows. The HS is administered by the World Customs Organization (WCO), located in Brussels. The latest revision of the HS was in 1996 (HS96). Revisions require a lengthy process of consultation between all members of the WCO. Trade data reported by countries are compiled by the UN Statistics Division (UNSD) in the COMTRADE database.
Standard International Trade Classification (SITC)
The SITC is administered directly by the UNSD. The latest major revision of the SITC was in 1986 (SITC Rev. 3).
The JFSQ contains a complete cross-reference between the two systems.
Table 1. Cross-reference between HS96 and SITC Rev. 3
|
Product |
HS 96 Chapter |
SITC Rev.3 Chapter |
|
Logs, sawn |
44 |
24 |
|
Panels |
44 |
63 |
|
Pulp |
47 |
25 |
|
Paper |
48 |
64 |
|
Furniture |
94 |
82 |
Problems with international trade classification systems
Units
Quantities are usually expressed in weight only; they need to be converted to volumes but no country-specific conversions are provided.
Values are often reported in national currency units; they need to be converted to US dollars requiring a decision on which point in the year to choose exchange rates or what type of average rate is to be used.
Proper analysis needs correct conversions for both volume and value but these are often lacking.
Partial reporting
This causes problems in aggregate analysis if countries only report volume or value.
The EU appears to have problems with inter-EU trade, with some countries including trade between EU countries in foreign trade statistics while some do not.
Partial reporting gives rise to the need for careful analysis to ensure aggregates are adjusted appropriately.
Coding errors
Products are misclassified (e.g. veneer sheets under plywood, mouldings under sawnwood, tropical species under temperate species or vice versa).
Countries are misclassified (e.g. Hong Kong or Taiwan R.O.C. coded as China, re-exports or trans-shipments are miscoded).
Numbers are entered incorrectly (e.g. thousands incorrectly entered; kg vs. tonnes or vice versa).
Missing reports
This is mainly a problem for developing countries.
In the Asia-Pacific Region, Cambodia, Fiji, Myanmar and Vanuatu have had no foreign trade data at all for the past decade in the COMTRADE database.
In addition, India, Malaysia, Nepal, Papua New Guinea and Thailand had no data for 2000 by the end of 2001.
Missing reports require the use of “partner analysis” to estimate trade flows, but this is inaccurate since not all partners report and those that do may make errors.
Data updating
The UNSD releases updated data for COMTRADE at quarterly intervals.
The addition of new data and the revision of existing data can completely change aggregate analyses.
Careful analysis is required to establish the reasons for changes and to ensure the new data are accurate.
Tropical timber
Eighty-four species of timber are recognized explicitly as being “tropical” at the 6-digit level in the HS.
National customs officials have many problems in identifying these 84 species (trade names only are used in the HS, versus the more accurate binomial nomenclature); moreover many species are not recognized as being explicitly tropical.
Since there are thousands of tropical species in trade, proper analysis requires examination of all source countries listed in the “Others” category in the HS.
Conclusion
International trade statistics are very useful but require careful analysis to ensure accuracy.
|
Country |
Fuelwood (1 000 m3) |
Industrial roundwood (1 000 m3) |
Sawnwood (1 000 m3) |
|||||||||
|
|
Production |
Imports |
Exports |
Consumption |
Production |
Imports |
Exports |
Consumption |
Production |
Imports |
Exports |
Consumption |
|
Australia |
6 333 |
0 |
0 |
6 333 |
24 160 |
3 |
969 |
23 194 |
3 977 |
1 025 |
86 |
4 916 |
|
China |
191 051 |
108 |
42 |
191 117 |
96 421 |
15 532 |
781 |
111 172 |
7 202 |
5 715 |
812 |
12 105 |
|
Cook Is. |
0 |
0 |
0 |
0 |
5 |
0 |
4 |
1 |
0 |
2 |
0 |
2 |
|
Fiji |
37 |
0 |
0 |
37 |
449 |
0 |
1 |
448 |
72 |
0 |
17 |
55 |
|
Maldives |
0 |
0 |
0 |
0 |
0 |
0 |
0 |
0 |
0 |
0 |
0 |
0 |
|
Mongolia |
186 |
0 |
0 |
186 |
445 |
7 |
1 |
451 |
300 |
2 |
3 |
299 |
|
Myanmar |
19 226 |
0 |
0 |
19 226 |
3 574 |
0 |
949 |
2 625 |
343 |
0 |
155 |
188 |
|
PNG |
5 533 |
0 |
0 |
5 533 |
3 064 |
0 |
1 902 |
1 163 |
218 |
0 |
20 |
198 |
|
Samoa |
70 |
0 |
0 |
70 |
61 |
0 |
6 |
55 |
21 |
8 |
1 |
27 |
|
Sol Is. |
138 |
0 |
0 |
138 |
734 |
0 |
424 |
310 |
12 |
0 |
4 |
8 |
|
Tonga |
0 |
2 |
0 |
2 |
2 |
0 |
0 |
2 |
2 |
7 |
0 |
9 |
|
Vanuatu |
91 |
0 |
1 |
90 |
40 |
0 |
0 |
40 |
18 |
1 |
10 |
9 |
|
Total |
222 665 |
110 |
43 |
222 732 |
128 955 |
15 542 |
5 037 |
139 461 |
12 165 |
6 760 |
1 108 |
17 816 |
|
World |
1 778 686 |
1 984 |
3 591 |
1 777 069 |
1 574 634 |
124 338 |
114 222 |
1 584 751 |
424 488 |
128 827 |
126 683 |
426 632 |
|
Share (%) |
13 |
6 |
1 |
13 |
8 |
12 |
4 |
9 |
3 |
5 |
1 |
4 |
|
Country |
Wood-based panels (1 000 m3) |
Pulp for paper (1 000 tonnes) |
Paper and paperboard (1 000 tonnes) |
|||||||||
|
|
Production |
Imports |
Exports |
Consumption |
Production |
Imports |
Exports |
Consumption |
Production |
Imports |
Exports |
Consumption |
|
Australia |
1 801 |
250 |
255 |
1 796 |
2 590 |
303 |
0 |
2 893 |
2 844 |
1 399 |
455 |
3 788 |
|
China |
18 647 |
7 499 |
2 120 |
24 026 |
17 961 |
3 818 |
47 |
21 732 |
35 529 |
10 448 |
3 621 |
42 356 |
|
Cook Is. |
0 |
1 |
0 |
1 |
0 |
0 |
0 |
0 |
0 |
0 |
0 |
0 |
|
Fiji |
12 |
3 |
7 |
8 |
0 |
0 |
0 |
0 |
0 |
18 |
0 |
18 |
|
Maldives |
0 |
4 |
0 |
4 |
0 |
0 |
0 |
0 |
0 |
1 |
0 |
1 |
|
Mongolia |
2 |
4 |
1 |
5 |
0 |
0 |
0 |
0 |
0 |
5 |
0 |
5 |
|
Myanmar |
15 |
2 |
13 |
4 |
42 |
0 |
0 |
42 |
40 |
31 |
0 |
71 |
|
PNG |
15 |
2 |
12 |
5 |
0 |
0 |
0 |
0 |
0 |
18 |
0 |
18 |
|
Samoa |
0 |
2 |
0 |
2 |
0 |
0 |
0 |
0 |
0 |
0 |
0 |
0 |
|
Sol. Is. |
0 |
0 |
0 |
0 |
0 |
0 |
0 |
0 |
0 |
0 |
0 |
0 |
|
Tonga |
0 |
1 |
0 |
1 |
0 |
0 |
0 |
0 |
0 |
0 |
0 |
0 |
|
Vanuatu |
0 |
2 |
0 |
2 |
0 |
0 |
0 |
0 |
0 |
0 |
0 |
0 |
|
Total |
20 492 |
7 770 |
2 408 |
25 854 |
20 593 |
4 121 |
47 |
24 667 |
38 413 |
11 920 |
4 076 |
46 257 |
|
World |
181 631 |
61 775 |
56 602 |
186 804 |
187 472 |
36 704 |
36 562 |
187 614 |
323 569 |
97 884 |
96 925 |
324 527 |
|
Share (%) |
11 |
13 |
4 |
14 |
11 |
11 |
0 |
13 |
12 |
12 |
4 |
14 |
F. Padovani
Much has been said about the importance of statistics in decision-making. The two graphs provided hereunder are evidence that realistic forest product statistics have contributed to several outlook studies, over the past 50 years, to make objective analyses of the sector to support policy formulation and investments for FAO’s member countries.
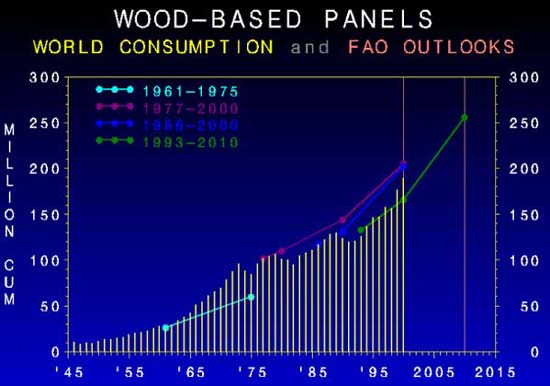
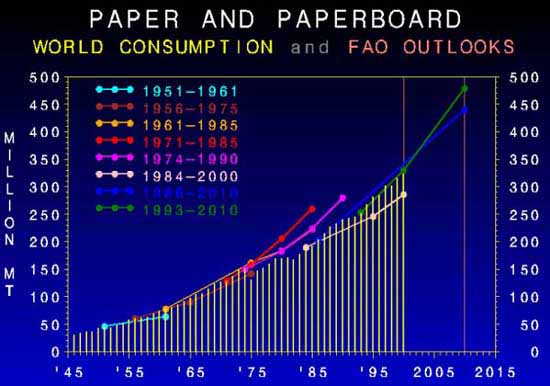
The FAO Forest Products Statistics database (FAOSTAT) displayed below is constructed as an objective collection of data that can be analysed and interpreted on a comparable base. It is available on FAOSTAT online, and via FTP on CD. Around 1 000 users access FAOSTAT online daily.
|
[9] Forestry Officer, Forestry
Planning and Statistics Branch (FONS), FAO, Viale delle Terme di Caracalla
00100, Rome. [10] International Tropical Timber Organization (ITTO), International Organizations Center - 5th floor, Pacifico-Yokohama, 1-1-1 Minato Mirai, Nishi-ku, Yokohama, Japan 220-0012. |
![]()
![]()
![]()