Table 1. Morphometric features of Aswan High Dam reservoir and Lake Nasser at 160 and 180 m level
| Parameters | L. Nasser | Entire Reservoir | |||
| 160 m | 180 m | 160 m | 180 m | ||
| Length (km) | 291.8 | 291.8 | 419.3 | 481.3 | |
| Shoreline (km) | 5 380 | 7 844 | 6 027 | 9 250 | |
| Surface area (km2) | 2 585 | 5 238 | 3 057 | 6 216 | |
| Volume (km3) | 55.6 | 132.5 | 65.9 | 156.9 | |
| Mean width (km) | 8.9 | 18.0 | 7.0 | 12.5 | |
| Depth (m): | Mean | 21.5 | 25.2 | 21.6 | 25.2 |
| Maximum | 110.0 | 130.0 | 110.0 | 130.0 | |
Table 2. Water level (metres above MSL) in 1966–1982
| Year | Maximum | Minimum |
| 1966 | 132.7 | 119.02 |
| 1967 | 141.3 | 133.48 |
| 1968 | 151.1 | 145.29 |
| 1969 | 156.4 | 150.85 |
| 1970 | 160.7 | 153.81 |
| 1971 | 164.7 | 159.65 |
| 1972 | 167.53 | 162.40 |
| 1973 | 164.67 | 158.2 |
| 1974 | 166.01 | 161.0 |
| 1975 | 170.38 | 165.6 |
| 1977 | 175.63 | 171.72 |
| 1978 | 176.82 | 172.55 |
| 1981 | 177.4 | 171.13 |
| 1982 | 175.95 | - |
Table 3. Area and volume of the reservoir (Lakes Nasser and Nubia) at various storage levels
| Level (m) | Area (km2) | Volume (109m3, or km3) |
| 120 | 450 | 5.2 |
| 125 | 600 | 7.8 |
| 130 | 749 | 11.3 |
| 135 | 988 | 15.6 |
| 140 | 1 242 | 21.2 |
| 145 | 1 589 | 28.3 |
| 150 | 1 962 | 37.2 |
| 155 | 2 414 | 48.1 |
| 160 | 2 950 | 61.5 |
| 165 | 3 581 | 77.9 |
| 170 | 4 308 | 97.6 |
| 175 | 5 168 | 121.3 |
| 180 | 6 118 | 149.5 |
| 185 | 7 174 | 182.7 |
Table 4. Water temperature of Lake Nasser
| Monthly values near High Dam (November 1970–October 1971) | Ranges (surface-bottom) of water temperature | |||||
| Month | Surface water temperature (°C) | Sites | High Dam | El-Madiq | Tushka | Adindan |
| Month/Years | ||||||
| Winter | ||||||
| November | 24.5 | February 1973 | 16.6–16.5 | 17.3–17.2 | 17.2–16.4 | 16.7–16.1 |
| December | 21.0 | December 1974 | 21 –18.7 | 22.2–21.5 | 21.2–21 | 20 –20.2 |
| Spring | ||||||
| January | 18.0 | May 1974 | 23 –16.5 | 26.5–16.5 | 27.5–18 | 25 –19 |
| February | 17.9 | April 1978 | 18 –15.8 | 22.5–16.5 | 25 –16.5 | 23.5–15.9 |
| March | 20.7 | April 1979 | 19.5–17 | 24 –17.4 | 22.5–18 | --- |
| Summer | ||||||
| April | 23.6 | July 1973 | --- | 29.4–18 | 28 –19.8 | --- |
| May | 25.4 | August 1974 | 26 –18 | 22.5–19 | 30 –18 | 27.5–19.2 |
| June | 25.8 | June 1975 | 25.7–17 | 27.7–17 | 27.5–17 | 29 –17.7 |
| July | 28.6 | July 1975 | 27.5–17.7 | 28.2–17 | 31.8–17.5 | 26.7–18 |
| August | 29.3 | August 1975 | 27.4–18.2 | 28.7–18.2 | --- | 27.6–18.7 |
| September | 28.9 | July 1979 | --- | --- | 28.2–18 | --- |
| Autumn | ||||||
| October | 26.3 | October 1975 | 24.2–18.7 | 26.7–19 | 26.2–22.6 | 24.9–19.5 |
| October 1978 | 25 –17.1 | 26.7–19.9 | 26 –18.2 | 25.2–18.2 | ||
Table 5. Dissolved oxygen concentrations (mg/l) at different stations in selected years
| High Dam | Gurf Hussein | Tushka | Adindan | ||||||
| Surface | Bottom | Surface | Bottom | Surface | Bottom | Surface | Bottom | ||
| A. Winter | |||||||||
| January | 1975 | 8.5 | 7.4 | 9.96 | 7.99 | 6.7 | 6.4 | 9.2 | 7.68 |
| February | 1971 | 8.9 | 5.4 | 10.20 | 6.18 | 10.4 | 6.0 | 12.5 | 8.70 |
| February | 1978 | 9.0 | 6.1 | 11.0 | 6.90 | 12.4 | 6.1 | 10.2 | 5.80 |
| B. Spring | |||||||||
| March | 1970 | 8.61 | 6.90 | 9.80 | 5.57 | 10.40 | 4.10 | 10.17 | 7.28 |
| March | 1976 | 7.06 | 5.88 | 8.38 | 2.90 | 9.16 | 7.19 | 9.82 | 6.54 |
| April | 1974 | 11.80 | 5.40 | 13.40 | 5.50 | 8.28 | 5.40 | 9.00 | 3.35 |
| April | 1978 | 8.20 | 5.50 | 9.20 | 6.60 | 12.00 | 6.90 | 8.90 | 5.50 |
| April | 1979 | 8.60 | 4.80 | 10.80 | 4.80 | 11.40 | 4.80 | 9.30 | 1.20 |
| C. Summer | |||||||||
| June | 1970 | 6.64 | - | 8.40 | 0.00 | 9.33 | 0.00 | 6.42 | 0.00 |
| July | 1971 | 9.78 | 0.00 | 8.52 | 0.00 | 8.14 | 0.00 | 7.84 | 0.00 |
| July | 1974 | 8.10 | 2.60 | 6.00 | 0.00 | 9.30 | 0.00 | 6.30 | 0.00 |
| July | 1975 | 5.40 | 0.30 | 4.80 | 0.68 | 7.40 | 2.80 | 7.18 | 1.17 |
| July | 1979 | 10.00 | 0.00 | 8.40 | 0.00 | 8.40 | 0.00 | 8.50 | 0.00 |
| August | 1976 | 8.40 | 0.00 | 8.60 | 0.00 | 9.50 | 0.00 | 8.00 | 0.00 |
| August | 1977 | 9.00 | 0.00 | 6.20 | 0.00 | 7.00 | 1.40 | 7.00 | 0.00 |
| D. Autumn | |||||||||
| October | 1978 | 8.20 | 0.00 | 9.00 | 0.00 | 7.65 | 0.00 | 8.60 | 0.00 |
| November | 1970 | 5.90 | 0.00 | 8.37 | 0.00 | 7.40 | 0.00 | 7.93 | 7.91 |
| November | 1974 | 5.20 | 0.00 | 5.25 | 2.00 | 5.50 | 6.00 | 6.14 | 5.90 |
| November | 1976 | 10.10 | 0.00 | 9.80 | 6.39 | 7.10 | |||
| November | 1977 | 7.50 | 8.10 | 7.80 | 8.50 | ||||
Table 6. Water transparency (cm) of Lake Nasser and Lake Nubia (1972–1979) measured by Secchi disc
| Site | Lake Nasser | ||||||||
| Month | High Dam | Adindan | Sarra | Wadi Halfa | Amaka | Murshid | Semna | Akasha | |
| April | 1972 | 220 | 75 | 180 | 140 | 170 | 160 | 80 | 35 |
| August | 1972 | 110 | 80 | 41 | - | - | - | - | - |
| February | 1973 | 410 | 120 | 135 | 81 | 81 | 55 | 54 | 52 |
| July | 1973 | 130 | 80 | 66 | 47 | 35 | 20 | 8 | 3 |
| August | 1976 | 180 | 100 | 70 | 60 | 45 | 15 | - | 3 |
| July | 1979 | 125 | 80 | 112 | 112 | 60 | 50 | - | 20 |
Table 7. Annual average transparency (cm) of Lake Nasser
| Site | Aswan High Dam | Kalabsha | Gurf Hussein | Madiq | Ibrim | Armina | Adindan |
| Period | |||||||
| 1970/71 | 174 | 139 | 133 | 113 | 91.7 | 89 | 81.6 |
| 1974/75 | 220 | 177 | 153 | 151 | 115 | 93 | 70 |
| 1976/79 | 223 | 194 | 157 | 167 | 139 | 140 | 126 |
Table 8. Electrical conductivity (μmhos cm-1) of Lake Nasser
| High Dam | Kalabsha | Gurf Hussein | Madiq | Amada | Tushka | Adindan | ||
| A. Summer | ||||||||
| July | 1973 | 258.0 | 251.0 | 246.0 | 243.0 | 247.0 | 256.0 | 272.0 |
| July | 1974 | 231.7 | 221.0 | 220.6 | 219.0 | 215.3 | 242.7 | 256.9 |
| July | 1975 | 222.9 | -- | 240.0 | -- | 202.0 | -- | 224.0 |
| July | 1979 | -- | -- | 238.0 | -- | 234.0 | 237.0 | 236.0 |
| B. Autumn | ||||||||
| November | 1970 | 302.0 | 298.0 | 270.0 | 231.0 | 231.0 | 212.0 | -- |
| November | 1974 | 240.2 | 243.1 | 235.3 | 232.2 | 210.9 | 205.6 | 185.1 |
| November | 1976 | 221.1 | -- | 225.6 | -- | 222.5 | -- | 200.0 |
| October | 1978 | 272.5 | 236.8 | 250.1 | 243.3 | 241.0 | 229.0 | 228.0 |
| C. Winter | ||||||||
| February | 1973 | 245.0 | 244.0 | 230.0 | 220.0 | 225.0 | 227.0 | 223.0 |
| January | 1975 | 237.5 | 237.7 | 232.7 | 218.8 | 212.0 | 206.6 | 187.7 |
| February | 1977 | 201.0 | -- | 200.0 | -- | 192.0 | -- | 180.0 |
| D. Spring | ||||||||
| April | 1974 | 253.6 | 233.8 | 229.0 | 230.3 | 225.5 | 223.3 | 169.0 |
| May | 1977 | 223.2 | -- | 230.0 | -- | 220.0 | -- | 248.0 |
Table 9. Average values of electrical conductivity (μmhos cm-1)
| Sites | I | II | III | IV | V | VI | VII |
| Season | |||||||
| Winter | (February 1973, December 1974 and January 1975) | ||||||
| 214.5 | 244 | 233 | 222 | 216 | 213 | 199 | |
| Spring | (April and May 1974) | ||||||
| 249 | 231 | 231.5 | 228.5 | 224 | 223 | 198.5 | |
| Summer | (July 1973, July and August 1974, June, July and August 1975) | ||||||
| 229 | 226.5 | 225 | 226 | 231 | 237.5 | 244 | |
| Autumn | (September and November 1974, November 1974 and October 1975) | ||||||
| 265.5 | 265.5 | 250.5 | 245.8 | 237 | 218 | 205.8 | |
Table 10. Nutrient concentrations (mg/l)
| Nutrient | Year | Range | Average | ||
| Surface | Bottom | Surface | Bottom | ||
| Orthophosphate | 1976/77 | 0.11–0.235 | 0.20–0.338 | 0.167 | 0.282 |
| 1970/71 | 0.066–0.136 | 0.228–0.682 | 0.104 | 0.372 | |
| Nitrate | 1976/77 | 0.675–1.25 | 0.667–1.267 | 0.95 | 1.01 |
| 1970/71 | 0.001–0.264 | 0.04–0.291 | 0.108 | 0.138 | |
| Silicate | 1976/77 | 14.5–20.5 | 15.83–19.2 | 17.04 | 17.34 |
| 1970/71 | 13.5–15.62 | 12.45–17.18 | 14.66 | 15.96 | |
Table 11. Ranges of pH at various stations
| Depth | December 1974–January 1975 | February 1977 & February 1978 |
| Surface | 7.85–8.19 | 8.25–8.95 |
| 30 m | 7.91–8.06 | 8.0 –8.85 |
| Bottom | 7.85–8.08 | 8.0 –8.80 |
Table 12. Seasonal ranges of chlorides (mg/l)
| Period Season | 1970/71 | 1975/76 | 1977/78 |
| Winter | 2.41–4.6 | 4.33–8.04 | 6–8.2 |
| Spring | 3.37–4.42 | 6.3 –9.77 | 10.24–12.57 |
| Summer | 4.05–5.36 | 6.59–8.55 | 9.07–11.73 |
| Autumn | 1.53–3.47 | 4.6 –7.0 | 7.83–9.99 |
| Absolute range | 1.53–5.36 | 4.33–9.77 | 7–12.57 |
Table 13. List of fish species for Lake Nasser
| Family | Species | |
| 1. | PROTOPTERIDAE | Protopterus aethiopicus |
| 2. | POLYPTERIDAE | Polypterus bichir |
| 3. | MORMYRIDAE | Mormyrops anguillides |
| Petrocephalus bane | ||
| Marcusenius isidori | ||
| Gnathonemus cyprinoides | ||
| Mormyrus kannume | ||
| M. caschive | ||
| Hyperopisus bebe | ||
| 4. | GYMNARCHIDAE | Gymnarchus niloticus |
| 5. | CHARACIDAE | Hydrocynus forskalii |
| H. lineatus | ||
| H. brevis | ||
| Alestes nurse | ||
| A. baremose | ||
| A. dentex | ||
| 6. | CITHARINIDAE | Distichodus niloticus |
| Citharinus citharus | ||
| C. latus | ||
| 7. | CYPRINIDAE | Chelaethiops bibie |
| Barilius niloticus | ||
| B. loati | ||
| Labeo forskalii | ||
| L. niloticus | ||
| L. coubie | ||
| L. horie | ||
| Discognathus vinciguerrae | ||
| Barbus werneri | ||
| B. perince | ||
| B. neglectus | ||
| B. anema | ||
| 8. | CLARIIDAE | Clarias anguillaris |
| C. lazera | ||
| 9. | SCHILBEIDAE | Eutropius niloticus |
| Schilbe mystus | ||
| Siluranodon auritus | ||
| 10. | BAGRIDAE | Bagrus bayad |
| B. docmac | ||
| Chrysichthys auratus | ||
| C. rueppelli | ||
| Clarotes laticeps | ||
| Auchenoglanis biscutatus | ||
| A. occidentalis | ||
| 11. | MOCHOKIDAE | Synodontis schall |
| S. serratus | ||
| S. clarias | ||
| Mochocus niloticus | ||
| Chiloglanis niloticus | ||
| 12. | MALAPTERURIDAE | Malapterurus electricus |
| 13. | CICHLIDAE | Tilapia nilotica |
| T. galilaea | ||
| 14. | CENTROPOMIDAE | Lates niloticus |
| 15. | TETRODONTIDAE | Tetraodon fahaka |
Table 14. Calculated weight (g) for different age groups
| I | II | III | IV | V | VI | VII | VIII | IX | X | XI | XII | XIII | XIV | XV | |
| Tilapia nilotica | 412.4 | 1 301.0 | 2 209.0 | 2 836.0 | |||||||||||
| T. galilaea | 315.5 | 674,9 | 943.5 | 1 344.0 | |||||||||||
| Alestes nurse | 1.21 | 4.79 | 10.81 | 19.52 | 34.52 | ||||||||||
| Labeo forskalii | 95.9 | 274.5 | 624.2 | 924.2 | 1 332.0 | ||||||||||
| Eutropius niloticus | 13.0 | 60.0 | 105.0 | 185.0 | 221.0 | 360.0 | |||||||||
| Alestes baremose | 3.37 | 27.27 | 100.8 | 265.18 | 497.49 | 705.97 | 977.0 | ||||||||
| Labeo niloticus | 139.9 | 540.3 | 1 342 | 2 260.5 | 3 335 | 4 395 | 5 404 | ||||||||
| Barbus bynni | 156.1 | 521.9 | 1 168 | 2 107.7 | 3 569.3 | 4 922.5 | 6 736 | ||||||||
| Hydrocynus forskalii | 815 | 331.1 | 731.6 | 1 262.0 | 1 861.0 | 2 215.0 | 2 556 | ||||||||
| Labeo horie | 172.2 | 708.2 | 1 638.0 | 2 615.0 | 3 864.0 | 5 429.0 | 6 826 | 8 271 | |||||||
| L. coubie | 210.6 | 584.3 | 1 180.9 | 2 238.2 | 3 181.3 | 4 801.0 | 6 232 | 7 232 | |||||||
| Lates niloticus | 300.0 | 850.0 | 2 350.0 | 3 611.0 | 4 598.0 | 6 098.0 | 6 250 | 1 150 | -- | 20 400 | 29 550 | 38 950 | 43 900 | 49 150 | 53 800 |
Table 15. Diameter of mature ripe eggs of important fish species
| Species | Egg diameter (μ) |
| Lates niloticus | 600 – 775 |
| Alestes nurse | 800 – 825 |
| A. baremose | 925 |
| Schilbe uranoscopus | 800 – 825 |
| Eutropius niloticus | 850 – 1 025 |
| Hydrocynus forskalii | 850 – 950 |
| Labeo coubie | 1 000 – 1 050 |
| L. horie | 1 050 – 1 200 |
| L. niloticus | 1 050 – 1 225 |
| Synodontis serratus | 1 200 – 1 225 |
| S. schall | 1 200 – 1 250 |
| Bagrus docmac | 1 350 – 1 425 |
| Mormyrus kannume | 1 925 – 2 170 |
| M. caschive | 2 100 – 2 300 |
| Tilapia nilotica | 2 800 |
| T. galilaea | 2 500 – 2 800 |
Table 16. Fecundity (number of ovarian mature/ripe eggs in peak of spawning season)
| A. Variation with length | |||
| Species | Standard length range (cm) | Average fecundity absolute (thousands) | Relative (per cm body length) |
| Tilapia galilaea | 17.5–34.5 | 1.4– 7.2 | 80– 209 |
| Alestes nurse | 6.5–13.5 | 6.5–24.5 | 1 000– 1 815 |
| Eutropius niloticus | 20–34 | 31–65 | 1 425– 1 832 |
| A. baremose | 24–42 | 28.5–223.7 | 1 187– 5 326 |
| L. niloticus | 27.8–51.5 | 89.2–618.3 | 3 208–12 006 |
| B. Variation with age | ||||
| Age group | Lates niloticus | Alestes baremose | Eutropius niloticus | Tilapia galilaea |
| Average | ||||
| I | 3 300 | |||
| II | 139 000 | 4 400 | ||
| III | 262 000 | 28 500 | 30 500 | 4 900 |
| IV | 481 900 | 97 900 | 37 500 | 5 600 |
| V | 140 800 | 48 500 | ||
| VI | 206 600 | 55 000 | ||
| VII | 223 700 | |||
Table 17. Percentage of important fish species in total landings in selected years
| Years | Tilapia | Alestes and Hydrocynus | Labeo and Barbus | Lates | Catfishes | Others |
| 1968 | 26.81 | 35.15 | 28.66 | 3.18 | 3.77 | 2.42 |
| 1970 | 41.48 | 21.60 | 17.64 | 9.29 | 5.45 | 4.54 |
| 1973 | 68.39 | 13.13 | 5.09 | 4.67 | 3.37 | 5.34 |
| 1976 | 65.99 | 19.01 | 6.94 | 3.17 | 1.13 | 3.76 |
| 1978 | 75.09 | 17.45 | 4.07 | 1.91 | 0.43 | 1.04 |
| 1981 | 90.1 | 4.3 | 3.8 | 1.4 | 0.4 | - |
Table 18. Composition of fish landings according to food habits
| Years | Periphyton1 and plankton | Plankton2 | Carnivorous3 | Omnivorous4 |
| 1968 | 26.81 | 14.75 | 25.87 | 32.57 |
| 1970 | 41.48 | 9.1 | 24.89 | 24.53 |
| 1972 | 49.81 | 10.04 | 23.52 | 16.63 |
| 1974 | 58.95 | 8.89 | 18.68 | 13.48 |
| 1976 | 65.99 | 8.01 | 14.67 | 11.33 |
| 1978 | 75.09 | 7.35 | 12.18 | 5.39 |
1 Tilapia
2 Alestes
3 Lates, Hydrocynus, Bagrus
4 Labeo, Barbus, synodontids, schilbeids, mormyrids
Table 19. Percentage of fresh fish landings in selected years
| Periods | Years | |||
| 1967/71 | 1975 | 1976 | 1981 | |
| January–February | 13.01 | 13.99 | 13.27 | 15.28 |
| March–April | 28.94 | 29.50 | 30.81 | 29.87 |
| May–June | 18.86 | 15.74 | 18.46 | 15.07 |
| July–August | 18.47 | 16.04 | 18.06 | 12.13 |
| September–October | 13.50 | 13.94 | 12.95 | 11.84 |
| November–December | 8.18 | 10.68 | 6.47 | 15.81 |
Table 20. Distance between the suggested villages and projected Egyptian-Sudan road
| Name of area | Approximate distance from the navigation channel (km) | Approximate distance from the Egypt-Sudan road (km) |
| Abu Simbel | 4 | 1 |
| Tushka | 8 | 17 |
| Eneiba-Ibrim | 2.5 | 20 |
| Korosko | 2.5 | 62 |
| El-Sibu | 0.7 | 57 |
| El-Allaqi (south) | 15 | - |
| El-Allaqi (north) | 35 | 50 |
| El-Meharaka-Sayala | 5 | 50 |
| Mirwaw | 5 | 52 |
| Dihmit | 5 | 17 |
Table 21. Percentage composition of fish species in the commercial catch from the River Nile (1976/78)
| Fish species | Locality | |||||
| Cairo | Beny Sweif | El-Menia | Assuit | Zifta | Kafr El-Zaiat | |
| Tilapia nilotica | 59.5 | 62.0 | 63.0 | 57.0 | 81.0 | 85.0 |
| T. galilaea | 2.0 | 2.0 | 1.0 | 4.5 | 1.0 | - |
| T. zillii | 1.0 | 1.0 | 1.0 | 2.0 | 1.0 | 1.0 |
| Clarias lazera | 9.0 | 8.5 | 5.5 | 6.5 | 4.0 | 3.0 |
| Bagrus bayad | 8.0 | 6.0 | 4.5 | 7.5 | 3.0 | 3.5 |
| B. docmac | 0.5 | 1.0 | 2.5 | 4.5 | - | - |
| Synodontis schall | 3.5 | 2.0 | 4.5 | 3.0 | 0.5 | 0.5 |
| Labeo niloticus | 6.5 | 7.5 | 7.5 | 6.5 | 3.0 | 2.0 |
| Barbus bynni | 5.0 | 7.0 | 8.5 | 4.5 | 2.0 | 2.0 |
| Alestes dentex | 1.0 | 1.0 | 0.5 | 0.5 | 1.0 | 1.0 |
| Anguilla anguilla | 2.0 | 1.0 | 0.5 | 1.0 | 2.5 | 2.0 |
| Lates niloticus | 1.5 | 1.0 | 1.0 | 0.5 | - | - |
Table 22. Fish landings and number of boats from the River Nile (Egypt) in selected years
| Year | Landings (t) | No. of boats | Year | Landings (t) | No. of boats |
| 1958 | 4 000 | 2 671 | 1969 | 7 560 | 5 504 |
| 1970 | 8 900 | 6 226 | |||
| 1961 | 3 580 | 2 552 | 1972 | 8 700 | 8 966 |
| 1964 | 3 140 | 2 886 | 1974 | 7 500 | 8 941 |
| 1965 | 3 560 | 2 986 | 1976 | 8 600 | 9 614 |
| 1967 | 5 800 | 3 360 | 1979 | 9 000 | 10 205 |
| 1980 | 8 400 | 14 069 |
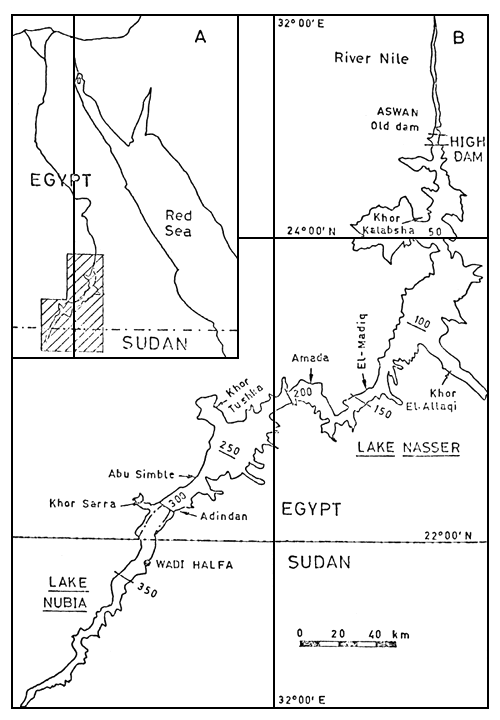
Figure 1. A - Location of the Aswan High Dam reservoir in Egypt and Sudan
B - Lake Nasser and Lake Nubia
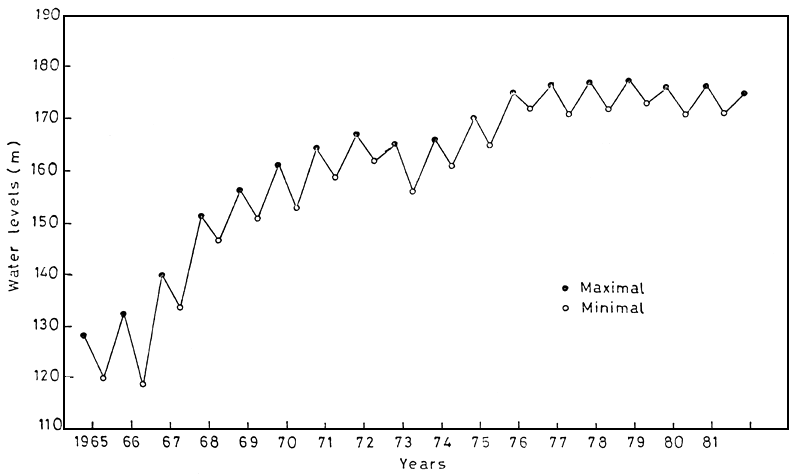
Figure 2. Maximal and minimal water levels (m a.s.l.) of Lake Nasser in the period 1965–1981
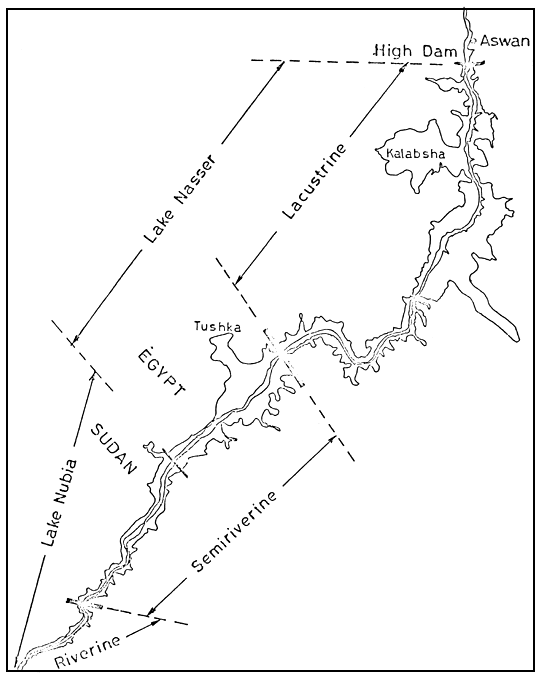
Figure 3. Regions of the Aswan High Dam reservoir
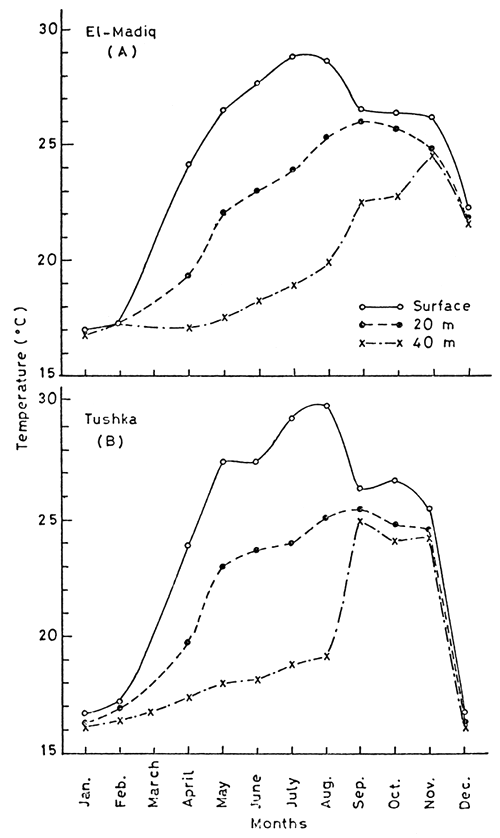
Figure 4. Monthly water temperature at the surface, and at 20 m and 40 m depths at El-Madiq and Tushka
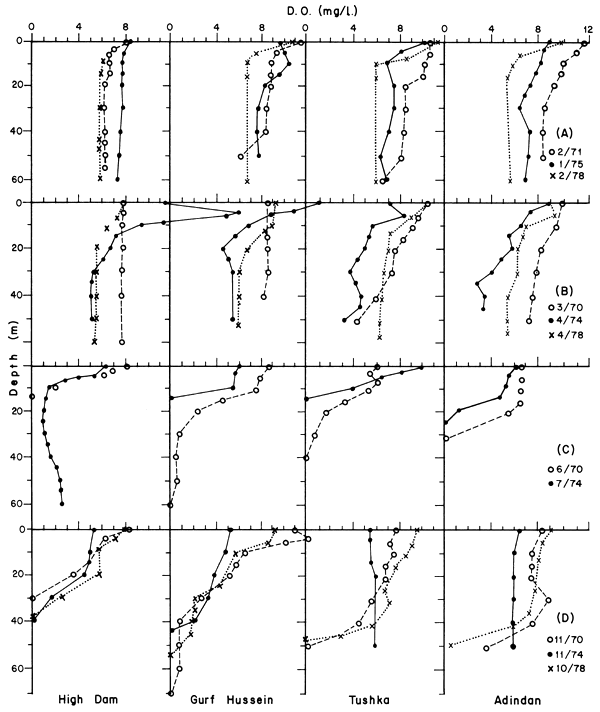
Figure 5. Dissolved oxygen (mg/l) profile in Lake Nasser in different seasons at different selected stations in different years
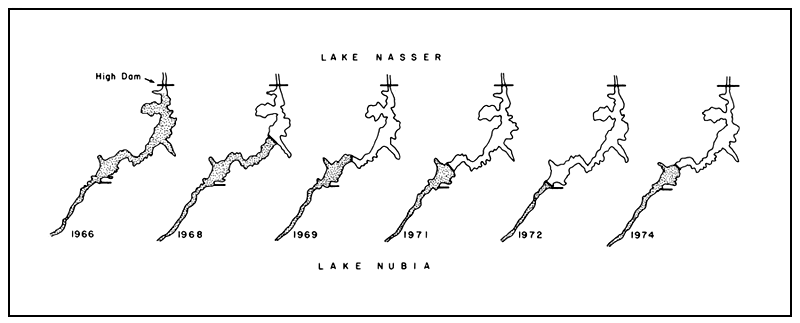
Figure 6. Extent of flood turbid water in some selected years
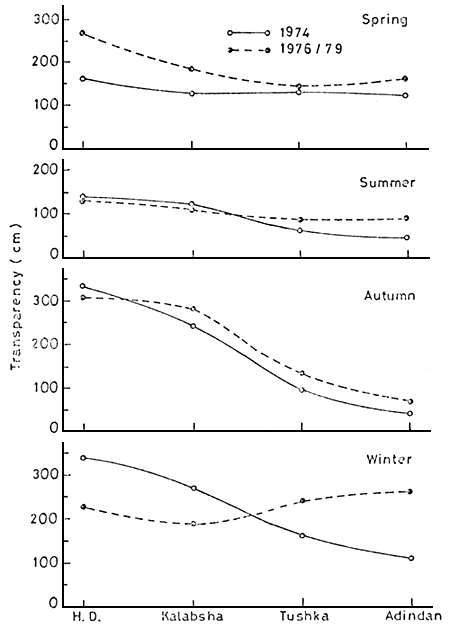
Figure 7. Seasonal average Secchi disc transparency (cm) for some stations of Lake Nasser (1974–79)
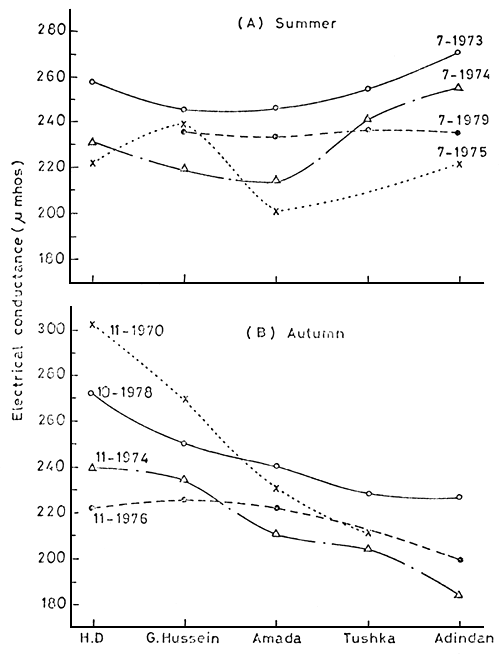
Figure 8. Electrical conductivity (umhos cm-1) of Lake Nasser during summer and autumn in selected years. HD = High Dam
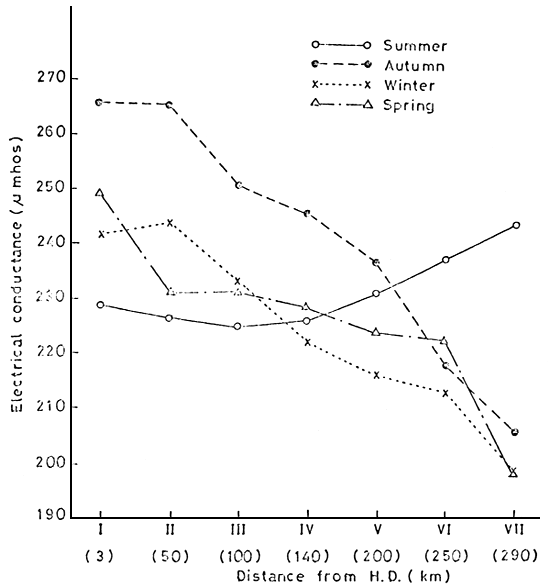
Figure 9. Average values of electrical conductivity of Lake Nasser in different seasons. HD = High Dam
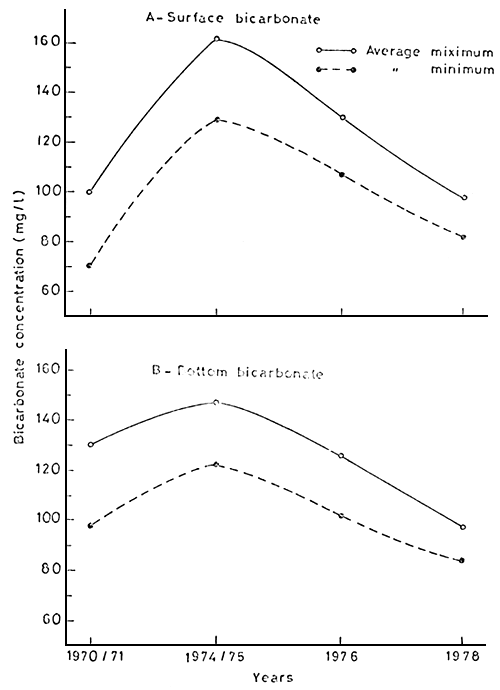
Figure 10. Average maximum and minimum bicarbonate concentrations of surface and bottom water of Lake Nasser during 1970–78
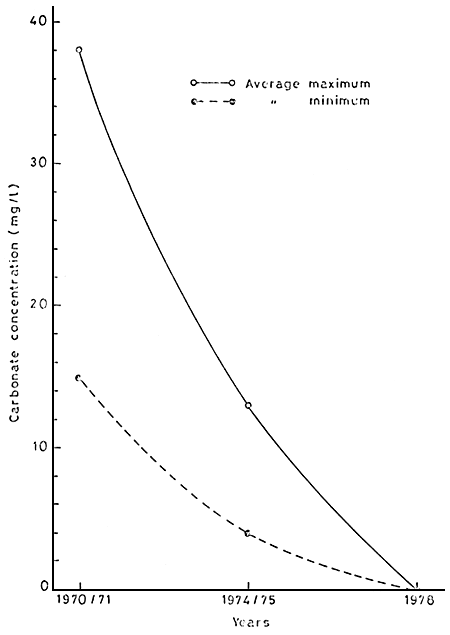
Figure 11. Carbonate concentrations of Lake Nasser between 1970 and 1978
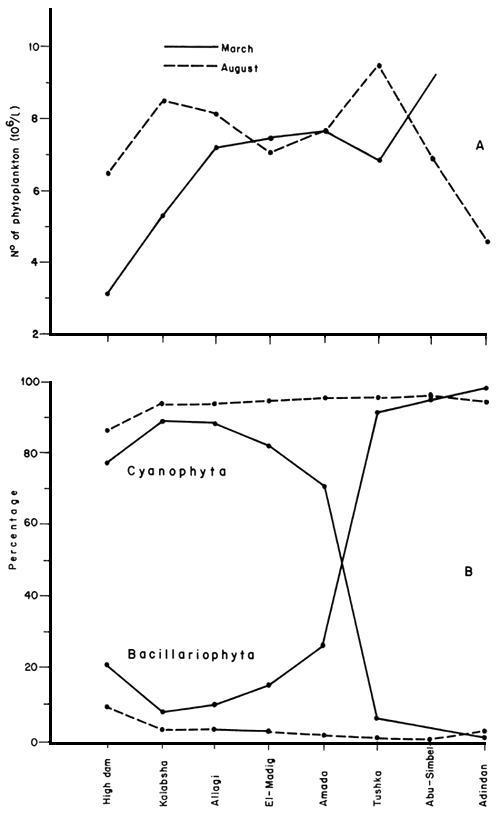
Figure 12. Phytoplankton at different stations along main channel of Lake Nasser in March and August 1976
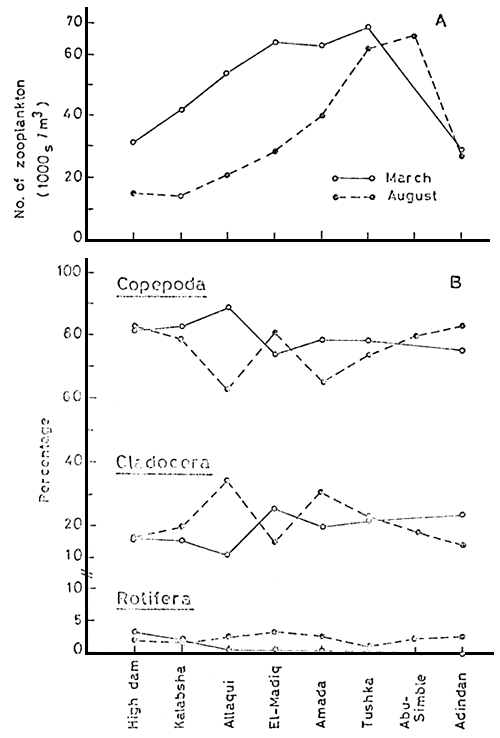
Figure 13. Zooplankton at different stations along the main
channel of the Nile flooded by Lake Nasser, March
and August 1976. (A) Number (thousand/m3),
(B) Percentage of Copepoda, Cladocera and Rotifera
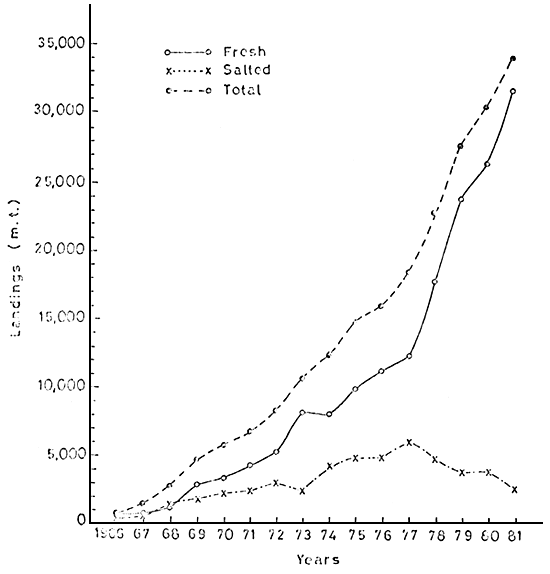
Table 14. Commercial fish landings (1966–1981)
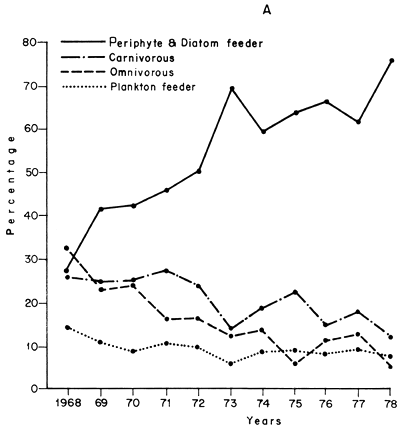 | 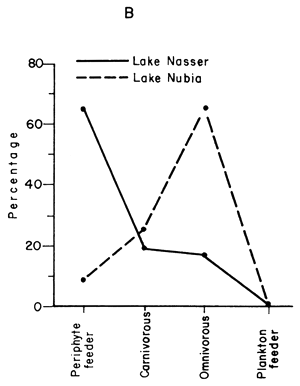 |
Table 15. A - Percentage of fish of different food habit among landings of Lake Nasser
B - Comparison between lakes Nasser and Nubia, exploratory fishing in July 1979
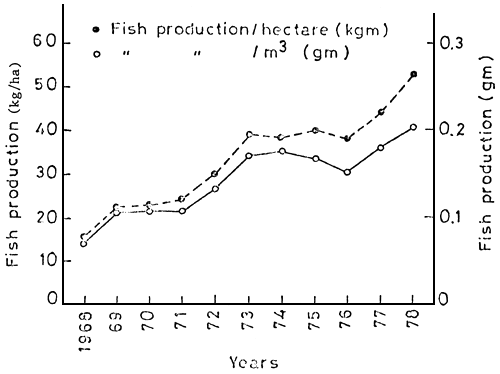
Figure 16. Fish production per hectare or per m3 during 1968–78
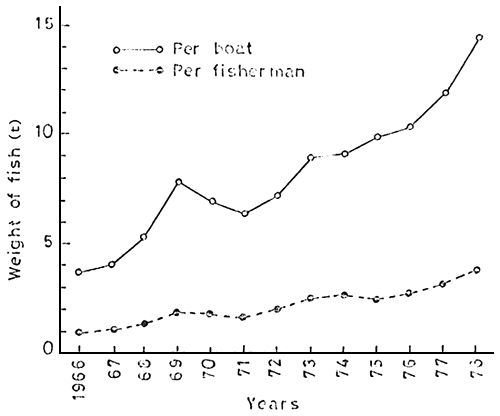
Figure 17. Fish landings per boat and per fishermen
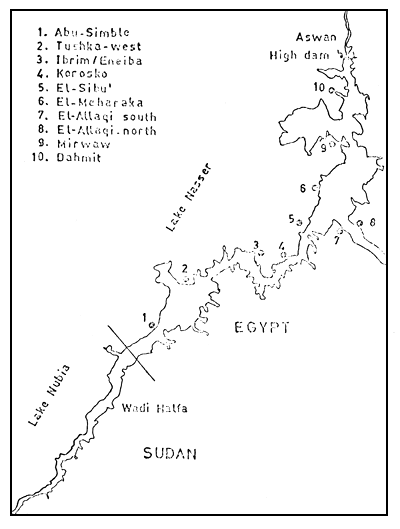
Figure 18. Suggested human settlement sites in Lake Nasser
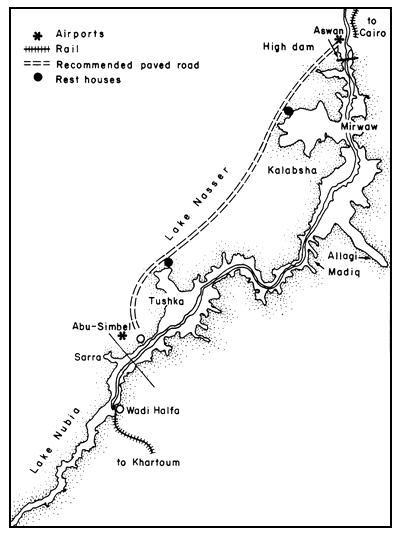
Figure 19. Transportation and navigation routes in Lake Nasser
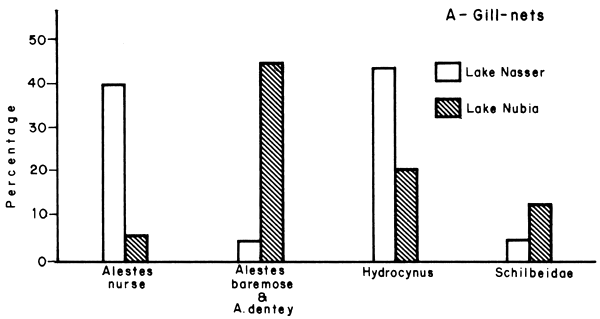
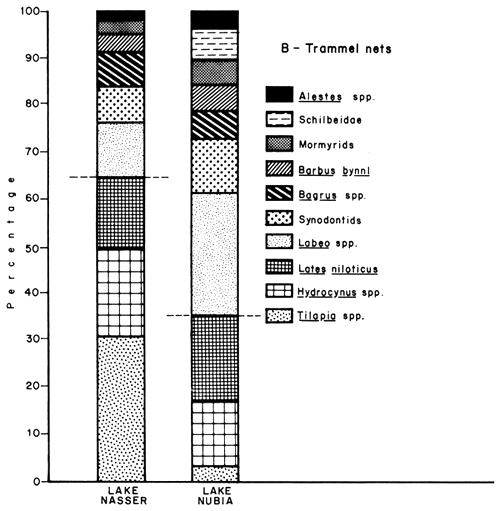
Figure 20. Frequency of main fish species in catch of gillnets (A) and trammel nets (B) (1972–1974)
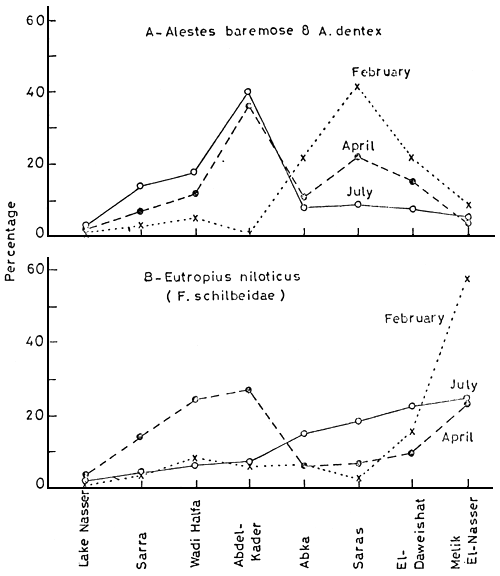
Figure 21. Distribution of percentage of Alestes baremose and A. dentex (A) and Eutropius niloticus (B) in lakes Nasser and Nubia
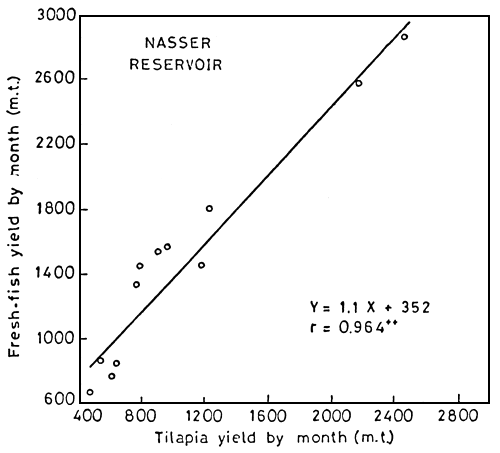
Figure 22. Relationship between tilapia and total landings
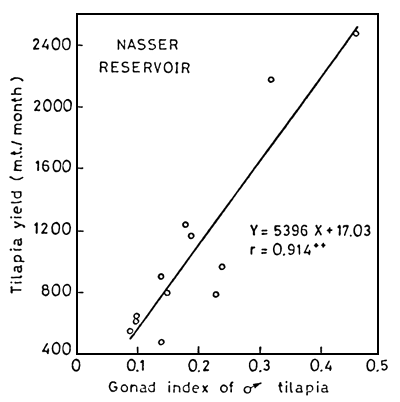
Figure 23. Relation between Tilapia landings and male's gonad index
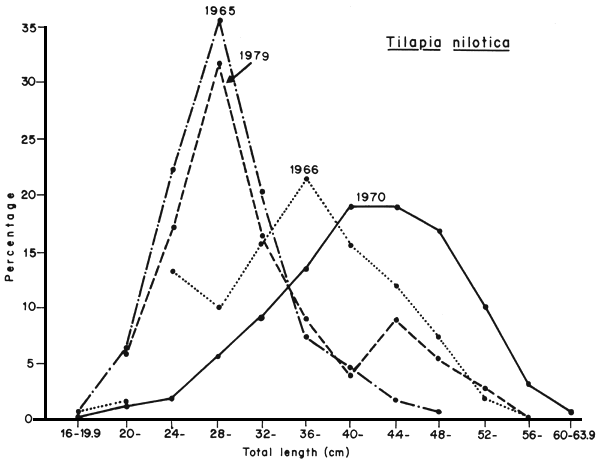
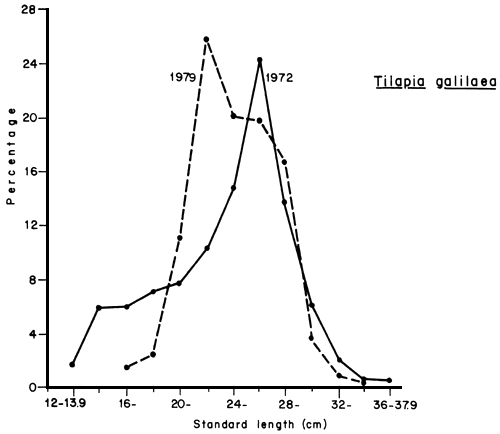
Figure 24. Length frequency composition of Tilapia nilotica and Tilapia galilaea
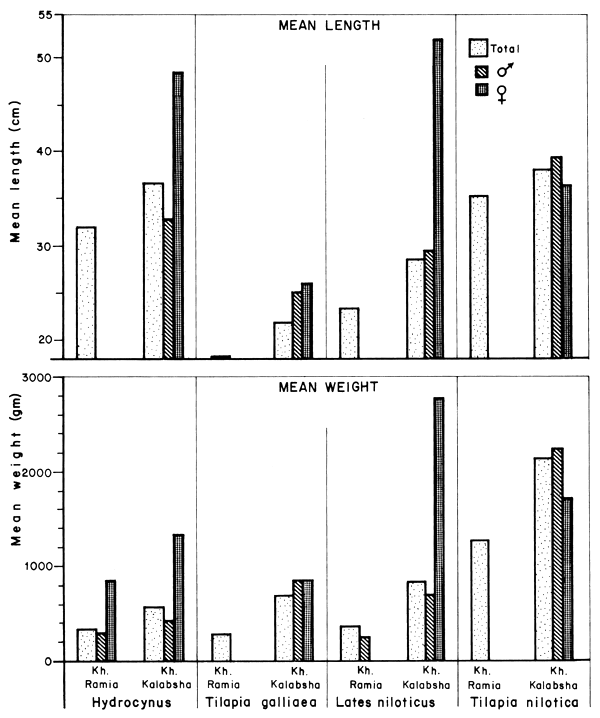
Figure 25. Mean length and weight of some species caught during experimental fishing in Khors El-Ramla and Kalabsha
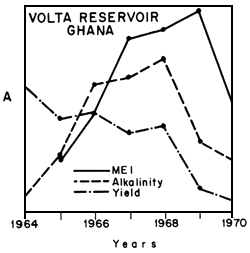
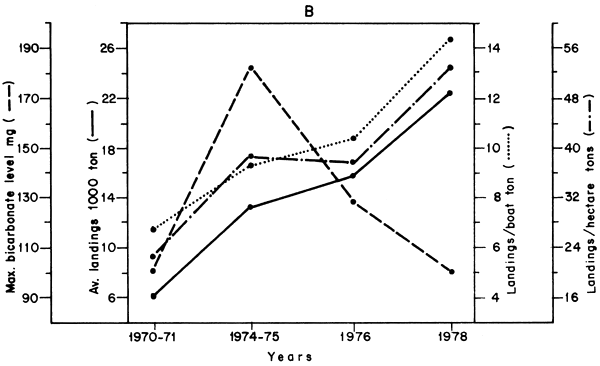
Table 26. A - Relation between morph-edaphic index, alkalinity and fish yield in Lake Volta (Henderson et al., 1973)
B - Maximum bicarbonate concentration versus fish production in some years in Lake Nasser