![]()
![]()
![]()
Institute of Experimental Botany
Laboratory of Molecular Cytogenetics and Cytometry
Sokolovská 6
CZ-77200 Olomouc
Czech Republic
E-mail: [email protected]
Abstract
This work focused on the development of flow cytometry and molecular cytogenetics for Musa, and on the use of new tools for detailed and more efficient characterisation and analysis of its genome at the nuclear and chromosomal levels. Using flow cytometry, genome size of Musa was determined for the first time, and the extent of its variation was assessed. The method was invaluable for the rapid estimation of ploidy levels and detection of mixoploidy. While the method remains an important research tool, it is being increasingly used in Musa breeding programmes. Molecular cytogenetical methods that permit physical mapping of DNA sequences to Musa chromosomes were developed and used first to obtain physical chromosome landmarks and to characterise various repetitive DNA sequences. A novel method for preparation of high molecular weight DNA has been developed, and work is under way to construct the first Musa B-genome BAC library. The results obtained represent major steps forward in our quest to understand chromosome structure and evolution in Musa. They provide a sound basis for more targeted application of mutation techniques for the breeding of improved cultivars of bananas and plantains.
1. INTRODUCTION
Bananas and plantains (Musa spp.) provide food for millions of people in the tropics and are one of major export commodities in many developing countries. Recently, diseases caused by pathogenic fungi, bacteria or viruses have threatened their production. Most of the cultivated clones originated as spontaneous variants and are highly susceptible. Conventional breeding of improved materials has been hampered by the complicated genetic system of Musa. It is becoming clear that the efficiency of classical breeding may be improved by using biotechnological approaches, including molecular techniques. Furthermore, characterisation of natural germplasm must be considerably improved. While significant progress has been made in the analysis of the nuclear genome at the molecular level, knowledge of the genome at the nuclear and chromosomal level remains poor. There is also an urgent need to obtain physical maps of the Musa genome and to integrate them with existing genetic maps. An integrated genome map would be an indispensable tool for effective breeding as well as for map-based cloning of genes of interest. An essential step in the development of an integrated map is the accumulation of sufficient numbers of cytogenetic markers across the Musa genome.
Attempts to characterise the Musa genome chromosomally go back to the first quarter of the twentieth century [1]. Although a number of studies have been made since then, the cytogenetics of Musa remained poorly developed until the mid 1990s. Most studies have focused on the analysis of ploidy and chromosome number both in wild species and cultivated clones. Very often unreliable indirect methods have been used to avoid difficulties with chromosome counting. Information on chromosome structural changes comes predominantly from meiotic studies, while the genomic constitution of hybrids has been estimated exclusively from morphological parameters. Information on the Musa karyotype has been scarce and often contradictory. Without any doubt, a major problem has been a lack of suitable analytical tools. This report summarises the development of flow cytometry and molecular cytogenetics for Musa, and their use for detailed and more efficient characterisation and analysis of genome of Musa at the nuclear and chromosomal level.
2. FLOW CYTOMETRIC ESTIMATION OF NUCLEAR DNA CONTENT
Flow cytometry allows rapid, convenient and precise estimation of nuclear DNA content in plants [2]. In 1994, Doleel et al. modified the technique for bananas and plantains [3]. The study indicated a great potential of flow cytometry for the analysis of the Musa genome. Applications of DNA flow cytometry included estimation of nuclear genome size and rapid determination of ploidy level.
2.1. Determination of nuclear genome size
Diploid (2n = 2x = 22) and triploid (2n = 3x = 33) Musa species and clones were obtained from the International Network for Improvement of Bananas and Plantains (INIBAP) Transit Centre (Katholieke Universiteit, Leuven, Belgium). Sample preparation and analysis were performed as described by Lysák et al. [4]. Nuclei isolated from leaf tissues of soybean (Glycine max 'Polanka', 2C = 2.50 pg DNA) served as an internal reference standard. The histograms obtained after flow cytometric analysis of fluorescence intensity of propidium iodide-stained nuclei showed two dominant peaks corresponding to G1 nuclei of Glycine and Musa, respectively. Typical histograms obtained during the analysis of the genome size in diploid Musa clones are shown in Figure 1. The ratio of G1 peak means (Glycine/Musa) was calculated, and the DNA content of Musa was estimated according to the formula: 2C DNA content (pg) = 2.50/peak ratio. The results of the analysis are summarised in Table 1. They demonstrated that Musa is a taxon with a small genome which is only about four to five times larger than that of Arabidopsis thaliana. This fact makes it amenable for analysis and mapping at the molecular level.
Figure 1 Histograms of nuclear DNA content obtained during the analysis of diploid Musa clones. (A) 'Calcutta 4' (ITC 0249); (B) Musa balbisiana (ITC 0545). Nuclei isolated from soybean (Glycine max) were used as an internal reference standard
The extent of variation in the genome size was assessed using a nested ANOVA and Bonferroni multicomparison test. The analysis demonstrated a significant difference between the sizes of the A and the B genomes, the B genome being smaller by 12% on average. While no variation in genome size was found among the accessions of M. balbisiana (average genome size 1Cx = 537 Mbp), small but statistically significant variation was found among the subspecies and clones of M. acuminata (1Cx ranging from 591 to 615 Mbp). This difference may relate to the geographical origin of individual accessions. Larger variation in the genome size (8.8%) was found among the triploid Musa accessions (1Cx ranging from 559 to 613 Mbp). This variation may be due to different genomic constitutions as well as due to the differences in the size of their A genomes.
Hierarchical cluster analysis was employed to analyse the relationship among various Musa accessions based on nuclear DNA content. The unweighted pair-group method was chosen for the analysis, using Manhattan distance as a dissimilarity coefficient. Mean nuclear DNA contents estimated in individual plants were used as operational units; genotypes were used as clustering groups. As can be seen in Figure 2, the analysis resulted in grouping that agreed fairly well with the generally accepted taxonomic classification of Musa. The two accessions ('Red Dacca' and 'Pelipita'), in which the classification has not been confirmed, will be subject to further analysis with the aim of explaining this discrepancy.
Table 1 Summary and statistical analysis of results obtained by flow cytometric estimation of nuclear DNA content in Musaa
|
Accession name |
ITC Codeb |
Genome |
2C nuclear DNA content (pg) |
Mean genome size (Mbp/1Cx)c |
Bonferroni's grouping (P = 0.01) |
|
|
Mean |
± S.E. |
|||||
|
Diploids |
||||||
|
Higa |
0428 |
AA |
1.225 |
0.002 |
591 |
A |
|
Niyarma Yik |
0269 |
AA |
1.252 |
0.002 |
604 |
B |
|
Pa (Rayong) |
0672 |
AA |
1.261 |
0.004 |
608 |
BC |
|
Pisang Mas |
0653 |
AA |
1.274 |
0.002 |
615 |
C |
|
M. balbisiana |
0094 |
BB |
1.108 |
0.005 |
534 |
D |
|
Cameroun |
0246 |
BB |
1.121 |
0.003 |
540 |
D |
|
Triploids |
||||||
|
Agbagba |
0111 |
AAB |
1.737 |
0.002 |
559 |
E |
|
Pelipita |
0472 |
ABB |
1.751 |
0.002 |
563 |
E |
|
Obino l'Ewai |
0109 |
AAB |
1.777 |
0.004 |
572 |
F |
|
Prata |
0207 |
AAB |
1.805 |
0.002 |
580 |
G |
|
Silk |
0348 |
AAB |
1.825 |
0.003 |
587 |
G H |
|
Red Dacca |
0575 |
AAA |
1.836 |
0.005 |
590 |
H I |
|
Popoulou |
0335 |
AAB |
1.842 |
0.005 |
592 |
H I |
|
Maritú |
0639 |
AAB |
1.847 |
0.005 |
594 |
I |
|
Gros Michel |
1122 |
AAA |
1.881 |
0.001 |
605 |
J |
|
Gran Enano |
1256 |
AAA |
1.905 |
0.005 |
613 |
K |
a Statistical analysis was performed using mean values obtained in individual plants (n = 4).
b ITC Code: code assigned by the INIBAP Transit Centre (Leuven).
c 1 pg DNA = 965 Mbp.
The results of the study showed that flow cytometric analysis was sensitive enough to discriminate between the AA and the BB genotypes of Musa. While the analysis may be used to estimate the genomic constitution in polyploids, the interpretation of results may be compromised by differences between individual A and B genomes, and/or the involvement of other Musa genomes.
2.2. Ploidy estimation using flow cytometry
Following the first report on the estimation of the nuclear DNA content [3], DNA flow cytometry was used to screen ploidy levels of plants regenerated from in vitro culture after treatment with polyploidising agents [5]. The technique was found invaluable to select solid tetraploids and to detect undesirable mixoploids and regenerants with other ploidy levels. The long-term experience with ploidy screening led us to recommend the technique for routine application in Musa breeding and taxonomy [6]. Following the publication of the method, the method has been incorporated into several Musa breeding programs. Two examples of successful applications of the method are given here. The first one involves the analysis of Musa clones whose ploidy level has been questioned [7]. The second one involves ploidy verification of Musa germplasm held at the INIBAP Transit Centre [8].
Figure 2 Cluster analysis of Musa species and clones based on nuclear DNA content. The grouping corresponds fairly well with the widely accepted taxonomic classification of the genus
Figure 3 Results of flow cytometric analysis of the nuclear DNA content in four putative A × B tetraploids. Nuclei were isolated from leaf tissues, stained with the DNA-specific fluorochrome DAPI (4',6-diamidino-2-phenylindole) and their fluorescence analysed by flow cytometry [6]. Nuclei isolated from 'Pisang Mas' (ITC 0653) served as the diploid (2n = 2x = 22) standard. The flow cytometer was adjusted so that the peak representing 'Pisang Mas' nuclei in G1 phase was localised at channel 100 on histograms of relative DNA content. Ploidy levels of other accessions were calculated from their relative G1 peak positions. Peaks representing G1 nuclei of 'Kluai Tiparot' (A), 'Balonkawe' (B) and 'Pisang Jambe' (C) appeared on channel 150 and therefore were triploid. On the other hand, the G1 peak of '(Kluai) Ngoen' (D) appeared on channel 200, indicating that it was tetraploid
2.2.1. Analysis of putative A × B tetraploids
Several Musa clones have traditionally been considered natural acuminata × balbisiana tetraploids. One of them, 'Kluai Tiparot' or 'Tiparot', is considered as the reference for natural tetraploid banana. The accession called 'Balonkawe', recognised as a synonym for Tiparot, was introduced from FHIA to the INIBAP Transit Centre as ITC 0473. Originally, the clone was introduced to Honduras from the Philippines as II-42 by the United Fruit Company in the early 1960s, and was classified as tetraploid. Two other clones traditionally classified as tetraploids include 'Pisang Jambe' and '(Kluai) Ngoen'. They were collected in Indonesia and Thailand, respectively, in 1986, and were passed thence to the INIBAP Transit Centre in 1989.
Flow cytometric analysis showed that three clones, 'Kluai Tiparot' (ITC 0652), 'Balonkawe' (ITC 0473), and 'Pisang Jambe' (ITC 0694) were triploid and not tetraploid. On the other hand, '(Kluai) Ngoen' (ITC 0286) was found to be tetraploid (Figure 3). These unexpected results indicated that natural acuminata × balbisiana tetraploid cultivars were even rarer than generally believed [7]. However, this question will remain open until other accessions of the clones analysed in this study have been evaluated, and until other clones suspected to be tetraploid are measured. Furthermore, these results also showed that one should not rely on the morphology of the plant alone to determine its genomic constitution.
2.2.2. Ploidy verification of Musa germplasm held at the INIBAP Transit Centre
The results obtained from the analysis of putative tetraploids, which questioned ploidy classification based on morphological parameters, led to a decision to verify ploidy levels of all accessions held at the INIBAP Transit Centre (ITC). The Centre plays a crucial role in conservation and distribution of Musa genetic material. However, the utility of this global collection depends, among other things, on reliable information on each individual accession.
A large-scale study was undertaken, using flow cytometry, to evaluate the ploidy levels of most accessions held at the gene bank. Special measures were taken to enable high throughput and reliable analysis. After rooting in vitro, plantlets were sent regularly in batches from the ITC to our laboratory, where they were transferred to soil and maintained in a greenhouse until the analysis. Ploidy of four plants in each accession was determined using flow cytometry as described previously [3, 4, 6]. Flow cytometric ploidy assay involved preparation of suspensions of intact nuclei from small amounts of leaf tissue and the analysis of fluorescence intensity after staining with the DNA-specific fluorochrome DAPI. Chicken red blood cell (CRBC) nuclei were included in every sample as an internal reference standard (Figure 4).
Figure 4 Histograms of relative DNA content, which were obtained during ploidy screening of ITC accessions using flow cytometry. The ploidy of individual plants was estimated based on the ratio of positions of peaks corresponding to G1 nuclei of Musa and CRBC. While the analysis confirmed the ploidy classification for M. acuminata ssp. banksii (ITC 0885), 'Lakatan' (ITC 0573), and TMPx 2637-49 (ITC 1196), the classification was not confirmed for 'Cavendish 901' (ITC 0738), which was found to be hexaploid. Note that CRBC nuclei form doublets, triplets and larger clumps, which results in smaller peaks at higher channel numbers. This feature may be used to check the linearity of a flow cytometer
The results of the analysis are summarised in Table 2. From the 890 accessions analysed so far, 7.6% accessions exhibited a ploidy other than that reported. In 2% of the accessions, plants of various ploidy were detected [8]. An important outcome of the study was a reliable, high throughput system for ploidy screening in Musa. The use of CRBC nuclei as an internal standard made the flow cytometric procedure robust, and prevented errors due to variation in sample preparation and staining and due to random instrument drift. Negligible variation of DNA peak ratios within the genomic groups (coefficient of variation <2%) indicated the suitability of this approach to detect small variations in relative DNA content and/or aneuploidy in Musa. As the materials for analysis were sent by express mail, this work demonstrated that it was possible to perform flow cytometric ploidy analysis in remote laboratories.
Table 2 Summary of the analysis of ploidy levels of Musa accessions held at the INIBAP Transit Centre
|
Number of accessions analysed |
890 |
|
Number of accessions with ploidy other than that previously reported |
68 |
|
Number of accessions with various ploidy levels (ploidy instability) |
18 |
|
Total number of accessions where ploidy level differed from that previously reported |
86 |
3. PHYSICAL ORGANISATION OF MUSA CHROMOSOMES
Methods of molecular cytogenetics permit the localisation of DNA sequences on chromosomes during mitosis, meiosis or interphase. Fluorescence in situ hybridisation (FISH) may be used to study a karyotype in more detail by providing distinct chromosome landmarks, to study gene localisation, to analyse long-range chromosome structure, and to link physical and genetic maps. FISH has the potential to detect structural chromosome changes induced during evolution, breeding and mutagenesis. To overcome the lack of methods for advanced chromosome analysis in Musa, we have developed a method for preparation of metaphase spreads for high-resolution chromosome analysis [9] and a protocol for the localisation of DNA sequences on Musa chromosomes using FISH [10]. The methods were applied to analyse the distribution of various DNA sequences on chromosomes of selected diploid Musa species and clones with the aims of obtaining chromosome-specific landmarks and understanding the long-range organisation of Musa chromosomes [10-12].
3.1. Preparation of metaphase spreads for high-resolution chromosome analysis
Traditionally, chromosome analysis in Musa has been performed on preparations obtained after squashing root tips macerated enzymatically or by treatment with strong acids. However, due to the presence of remnants of cell wall and cytoplasm, the squash technique is not suitable for high-resolution chromosome analysis or for physical mapping of DNA sequences using FISH. The presence of cellular remnants decreases the accessibility of chromosomes to molecular probes and may also cause non-specific binding. To overcome these problems, we have developed a novel procedure for preparation of metaphase spreads in Musa [9]. The method is based on the isolation of protoplasts from fixed root tips and their lysis on a microscope slide.
Under optimal conditions, the method resulted in chromosome spreads whose quality surpassed all currently used protocols for karyological studies in Musa. Chromosomes were not covered by a cell wall; they were well separated and intensely stained. Furthermore, the staining of cytoplasmic remnants underlying the chromosomes was very weak or completely absent (Figure 5). Metaphase chromosomes were small and of similar size (approx. 1.5-3 mm). The positions of centromeres could not be unequivocally identified on all chromosomes within a karyotype. The similarity in chromosome size and inability to determine centromere position meant that it was not possible to identify homologues by a simple Giemsa or fluorescent staining. Nevertheless, secondary constrictions could be clearly identified on the short arms of a pair of chromosomes both in the AA and BB genotypes. The presence of only one pair of chromosomes with a secondary constriction in wild bananas with the AA genome was also reported by Wang et al. [13]. In contrast to our results, these authors observed two pairs of satellited chromosomes in wild BB bananas.
The method was tested on a random selection of genotypes representing M. acuminata, M. balbisiana, and a range of triploid clones. In all cases, chromosome numbers could be unambiguously determined. Chromosome counting in putative A × B tetraploids confirmed the results obtained by flow cytometry (Section 2.2.1.). Furthermore, the high quality of metaphase spreads permitted evaluation of chromosome morphology.
Figure 5 Mitotic metaphase plates of (A) 'Niyarma Yik' (ITC 0269) showing 2n = 2x = 22 chromosomes and (B) 'Ngoen' (ITC 0286) showing 2n = 3x = 33 chromosomes. The spreads were prepared as described by Doleel et al. [9] and stained in 3% Giemsa
Contrary to other reports indicating the occurrence of chromosome number instability in Musa [14, 15], our results obtained on a limited number of plants did not indicate a widespread occurrence of aneuploidy or mixoploidy. We have never observed the occurrence of 'minichromosomes' reported by these authors. Although the new protocol is more laborious than traditionally used procedures, it has important advantages. Pre-treated roots and/or isolated protoplasts can be stored in a freezer and used to prepare fresh slides when needed. From a single isolation procedure, ten to twenty slides may be prepared in a very short time.
3.2. Organisation of chromosome termini
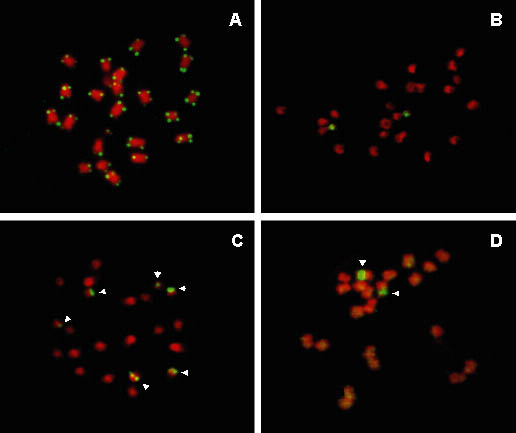
Telomeres are essential for maintenance of chromosome integrity in eukaryotes. They prevent degradation of ends of linear chromosomes, their illegitimate fusion, and shortening of linear DNA molecules due to incomplete replication at the 5'-ends by DNA polymerases. In most plant species analysed so far, telomeres consist of Arabidopsis-type (TTTAGGG)n repeats. To investigate the molecular structure of chromosome ends in Musa, we have used FISH with a synthetic probe for the (TTTAGGG)n repeat. The probe was prepared and labelled with biotin using PCR. Chromosome spreads and FISH were made as described by Doleelová et al. [10]. FISH with the synthetic telomeric probe resulted in clear labelling of all chromosome ends (Figure 6A). No intercalary signals were observed. Based on this observation, it has been concluded that chromosome termini of Musa possess Arabidopsis-like telomeres.
3.3. Genomic distribution of ribosomal DNA sequences
Ribosomal RNA (rRNA) genes occur universally in plants in multiple tandemly repeated units. Usually they are localised at a few discrete chromosomal sites and may be used as chromosomal landmarks for chromosome identification. We have analysed the distribution of rDNA in Musa [10]. A plasmid (VER17) with a 3.7 kb rDNA fragment from Vicia faba containing parts of the 18S, 5.8S and 26S rRNA coding regions and internal transcribed spacers [16] was labelled by random priming. The probe for 5S rDNA was prepared by PCR using a pair of specific primers (RICRGAC1, RICRGAC2), which amplify 303 bp in rice and some other plants [17]. The probes were labelled either with biotin or digoxigenin.
FISH with a probe for 18S-5.8S-26S rDNA revealed two sites of probe hybridisation in all genotypes. In all of them, the hybridisation sites occurred at the distal end of a chromosome short arm and coincided with the nucleolus organiser region (NOR). Interestingly, the intensity of labelling was different for each of the homologues, with one of them showing very intense labelling. This phenomenon was observed consistently in AA and BB genotypes, and indicated a difference in the copy number of 18S-5.8S-26S rRNA genes between homologues (Figure 6B). FISH with a probe for 5S rDNA revealed differences in the number of 5S sites (Figure 6C). In AA genotypes, the number ranged from four (M. acuminata ssp. banksii 'Higa') to six (M. acuminata ssp. siamea). The presence of five chromosomes carrying the 5S sites (Table 3) is very interesting and indicates structural chromosome heterozygosity in some of the AA genotypes. In the BB genotypes, six sites of labelling with the 5S probe were observed. The only exception was M. balbisiana 'Cameroun', in which only four sites were found. In all genotypes, some of the 5S signals were of a low intensity. Nevertheless, they were consistently observed in all metaphase plates.
Table 3 The results of analysis of the distribution of 18S-5.8S-26S rRNA and 5S rRNA genes in selected diploid Musa clones and species
|
Genotype |
Accession name |
ITC Codea |
No. of 18S-26S rDNA sites |
No. of 5S rDNA sites |
|
M. acuminata ssp. banksii |
Higa |
0428 |
2 |
4 |
|
M. acuminata ssp. siamea |
Pa (Rayong) |
0672 |
2 |
6 |
|
AA cultivar |
Pisang Mas |
0653 |
2 |
5 |
|
AA cultivar |
Niyarma Yik |
0269 |
2 |
5 |
|
M. balbisiana |
M. balbisiana |
0094 |
2 |
6 |
|
M. balbisiana |
Cameroun |
0246 |
2 |
4 |
|
M. balbisiana |
Singapuri |
0248 |
2 |
6 |
|
M. balbisiana |
Tani |
1120 |
2 |
6 |
a Code assigned by the INIBAP Transit Centre (Leuven)
With the aim of understanding the distribution of 18S-5.8S-26S and 5S rDNA sequences within Musa karyotypes, we have performed double in situ hybridisation with probes for both sequences. The results confirmed those obtained with single probes. In AA and BB genotypes, the 5S sites are localised on chromosomes that do not carry 18S-5.8S-26S rRNA genes. The results of the analysis of the distribution of 18S-5.8S-26S rRNA and 5S rRNA genes are summarised in Table 3. This study represents the first step in physical mapping of the Musa genome through FISH with rDNA sequences. The results will allow a more detailed analysis of the Musa karyotype and provide the first physical chromosome landmarks.
3.4. Genomic distribution of a mobile genetic element 'monkey'
Transposable elements are known to be an integral part of eukaryotic genomes, often accounting for a substantial fraction of their total DNA content. Although their biological function is not well understood, it is known that they may be activated under stress conditions and cause mutations. Balint-Kurti et al. [18] identified a sequence from M. acuminata that showed a significant homology to LTR (long terminal repeat) retroelements from other species. The element has been named monkey. In this work, we used FISH to analyse the distribution of the retroelement within the Musa genome [11]. Localisation of DNA probes was performed using FISH according to Doleelová et al. [10]. Plasmids containing 1.5 kb, 1.8 kb, and 4.8 kb fragments of monkey, and the plasmid VER17 containing the 18S-5.8S-26S rRNA genes of V. faba were labelled either with biotin or digoxigenin.
Figure 6 Localisation of repetitive DNA sequences on chromosomes of Musa using FISH. The probes were labelled with biotin or digoxigenin and detected by FITC (yellow-green colour); chromosomes were counterstained with DAPI, whose fluorescence is shown in red. (A) Genomic distribution of Arabidopsis-type telomeric repeat (TTTAGGG)n in Musa acuminata 'Borneo' (ITC 0253). (B) Localisation of 18S-5.8S-26S rDNA in M. acuminata ssp. banksii 'Higa' (ITC 0428). The two signals correspond to nucleolus organiser regions (NORs). (C) Genomic distribution of 5S rDNA in M. balbisiana (ITC 0094). Note that in this genotype, six chromosomes (marked by arrowheads) carry the sequence. (D) Localisation of the 4.8 kb clone of retrotransposon monkey in a diploid (2n = 2x = 22) clone 'Niyarma Yik' (ITC 0269, AA). The arrowheads point to NORs carrying 18S-5.8S-26S rRNA genes. Note the preferential localisation of the monkey retroelement to these regions.
The largest clone of monkey (4.8 kb) hybridised strongly to the secondary constriction of a pair of NOR-bearing chromosomes in diploid M. acuminata and M. balbisiana. Localisation to the NOR was confirmed by two-colour FISH when the probes for monkey and for 18S-5.8S-26S rRNA genes localised to the same sites. At high signal amplification, minor sites of monkey were detected on all chromosomes. These sites were dispersed throughout the whole genome and no clear pattern of distribution could be established (Figure 6D). The medium size clone (1.8 kb) showed virtually the same pattern of distribution as the 4.8 kb clone in both Musa species. On the other hand, only weak signals were observed with the smallest (1.5 kb) clone and no labelling was found at NOR loci. This result could be due to the fact that the amount of DNA homologous to the actual monkey retrotransposon in this clone was less than 500 bp, and that this was not enough for reliable localisation. Clear differences in signal intensity after FISH with the probe for rRNA genes were observed between homologous chromosomes. The same differences were observed with the probes for monkey (clones 1.8 kb and 4.8 kb). The localisation of many copies of monkey in NORs, and the correlation between the number of copies of rRNA genes and the number of monkey retroelements, suggest a simultaneous evolution and amplification (e.g. by unequal recombination) of monkey and rDNA genes. These data would indicate that the retroelement entered the Musa genome prior to separation of M. acuminata and M. balbisiana.
The observation of the preferential localisation of the monkey retroelement to the NOR was unexpected, as all retroelements that have been physically mapped in plants so far showed relatively uniform distribution over all chromosomes. However, recently Brandes et al. [19] found clustering of retroelements at the centromeres of Cicer arietinum and Arabidopsis thaliana and speculated that in the case of species with small genomes that contain only a small proportion of repetitive DNA sequences, retrotransposons have a limited number of sites where they may insert without disrupting genes of selective advantage. While centromeric repeats represent genetically silent heterochromatin, NOR contains many copies of rRNA genes. It is thus not clear how the monkey sequences are organised within the rDNA repeats.
3.5. Genomic constitution of Musa hybrids
Genomic in situ hybridisation (GISH) is a modification of FISH where labelled genomic DNA is used as a probe. GISH has been used successfully to analyse the chromosome structure and evolution in several allopolyploid plant species. Based on these results, we have suggested the use of GISH in Musa, where the genome constitution of many clones is uncertain. During this work, a GISH protocol has been optimised for Musa.
Preparation of chromosome spreads and FISH was performed according to Doleelová et al. [10]. Genomic DNA was isolated from young leaf tissues and labelled by nick translation with biotin-16-dUTP. Biotin-labelled probe was detected with streptavidin-FITC. Strong labelling of a complete set of chromosomes was observed when the labelled DNA isolated from 'Niyarma Yik' (ITC 0269, AA) was hybridised to metaphase spreads prepared from root tips of the same clone. On the other hand, very weak labelling was observed on chromosome spreads prepared from M. balbisiana (ITC 0094, BB). Genomic in situ hybridisation to chromosome spreads prepared from root tips of 'Obino l'Ewai' (ITC 0109, AAB) revealed an allotriploid nature of the clone and confirmed the genome composition predicted from plant morphology. Twenty-two chromosomes of the A genome were strongly labelled while eleven chromosomes of the B genome were labelled very weakly. These results indicated that GISH might also be applied successfully to Musa.
3.6. Isolation and characterisation of repetitive DNA sequences
The analysis of the Musa karyotype is complicated by difficulties in identifying individual chromosomes. In addition to rDNA probes, other probes are needed to allow unambiguous identification of all chromosomes. We have therefore initiated a large-scale project to identify and characterise major components of the Musa genome [12]. Partial genomic DNA libraries were constructed for M. acuminata 'Pisang Mas' and M. balbisiana 'Cameroun'. The libraries were screened for repetitive sequences by Southern hybridisation of colony blots with Musa genomic DNA. Colonies giving strong signals were selected as candidates for clones bearing repetitive DNA sequences.
Several clones from the 'Pisang Mas' library showed signals after hybridisation with a probe for V. faba 18S-5.8S-26S rDNA. A clone with the strongest hybridisation signal, named Radka1, was chosen for subsequent analyses. Only one clone was detected in the 'Cameroun' library that gave a positive signal after hybridisation with the probe for rice 5S rDNA. This clone has been named Radka2. Twenty clones named Radka3 to Radka22 were selected from the 'Pisang Mas' library, based on visible signals after hybridisation with labelled genomic DNA. Inserts of all 22 clones were used as probes for Southern hybridisation with digested genomic DNA. Twelve of them showed strong hybridisation signals and were classified as high-copy repetitive sequences. Their insert lengths and GenBank accession numbers are given in Table 4. A ladder-like banding pattern, characteristic of tandemly organised sequences, was observed in six clones (Radka1, 2, 7, 8, 9 and 14). The remaining sequences showed smears with few visible bands. All 12 repetitive sequences were sequenced and compared with accessions in GenBank to estimate homology with known DNA sequences (Table 5).
Table 4 Basic characteristics of the newly isolated repetitive DNA sequences
|
Clone name |
Insert length (bp) |
GC content (%) |
Copy number per unreplicated haploid genome (1C) |
Copy number ratio acuminata/ balbisiana |
GenBank accession number |
|
|
M. acuminataa |
M. balbisianab |
|||||
|
Radka1 |
685 |
51 |
1.6 × 10⁴ |
1.3 × 10⁴ |
1.2 |
AF399949 |
|
Radka2 |
409 |
60.4 |
4.6 × 10³ |
2.7 × 10³ |
1.7 |
AF399942 |
|
Radka3 |
808 |
54.1 |
1.9 × 10³ |
5 × 10² |
3.8 |
AF399943 |
|
Radka4 |
605 |
50.6 |
3.1 × 10³ |
2.3 × 10³ |
1.35 |
AF399944 |
|
Radka5 |
742 |
42.8 |
3.4 × 10³ |
1.2 × 10² |
28.3 |
AF399945 |
|
Radka6 |
193 |
45.3 |
4.1 × 10² |
1.4 × 10² |
2.9 |
AF399946 |
|
Radka7 |
596 |
56.9 |
1.6 × 10⁴ |
1.3 × 10⁴ |
1.2 |
AF399947 |
|
Radka8 |
337 |
46.9 |
3.2 × 10² |
2.4 × 10² |
1.3 |
AF399948 |
|
Radka9 |
334 |
45.2 |
3.2 × 10² |
2.5 × 10² |
1.28 |
AF399938 |
|
Radka10 |
689 |
40.8 |
5.8 × 10² |
3.6 × 10² |
1.6 |
AF399939 |
|
Radka12 |
298 |
41.8 |
6.3 × 10² |
4.1 × 10² |
1.5 |
AF399940 |
|
Radka14 |
411 |
57.4 |
7.3 × 10³ |
3.5 × 10³ |
2 |
AF399941 |
a M. acuminata 'Calcutta 4' (ITC 0249)
b M. balbisiana 'Tani' (ITC 1120)
Table 5 Genomic distribution and results of homology search of newly isolated repetitive DNA sequences
|
DNA clone |
Type of genomic distribution |
Homology to known DNA sequences |
||
|
DNA sequence |
GenBank accession number |
Smallest sum probability |
||
|
Radka2 |
1 |
Hordeum murinum 5S ribosomal RNA gene |
AF096721 |
3 × 10⁻⁷ |
|
Radka1 |
2 |
Rice 26S ribosomal RNA gene |
M11585 |
0.0 |
|
Radka7 |
|
Rice 26S ribosomal RNA gene |
M11585 |
0.0 |
|
Radka14 |
|
- |
- |
- |
|
Radka5 |
3 |
M. acuminata repetitive element |
Y10144 |
6 × 10-16 |
|
Radka8 |
|
M. acuminata retrotransposon monkey |
AF143332 |
3 × 10-21 |
|
Radka9 |
|
M. acuminata retrotransposon monkey |
AF143332 |
3 × 10-21 |
|
Radka3 |
|
- |
- |
- |
|
Radka6 |
|
- |
- |
- |
|
Radka12 |
|
- |
- |
- |
|
Radka10 |
4 |
MUSA1 clone (cacao swollen shoot badnavirus) |
AF106947 |
10-108 |
|
Radka4 |
|
- |
- |
- |
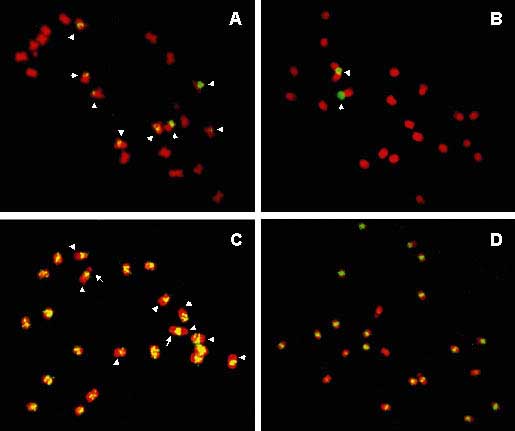
The genomic distribution of repetitive DNA sequences was analysed on metaphase chromosomes of M. acuminata 'Calcutta 4' and M. balbisiana 'Tani', using FISH. Based on the genomic distribution, the sequences could be divided into four types (Table 5). The first type involved the Radka2 sequence, which was localised on eight chromosomes of 'Calcutta 4' and on six chromosomes of 'Tani' with a strong cluster on one pair of chromosomes in both species (Figure 7A). The second group of DNA sequences involved three clones (Radka1, 7, and 14), which localised to the NOR on one pair of chromosomes both in 'Calcutta 4' and 'Tani' (Figure 7B). Two of the clones, Radka1 and Radka7, carry parts of the 26S rRNA gene (Table 5). All probes prepared from clones homologous to rDNA sequences gave stronger signals than FISH with heterologous probes for 18S-5.8S-26S and 5S rDNA.
The third type of genomic distribution was characteristic of six clones (Radka3, 5, 6, 8, 9, and 12), which localised preferentially to centromeric regions of all chromosomes. In addition, they showed a dispersed distribution throughout the genome, with the exception of four pairs of chromosomes where only one arm was labelled. This pattern of distribution was more pronounced for sequences with lower copy numbers (Figure 7C). All sequences localised both to M. acuminata and M. balbisiana, the only difference being weaker signals for the latter species. The largest difference in signal strength was found for Radka5, which gave significantly weaker signals on M. balbisiana chromosomes. Two clones, Radka4 and Radka10, which preferentially localised to pericentromeric regions of all chromosomes, represented the fourth type of genomic distribution. Other parts of chromosomes showed only weak dispersed signals (Figure 7D). FISH signals of Radka4 and Radka10 were comparable in both Musa species; weaker signals for M. balbisiana were the only notable difference.
Figure 7 Localisation of repetitive DNA sequences on metaphase chromosomes of Musa acuminata 'Calcutta 4' by fluorescence in situ hybridisation with biotin-labelled probes detected by FITC (yellow-green colour). Chromosomes were counterstained with DAPI, whose fluorescence is shown in red. (A) Eight loci (marked by arrowheads) were observed for clone Radka2 carrying 5S rDNA. (B) Clone Radka1 (carrying part of 26S rDNA) hybridised to the secondary constriction on one pair of chromosomes (arrowheads). (C) DNA clone Radka3 represents the type 3 genomic distribution, which is characterised by preferential localisation to centromeric regions of all chromosomes, and a dispersed distribution over all chromosome arms with the exception of four pairs of chromosomes where only one arm is labelled (arrowheads). Arrows mark secondary constrictions. (D) DNA clone Radka4 displayed the type 4 genomic distribution by hybridising preferentially to pericentromeric regions of all chromosomes. Other parts of chromosomes showed only weak dispersed signals
The most specific clustering at the centromeric region of all chromosomes was observed for Radka4. This clone, which is not homologous to any known DNA sequence, may represent a specific component of Musa centromeres. Altogether our results indicate the presence of several different types of repetitive DNA sequences in the centromere. However, due to the limit of resolution of conventional FISH, it was not possible to discriminate between centromeric and pericentromeric locations of individual sequences. Weaker and less specific clustering at centromeres of all chromosomes was characteristic of Radka10, which was homologous to the non-coding part of the MUSA1 clone. This clone carries one of the two badnavirus sequences, which have been found integrated into the Musa genome, namely the 'dead' badnavirus sequence closely related to cacao swollen shoot badnavirus [20]. It should be noted that the genomic distribution of Radka10 described in this work may not reflect the distribution of the badnavirus, as its sequence and the flanking sequence Radka10 may not be always present simultaneously.
The study indicated small differences in genomic distribution of repetitive DNA sequences between M. acuminata and M. balbisiana. The only exception was the 5S rDNA, where the two Musa clones under study differed in the number of sites. All repetitive sequences were more abundant in M. acuminata. While for some sequences the differences were relatively small, for others, e.g. Radka5, the difference between species was more than tenfold. As our previous studies [3, 4] showed that the genome of M. acuminata is larger than that of M. balbisiana, the present results indicate that the increase in genome size in M. acuminata was due to multiplication of some repetitive DNA sequences. Although only a limited set of repetitive DNA sequences has been isolated and analysed, the results provide the first insights into the long-range organisation of chromosomes and karyotype evolution in Musa. The use of homologous probes obtained in this study will permit more specific analysis of the genomic distribution of rDNA sequences in Musa. On the whole, the results indicate a similar organisation of chromosomes in M. acuminata and M. balbisiana. However, this type of analysis does not detect small intra- and inter-chromosomal exchanges.
4. PREPARATION OF HIGH MOLECULAR WEIGHT DNA AND CONSTRUCTION OF A GENOMIC BAC LIBRARY
The use of large DNA fragments could be an alternative to the use of tandemly organised repetitive DNA sequences as molecular cytogenetic markers. Such fragments (clones) could be selected from a large-insert DNA library, e.g. a bacterial artificial chromosome (BAC) library. A BAC library providing large-insert clones would allow the localisation of low-copy DNA sequences and markers on Musa chromosomes. Thus FISH with BAC clones has the potential to become an important tool for the development of physical maps in Musa. Unfortunately, only one A-genome BAC library is available in Musa; a BAC library from the B genome has not yet been constructed. The scarcity of BAC libraries in Musa is mainly due to problems with their construction caused by difficulties in isolating sufficient amounts of quality high molecular weight DNA (HMW DNA).
We have therefore initiated experiments directed towards the construction of a B-genome BAC library. As the first step, we have developed a novel method for preparation of HMW DNA from Musa [21]. The protocol involves mechanical homogenisation of formaldehyde-fixed root tips, purification of nuclei on a sucrose gradient, embedding in low-melting-point agarose, and DNA isolation in agarose plugs. Alternatively, nuclei may be purified using flow cytometry. Most of the DNA obtained by the new method is megabase-sized and easily digestible by restriction endonucleases. The method is highly efficient, as microgram amounts of DNA can be obtained from only a few milligrams of plant tissue. Handling very small amounts of plant material reduces the consumption of chemicals. It is expected that preparation of HMW DNA from root-tip nuclei will facilitate long-range mapping and construction of large-insert DNA libraries in Musa. Work is in progress to construct a B-genome BAC library. The library will be used to select BAC clones that contain low amounts of repetitive DNA sequences. Inserts of these clones will then be localised by FISH to obtain chromosome markers. In the second step, clones containing molecular markers and/or genes of interest will be selected and physically mapped. This will lead to integration of genetic and physical maps in Musa, and permit comparative analysis of karyotypes in various Musa species and clones, and analysis of the evolution of cultivated clones. In collaboration with other research groups, the library will be exploited for gene discovery.
5. SUMMARY OF MAIN RESULTS
· A protocol for flow cytometric analysis of nuclear DNA content in Musa has been developed. The method is suitable for analysis of genome size and for rapid ploidy screening and detection of mixoploidy.
· Flow cytometric analysis demonstrated that Musa possesses a small genome (approx. 600 Mbp). This makes it amenable for analysis and mapping at the molecular level.
· DNA flow cytometry demonstrated a significant difference between the size of the A and the B genomes of Musa, the B genome being smaller by 12% on average.
· Flow cytometric analysis was found to be sensitive enough to discriminate between the AA and BB genotypes, and showed the potential to predict genomic constitution in polyploids.
· Flow cytometric analysis of putative A × B tetraploids showed that three of them were triploid. This observation indicated that natural acuminata × balbisiana tetraploid cultivars were rarer than generally believed. The results also showed that ploidy could not be estimated reliably from morphology alone.
· Flow cytometry was used to evaluate the ploidy levels of Musa accessions held at the INIBAP Transit Centre. From the 890 accessions analysed, 7.6% accessions exhibited ploidy other than that reported. In 2% of accessions, plants of various ploidies were detected.
· To cope with the large number of samples, a high throughput system for flow cytometric ploidy screening has been developed. The procedure was found reliable and showed the potential to detect aneuploidy. Furthermore, the study demonstrated the possibility of performing flow cytometric ploidy analysis in remote laboratories.
· A novel procedure has been developed for preparation of metaphase spreads for high-resolution chromosome analysis in Musa.
· A protocol for physical mapping of DNA sequences in Musa using fluorescence in situ hybridisation has been optimised.
· It was demonstrated that chromosome ends of Musa had Arabidopsis-like telomeres.
· The genomic distribution of ribosomal RNA genes in Musa has been determined for the first time. These results provide the first physical chromosome landmarks, and will allow a more detailed analysis of the Musa karyotype, its evolution and changes induced by mutagenesis and during breeding.
· The genomic distribution of the LTR retrotransposon monkey was determined for the first time. The results indicated that the retroelement had entered the Musa genome prior to separation of M. acuminata and M. balbisiana.
· A protocol for genomic in situ hybridisation was optimised and used to verify the genomic constitution in selected polyploids.
· With the aim of characterising major components of the Musa genome, novel repetitive DNA sequences were isolated and characterised with respect to genomic distribution, copy number and homology to known DNA sequences.
· A novel protocol for the preparation of high molecular weight DNA in Musa has been developed. Microgram amounts of DNA can be obtained from only a few milligrams of plant tissue; the majority of DNA is megabase-sized and easily digestible by restriction endonucleases.
· Work is in progress to construct a Musa B-genome BAC library. The library will be used to select BAC clones that will be physically mapped to obtain chromosome-specific cytogenetic markers. This will permit the integration of genetic and physical maps in Musa, and the comparative analysis of karyotypes in various Musa species and clones, and will allow analysis of the evolution of cultivated clones.
6. CONCLUSIONS
Our research resulted in the development of new tools permitting more efficient characterisation and analysis of the Musa genome at the nuclear and chromosomal level. Some of the methods, e.g. flow cytometry, have already been introduced into the existing breeding programmes, and have increased their efficiency. At the same time, the new tools were used to characterise the Musa genome at the chromosomal level. The results obtained represent major steps forward in our quest to understand chromosome structure and evolution in Musa. They provide a sound basis for more targeted application of mutation techniques for the breeding of improved cultivars of bananas and plantains.
ACKNOWLEDGEMENTS
We are grateful to Prof. R. Swennen and Dr. J.-P. Horry for useful suggestions and collaboration. We thank Ir. I. Van den Houwe, curator of the INIBAP Transit Centre, for the supply of plant material. We also thank Prof. S. Tanifuji and Dr. I. Schubert for providing the VER17 plasmid. We thank K. Rychtarová for assistance with flow cytometric analyses. We are indebted to Ms. R. Tušková and Ms. J. Weiserová for excellent technical assistance. This work was undertaken as a part of the Global Programme for Musa Improvement (PROMUSA) and was supported by the Research Contract No. 8145/RB from the International Atomic Energy Agency and by the Research Grant no. A6038204 from the Grant Agency of the Academy of Sciences of the Czech Republic. Ploidy analysis of ITC collection was supported in part by INIBAP (Research Contract No. INIB 98/28).
REFERENCES
[1] CHEESMAN, E.E., Genetical and cytological studies in Musa. I. Certain hybrids of the Gros Michel banana; II. Hybrids of the Mysore banana, J. Genet. 26 (1932) 219-312.
[2] DOLEEL, J., Flow cytometric analysis of nuclear DNA content in higher plants, Phytochem. Anal. 2 (1991) 143-154.
[3] DOLEEL, J., et al., Nuclear DNA amount in diploid bananas (Musa acuminata and M. balbisiana), Biol. Plant. 36 (1994) 351-357.
[4] LYSáK, M.A., et al., Flow cytometric analysis of nuclear DNA content in Musa, Theor. Appl. Genet. 98 (1999) 1344-1350.
[5] VAN DUREN, M., et al., Induction and verification of autotetraploids in diploid banana (Musa acuminata) by in vitro techniques, Euphytica 88 (1996) 25-34.
[6] DOLEEL, J., et al., Use of flow cytometry for rapid ploidy determination in Musa species, InfoMusa 6 (1997) 6-9.
[7] HORRY, J.-P., et al., Do natural A × B tetraploid bananas exist?, InfoMusa 7 (1998) 5-6.
[8] DOLEEL, J., et al., Ploidy verification of Musa germplasm held at the INIBAP transit centre, Abstracts of the 2nd International Symposium on the Molecular and Cellular Biology of Banana, Queensland University of Technology, Brisbane (2000) 28.
[9] DOLEEL, J., et al., A novel method to prepare slides for high resolution chromosome studies in Musa spp., InfoMusa 7 (1998) 3-4.
[10] DOLEELOVá, M., et al., Physical mapping of the 18S-25S and 5S ribosomal RNA genes in diploid bananas, Biol. Plant. 41 (1998) 497-505.
[11] BALINT-KURTI, P.J., et al., Identification and chromosomal localization of the monkey retrotransposon in Musa sp., Mol. Gen. Genet. 263 (2000) 908-915.
[12] VALÁRIK, M., et al., Isolation, characterization and chromosome localization of repetitive DNA sequences in bananas (Musa spp.), Chrom. Res. 10 (2002) 89-100.
[13] WANG, Z., et al., "Cytogenetical studies in Musa (Eumusa)", Current Banana Research and Development in China, South China Agricultural University, Guangzhou (1993) 29-43.
[14] SANDOVAL, J.A., et al., Chromosome number variations in micropropagated true-to-type and off-type banana plants (Musa AAA Grande Nain cv.), In Vitro Cell. Dev. Biol. Plant 32 (1996) 1417.
[15] SHEPHERD, K., DA SILVA, K.M., Mitotic instability in banana varieties. Aberrations in conventional triploid plants, Fruits 51 (1996) 99-103.
[16] YAKURA, K., TANIFUJI, S., Molecular cloning and restriction analysis of EcoRI-fragments of Vicia faba rDNA, Plant Cell Physiol. 24 (1983) 1327-1330.
[17] FUKUI, K., et al., Variability in rDNA loci in genus Oryza detected through fluorescent in situ hybridization, Theor. Appl. Genet. 87 (1994) 893-899.
[18] BALINT-KURTI, P., et al., "Identification of retrotransposon in Musa sp.", Abstracts of the International symposium on the Cellular and Molecular Biology of Banana, Boyce Thompson Institute, Ithaca (1999) 45.
[19] BRANDES, A., et al., Comparative analysis of the chromosomal and genomic organization of Ty1-copia-like retrotransposons in pteridophytes, gymnosperms and angiosperms, Plant Mol. Biol. 33 (1997) 11-21.
[20] NDOWORA, T., et al., Evidence that badnavirus infection in Musa can originate from integrated pararetroviral sequences, Virology 255 (1999) 214-220.
[21] ŠIMKOVá, H., et al., "Preparation of high-molecular-weight DNA from plant nuclei and chromosomes isolated from root tips", Abstracts of the International Conference "Plant and Animal Genome VIII", Sherago International, Inc., San Diego (2000) 79.
![]()
![]()
![]()