![]()
![]()
![]()
* Centro de Investigacion y Estudios Avanzados del I.P.N.
(CINVESTAV) Unidad de Biotecnologia e Ingenieria Genetica de Plantas, Irapuato
Guanajuato, Mexico
Unidad de Biotecnologia
Centro de Investigacion Cientifica
de Yucatan
Calle 43 #130, Col. Churburna de Hidalgo
Merida 97200, Yucatan,
Mexico
Abstract
Both the amplified fragment length polymorphism (AFLP) and the methylation-sensitive amplification polymorphism (MSAP) DNA fingerprinting techniques were used to evaluate the extent of DNA polymorphisms in both conventionally - propagated and micropropagated 'Cavendish' banana plants. Both techniques detected significant levels of DNA polymorphisms in micropropagated banana plants whereas no polymorphisms could be detected in banana plants propagated using the conventional technique of corm division. Using both AFLP and MSAP techniques it was found that the extent of DNA polymorphisms was higher in micropropagated banana plants derived from male floral apical explants than in plants regenerated from vegetative apical explants (suckers). Global differences in methylation patterns were found between micro- and conventionaly-propagated plants. Micropropagated plants were found to be relatively hypermethylated when compared to those propagated by conventional means.
1. INTRODUCTION
For the rapid propagation of disease-free banana and plantain, for the introduction of new cultivars and for the conservation of germplasm, micropropagation is an efficient method [1]. However field evaluation of micropropagated plants has frequently disclosed unacceptably high levels of 'offtypes', termed 'somaclonal variation' by Larkin and Snowcroft [2]. Variations have been observed in plant size, inflorescence morphology and leaf abnormalities. The genetic and / or epigenetic bases of these variations in phenotype are not clear. The type and quantity of somaclonal variation depends on various factors such as genotype, origin of shoots in vitro, number of subcultures, and chimerical nature of the mother explant [3,4,5,6].
In both banana and plantain, the vast majority of 'off types' are deleterious and unwanted by growers. In well managed tissue culture laboratories the percentage of somaclonal variants can be kept to 2 or 3 % which is judged to be acceptable to most growers [7]. For germplasm collections the problem can be more serious because plants may remain in culture for extended periods and go through more numerous subcultures before they are allowed to grow to a sufficient size for detection of phenotype abnormalities.
As both banana and plantain cultivars are largely sterile and vegtatively propagated analysis of somaclonal variants by classical genetic techniques is not usually possible; therefore in order to gain a better understanding of the genetic/epigenetic basis of somaclonal variation in Musa cultivars various molecular techniques have been used. Damasco et al. [8] and Pancholi et al. [9] were able to distinguish normal and dwarf off-type banana plants using the Random Amplified Polymorphism DNA technique (RAPD). However the number of bands produced by RAPDs is insignificant and the pattern and reproducibility of the technique are inadequate. In addition other researchers have not detected differences in RAPDs between widely differing somaclonal variants (Dr. L. Sagi, University of Leuven, Belgium; personal comm. 1997).
The development of the Amplified Fragment Length Polymorphism (AFLP) technique has provided an increased level of precision for assessing genetic variation [10]The AFLP technique combines the restriction site recognition element of RFLP (Random Fragment Length Polymorphism) with the amplification aspects of PCR - based markers (eg. RAPD). It has been recognised as being less labour intensive, has a high multiplex ratio, is highly reproducible and does not depend on availabilty of sequence information[11] AFLP analysis has most recently been used to successfully distinguish between cultivars and known somaclonal variants of Musa[12].
In addition AFLP has been adapted to detect the level of cytosine methylation in the genome and also for the detection of hyper- and hypo-methylation polymorphisms by comparing data from a restriction emzyme combination that is methylation sensitive with a methylation insensitive combination (MSAPs). The MSAP technique utilizes the restriction isoschizomer pair Msp 1 and Hpa 11. whose ability to cleave at the sequence 5'-CCGG-3' is affected by the methylation state of the external or internal cytosine residues. This modified AFLP technique has been demonstrated by Reyna- Lopez et al. [13]; Barrett and Kidwell [14]; and Xiong et al., [15]. Thus this technique should detect changes in DNA methylation which are associated with banana tissue culture and which may be causative in those types of somaclonal variation which have an epigenetic basis. There are various reports of hyper- and hypo-methylation of DNA induced by the tissue culture process [16,17,18,19,20,21]. In addition a mechanism has been proposed by Kaeppler and Phillips [19] whereby base changes due to replacement of cytosines by thymines (possibly due to deamination of 5-methylcytosines) may account for methylation-induced genetic mutations. However there is no direct evidence linking somaclonal variation to hypermethylation.
For commercial micropropagation of banana the vegetative apex of the sword sucker is normally used however in vitro reversion of the male floral apex to a vegetative mode of development is possible [22] and has been recommended as an alternative source of explant for the following reasons:
(1) decontamination is easier as there is no prior contact with soil;
(2) lower incidence of virus infection in regenerants [23];
(3) fidelity and quality of the fruit bunch characteristics can be retained in the case of suspected chimeric clones [24].
2. OBJECTIVES
To analyse and compare DNA polymorphisms in regenerants derived in vitro from suckers and male inflorescences of Musa AAA ' Grand Naine', utilising the AFLP and MSAP molecular marker techniques to determine the influence, if any, of the explant origin on the extent of polymorphisms
3. MATERIALS AND METHODS
3.1. Experimental design
The experimental design is illustrated in Figure 1. Ten healthy mother plants were selected from a commercial plantation of Musa cv. 'Grand Naine' in Teapa, Tabasco state, Mexico. This plantation was derived from plants propagated soley by conventional means. From these plants sword suckers and male inflorescences were taken to CICY, where samples for DNA extraction were taken from sub-apical areas of the male inflorescences and the vegetative meristems of suckers. Shoot cultures were derived from both explant sources through in vitro-induced organogenesis, passed through five sub-cultures in vitro, allowed to root, weaned and transplanted to pots.
AFLP and MSAP polymorphisms were compared between:
(1) both types of explants (only AFLP evaluation)
(2) leaf tissues of regenerantes from both types of explants (AFLP and MSAP evaluation).
(3) leaf tissues of young plants derived by conventional propagation ('bits') from corms of 'Grand Naine' derived from the same plantation and leaf tissues of micropropagated plants (only MSAP evaluation).
Figure 1 Experimental design
3.2. Conventional propagation
Five corms were obtained from 5 different conventionally-propagated mother plants of Musa 'Grand Naine' growing in the plantation. These were cut into pieces so that each piece had a bud. These were then placed in fungicide (Basomil)- treated potting mix (60% local soil 40% peat) in pots. Approximately 3 weeks after planting shoots with leaves had emerged. Samples were collected from the most recently expanded leaves. Samples were taken from two plants per corm and conserved at -80ºCfor DNA extraction.
3.3.Tissue culture
Previous workers have found that there are inherent differences between the two kinds of explant in regard to differences in the quantity of phenolic compounds exuded into the medium (inflorescence explants exude more than sucker explants) during the initial induction phase [22,27]. These compounds subsequently undergo oxidation in the medium and become phytotoxic. Accordingly, although the growth regulator regime remained the same for both explant types, two different induction protocols, previously found to be optimal for both explant types by other workers [25,22,27], were used for this work.
3.3.1. Induction of sucker explants
A protocol was adapted from Sandoval et al. [25]; sword suckers were collected from ten marked mother plants of Musa 'Grand Naine', reduced to 5 cm in length and surface sterilised with 10% commercial chlorine bleach for 20 mins. Explants, which consisted of the meristem and leaf bases, were then moved to a laminar flow hood and reduced further to 2 cm in length. This was followed by further surface sterilisation in 10% 'Cloro' bleach for 10 mins and three washes in sterile distilled water. Explants were reduced further to 1 cm in length and placed in tubes with MS medium [26] augmented with 22.19 mM 6-benzylaminopurine (BAP), 4.92 mM indolebutyric acid (IBA), 3% sucrose and 10 mg/L ascorbic acid. For semi-solid medium 2.5% gelrite was added. After 30 days the explants were cut longtitudinally (to break apical dominance), placed on shoot multiplication medium (MS medium augmented with 10.0 mM BAP and 1 mM indoleacetic acid (IAA) and maintained in total darkness for 10 days at constant 28ºC. Induced shoot cultures were maintained in a photoperiod of 16 h light (35-40 mEm-2 s-1, Osram Daylight fluorescent tubes) and 8 h darkness. Shoots were sub-cultured every 20 days.
3.3.2. Induction of inflorescence explants
A protocol was adapted from the methods of Cronauer & Krikorian [22] and Swamy & Sahijram [27]. Male inflorescences were collected from the ten marked mother plants of Musa ' Grand Naine', the apical meristem was reduced in length to 4 cm and surface sterilised in a laminar flow hood by immersion in 70% alcohol for 5 mins. Explants were further reduced in size under a stereo dissecting microscope so that the apice was between 6 - 8 mm in length with approximately 5 hands of flowers visible below the terminal apex. Explants were maintained in darkness at a constant 28ºC for 30 days in stationary liquid MS medium containing the same growth regulators as used for shoot induction (22.19 mM BAP and 4.92 mM IBA). Explants were subcultured at intervals of 3 to 7 days depending on the degree of phenol oxidation. After 30 days explants were moved to sloped semi-solid shoot induction medium. Shoots induced after 30 days further growth were moved to shoot multiplication medium (see above) and subcultured every 20 days as for sucker-derived shoots.
3.3.3. Weaning of regenerants
Following 5 subcultures shoots were allowed to root on plant growth regulator-free MS medium, weaned in a compost of peat / perlite (50: 50), and moved to the greenhouse.
3.4. DNA extraction
All DNA samples were initially taken from individual plants were not bulked unless required at a later date. For explants, DNA was extracted from the sub-apical tissues of both vegetative and floral meristems. DNA extraction of leaf tissue from micropropagated plants was under taken at 6 weeks post de-flasking. DNA samples were collected from the youngest fully developed leaves of sucker-derived and inflorescence- derived regenerants descended from the same mother plant. Equivalent tissues were taken from conventionally-propagated plants. Difficulties were encountered in extracting DNA of sufficient purity from inflorescence explants, therefore, for reasons of repeatability and harmonisation of methods the Amersham Life Science Nucleon Phytopure Plant DNA Extraction Kit protocol was used for both explant types and leaf tissues of both micropropagated and conventionally-propagated plants. Yields of DNA were estimated by comparison with standards in a 1% agarose gel.
3.5 Amplified Fragment Length Polymorphism (AFLP)
The AFLP protocol followed the procedure described by Zabeau and Vos [28] and Vos et al. [29]. Approximately 200 ng of genomic DNA was digested with Eco R1 (GIBCO BRL) and Mse 1 (GIBCO BRL) and double stranded adaptors ligated to the fragment ends. Only Eco R 1 primers were radioactively labelled using [g32P ] ATP. Ten primer combinations were employed to detect polymorphisms between the different groups of samples. Amplification products were separated on 6% denaturing polyacrylamide gels for 2 h at 60 W, visualised by autoradiography and manually scored for the presence or absence of bands to create a binary matrix. A list of primers and adaptors used for AFLP analysis is given in Table 1.
3.5.1. AFLP Data analysis
AFLP products were scored as present (1) or absent (0) on autoradiographs to create a binary matrix. For field-grown explants the proportion of polymorphic bands (P) was estimated as the ratio of the number of polymorphic bands to the total number of bands.
The standard error of P was estimated according to the following equation:
where n = total number of bands [30]. To obtain the 95% confidence interval the normal approximation of the binomial distribution was used:
where t = normal distribution value, a = probability of type I error.
The analysis of explants and regenerants was carried as follows: diversity values were calculated using the simple matching coefficient [31,32]
Dsm(r,s) = Si çXri - Xsi ç/n
where r and s are two individuals of the population, Xri is the ith band of the r individual, and Xsi is the ith band of the s individual, being i = 1,2,3,....n, where n is the total number of bands.
The samples were divided into groups: I (male inflorescence explants), S (sucker explants), i (15 regenerants from 1 inflorescence) and s (15 regenerants from 1 sucker) in order to calculate dissimilarities (D) within and between groups using the arithmetic average of the dissimilarities. All regenerants analysed were derived from explants originating from the same mother plant. Standard errors and confidence intervals were calculated using the bootstrap procedure [33, 34] and a 95% confidence interval constructed for each dissimilarity based on 2000 bootstrap samples.
Table 1 Sequences of adaptors and primers used for AFLP analysis
|
Eco R1 adaptor |
|
5' - CTCGTAGACTGCGTACC - 3' |
|
Mse 1 adaptor |
|
5' - GACGATGAGTCCTGAG -3' |
|
Eco R 1 + 0 primer |
E0 |
5' - GACTGCGTACCAATTC - 3' |
|
Eco R 1 + 2 primers |
E1 |
E0 + AG |
|
Mse 1 + 0 primer |
M0 |
5' GATGAGTCCTGAGTAA - 3' |
|
Mse 1 + 1 primer |
M1 |
M0 + C |
|
|
M2 |
M0 + CTT |
3.6. Methylation Sensitive Amplified Polymorphism (MSAP)
The MSAP protocol followed the procedure described by Xiong et al. [15] and is fully described by Echeverria et al. [35]. To detect MSAP, two digestion reactions were set up at the same time for each genomic DNA sample:
1) In the first reaction, 200 ng of DNA was digested with 5 U of Eco R1 (GIBCO BRL) plus 5 U of Msp 1 (GIBCO BRL) in a final volume of 50 ml containing 50 mM Tris-HCl (pH 8.0), 10 mM MgCl2 and 50 mM NaCl for 5h at 37 C.
2) The second digestion reaction was carried out as described for the first reaction but Hpa 11 (GIBCO BRL) was used instead of Msp 1.
Adaptors, non-selective primers, selective primers and their sequences are listed in Table 2. Eight primer combinations were used for MSAP analysis.
Methylation events were estimated when bands present from the reaction EcoR1 + Msp 1(M) were absent from the reaction Eco R1 + Hpa 11 (H); which indicated that the internal cytosine was methylated ('5 - CmCGG - 3'). The contrary situation where a band was present in H but absent in M, signified that the external cytosine of one chromatid was methylated. This is regarded as the hemimethylated state [36].
Table 2 Sequences of primers and adaptors used for MSAP analysis
|
Eco R 1 adaptor |
5' - CTCGTAGACTGCGTACC - 3' |
|
Mse 1 adaptor |
5' - GACGATGAGTCCTGAG - 3' |
|
Msp 1 / Hpa 11 adaptor |
5' - CGACTCAGGACTCAT - 3' |
|
Eco R1 + 0 primers |
5' - GACTGCGTACCAATTC - 3' |
|
Eco R1 + 2 primers |
E + AG |
|
Mse 1 + 0 primers |
5' - GATGAGTCCTGAGTAAC - 3' |
|
Mse 1 + 3 primers |
M + CTT |
|
Msp 1 / Hpa 11 + 0 primers |
5' - GATGAGTCCTGAGTCGG - 3' |
|
Msp 1 / Hpa 11 + 2 primers |
MH + GT |
|
Msp 1 / Hpa 11 + 3 primers |
MH + ATG |
3.6.1. Data analysis for MSAP
Bands were considered to be methylation polymorphisms when, for example, a band was present in both M and H in one plant but was only found in M in other plants. Events in which there was an obvious difference in band intensity were also considered as DNA methylation polymorphisms. In some samples no bands were detected in either digestion; these was not considered to be methylation polymorphisms as it was not possible to discount the presence of an AFLP polymorphism. To determine if differences were statistically significant between treatments standard errors of the level of polymorphisms were calculated following the equation of Sokal and Rohlf [30].
4. RESULTS
4.1. AFLP
4.1.1. AFLP analysis of the original explants
Table 3 indicates that, using 10 primer combinations, 622 bands were found in the 10 sucker explants, 2 of which were considered to be polymorphisms (0.32%). In the 10 inflorescence explants 623 bands were found, 3 of which were considered to be polymorphisms (0.48%). Statistical analysis (Table 4) indicated that there were no significant differences between sucker and inflorescence explants in the number of polymorphisms.
4.1.2. AFLP analysis of micropropagated plants
Ten primer combinations were used to analyse 15 regenerants from a sucker explant and 15 regenerants from an inflorescence explant descended from the same mother plant. The results are given in Table 5. A photograph of one of the autoradiographs is given in Figure 2. Samples of the original explants were included in each gel. In all, the 15 sucker-derived regenerants gave 631 bands of which 25 were polymorphic (3.96% polymorphism). In the case of the inflorescence-derived regenerants a total of 644 bands were found of which 41 were polymorphic (6.36% polymorphism).
The statistical analysis to obtain standard errors and confidence intervals is given in Table 6. From the statistical analysis it was concluded that the intra-plant variation is:
(1) less than the disimilitude encountered between the original explants and the micropropagated plants
(2) less than the disimilitude found between regenerants from explants of the two different types
(3) less than the disimilitude found between regenerants from the inflorescence
Although the intra-plant variation is also less than the disimilitude found between regenerants from the sucker, this was not a significant effect in this study.
The disimilitudes within the group 'explant - regenerants' (S & s, S & i, I & s, i & I) was always greater than the disimilitudes found within the group ' regenerants' (s & i, s & s, i & i). From this it is concluded that the variation encountered in the explants is less than that found in the regenerants (both inflorescence- and sucker-derived). In respect to a comparison between regenerants from the two explant sources; the disimilitude within the inflorescence-derived regenerants is greater than that found within the sucker-derived regenerants, and from this it is concluded that micropropagation from the inflorescence generates greater genetic variation.
Figure 2 AFLP profiles using primer combination E4/M7. Lane 1 is the of the sucker explant, lanes 2 - 16 are regenerants from the sucker explants, lane 17 is of the inflorescence explant, lanes 18 -32 are regenerants from the male inflorescence explant. L = 50 bp ladder (GIBCO BRL). Some polymorphisms are indicated by arrows
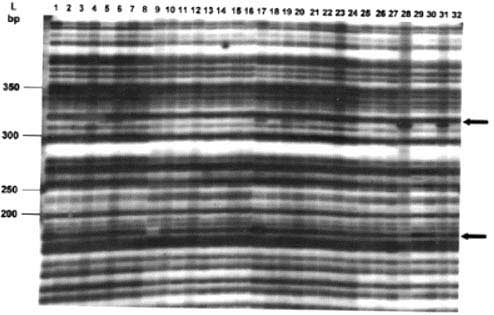
Table 3 AFLP polymorphisms found in the original explants of suckers or young male inflorescences using 10 oligonucleotide combinations
|
Sample origin |
Suckers |
Male inflorescences |
||||
|
Oligonucleotide Combination |
Total bands |
Polym bands |
% Polym. bands |
Total bands |
Polym. bands |
% Polym. bands |
|
E-AG M-CTT |
69 |
1 |
1.44 |
69 |
1 |
1.44 |
|
E-AG M-CTC |
49 |
0 |
0 |
49 |
0 |
0 |
|
E-AC M-CAG |
55 |
0 |
0 |
55 |
0 |
0 |
|
E-AC M-CAT |
83 |
0 |
0 |
83 |
0 |
0 |
|
E-TT M-CAA |
59 |
0 |
0 |
59 |
0 |
0 |
|
E-TT M-CTA |
60 |
1 |
1.66 |
60 |
1 |
1.66 |
|
E-TG M-CTG |
64 |
0 |
0 |
64 |
0 |
0 |
|
E-TG M-CTT |
76 |
0 |
0 |
76 |
0 |
0 |
|
E-TA M-CAG |
46 |
0 |
0 |
46 |
0 |
0 |
|
E-TA M-CTA |
61 |
0 |
0 |
62 |
1 |
1.61 |
|
TOTAL |
622 |
2 |
0.32 |
623 |
3 |
0.48 |
Table 4 Statistical analysis of suckers and male inflorescences from field-grown plants to obtain 95% confidence intervals. TB = total bands, PB = polymorphic bands, P = estimated proportion of polymorphic bands, EE(P) = standard error of P value
|
Samples from field |
TB |
PB |
P (10-3) |
EE(P) (10-3) |
95% Confidence interval |
|
Suckers |
622 |
2 |
3.21 |
2.26 |
0.00124 - 0.00767 |
|
Inflorescences |
623 |
3 |
4.81 |
2.77 |
0.00063 - 0.01026 |
Table 5 AFLP polymorphisms found in leaves of micropropagated plants derived from sucker and male inflorescence explants
|
Sample origin |
Regenerants from suckers |
Regenerants from male inflorescences |
||||
|
Oligonucleotide combination |
Total bands |
Polym. bands |
% Polym. bands |
Total bands |
Polym. bands |
% Polym. Bands |
|
E-AG M-CTT |
61 |
3 |
4.91 |
61 |
4 |
6.55 |
|
E-AC M-CAT |
86 |
3 |
3.48 |
87 |
8 |
9.19 |
|
E-AC M-CAG |
56 |
4 |
7.14 |
63 |
9 |
14.28 |
|
E-TT M-CAA |
60 |
3 |
5.00 |
60 |
3 |
5.00 |
|
E-AG M-CTC |
49 |
5 |
10.20 |
52 |
9 |
17.30 |
|
E-TT M-CTA |
65 |
2 |
3.07 |
65 |
2 |
3.07 |
|
E-TG M-CTG |
64 |
2 |
3.12 |
65 |
2 |
3.12 |
|
E-TG M-CTT |
68 |
1 |
1.47 |
68 |
1 |
1.47 |
|
E-TA M-CAG |
65 |
0 |
0.00 |
67 |
2 |
2.98 |
|
E-TA M-CTA |
57 |
2 |
3.50 |
57 |
1 |
1.75 |
|
TOTAL |
631 |
25 |
3.961 |
644 |
41 |
6.366 |
Table 6 Analysis of genetic disimilitude within and between groups using the simple matching coefficient and bootstrap procedures to estimate 95% confidence intervals
* S = sucker explant, I = male inflorescence explant, s = regenerants from the sucker, i = regenerants from the male inflorescence
|
Group* |
Number of dissimilarity values |
Mean dissimilarity |
Standard error |
Confidence limits |
|
|
Lower 2.5 % |
Upper 97.5 % |
||||
|
(S.I.) |
1 |
0.0062 |
0.003091 |
0.00155 |
0.0124 |
|
(S.s.) |
15 |
0.0210 |
0.004710 |
0.01236 |
0.0307 |
|
(S.i.) |
15 |
0.0228 |
0.004440 |
0.01435 |
0.0315 |
|
(I.s.) |
15 |
0.0249 |
0.005343 |
0.01514 |
0.0358 |
|
(I.i.) |
15 |
0.0236 |
0.004641 |
0.01509 |
0.0332 |
|
(s.i.) |
225 |
0.0172 |
0.003018 |
0.01154 |
0.0232 |
|
(s.s.) |
105 |
0.0137 |
0.002900 |
0.00856 |
0.0198 |
|
(i.i.) |
105 |
0.0189 |
0.003147 |
0.01309 |
0.0254 |
|
(i.i.)-(s.s.) |
- - |
0.0052 |
0.002218 |
0.00082 |
0.0094 |
4.2 MSAP
4.2.1. Total methylation events found in leaves of conventional- and micro-propagated plants
In this analysis 8 primer combinations gave a total of 456 bands for conventionally propagated plants and a total of 465 bands for micropropagated plants. Of these 84 bands from conventionally propagated plants were considered to be methylation events (18.4 %) whilst 107 bands from the micropropagated plants were considered to be methylation events (23%). The full results are shown in Table 7.
Table 7 Number of bands and number of cytosine methylated bands in banana plants micropropagated (MP) and banana plants conventionally propagated (CP)
|
Oligonucleotide Combination |
Number of bands |
Number of methylated bands |
||
|
MP |
CP |
MP |
CP |
|
|
E-AG MH-ATG |
64 |
65 |
19 |
15 |
|
E-AC MH-ATG |
71 |
62 |
20 |
17 |
|
E-AT MH-ATG |
48 |
57 |
6 |
6 |
|
E-AG MH-CTC |
51 |
55 |
8 |
3 |
|
E-AG MH-CAT |
47 |
42 |
16 |
16 |
|
E-AC MH-GT |
76 |
63 |
13 |
8 |
|
E-AG MH-GT |
58 |
60 |
15 |
13 |
|
E-AT MH-CA |
50 |
52 |
10 |
7 |
|
TOTAL |
465 |
456 |
107 (23 %) |
84 (18 %) |
4.2.2. Level of DNA methylation polymorphisms found in conventional- and micro- propagated plants
With 8 primer combinations, no polymorphisms were found in conventionally propagated plants. In the case of micropropagated plants, 14 polymorphic bands were found in inflorescence-derived regenerants and 8 polymorphic bands found in sucker-derived regenerants, in five of the eight primer combinations used. The primer combination giving the highest number of methylation events was MH + ATG / E + AC with 20 and 17 methylation events for the inflorescence and sucker-derived plants respectively. The primer combination giving the highest number of polymorphisms was MH + CTC/ E + AG with 4 and 3 polymorphisms in the inflorescence- and sucker-derived plants respectively. This data is presented in Table 8. There was no significant difference in the number of polymorphisms between the regenerants derived from two kinds of explant (Table 9).
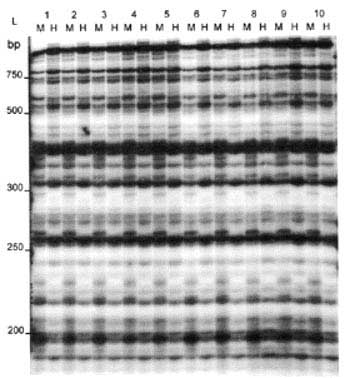
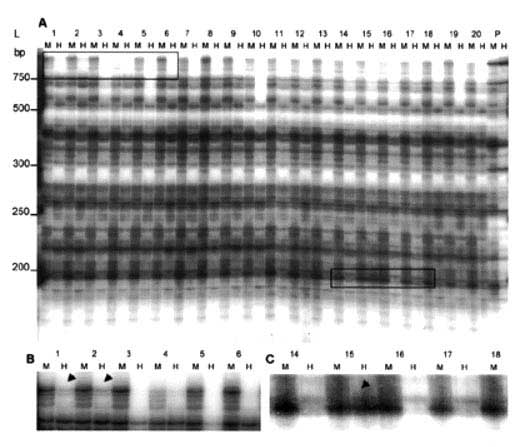
Figures 3 and 4 are examples of autoradiographs of MSAP from leaf tissue of conventionally- and micro-propagated plants. Note that with the same primer combination (MH + ATG/E + AG) there are global differences between conventional (Figure 3) and micropropagated plants (Figure 4) in the methylation status of some equivalent bands.
Table 8 Polymorphisms in cytosine methylation of DNA in micropropagated plants derived in vitro from the male inflorescence (MIP), from micropropagated plants derived from the sucker (MSP) and plants derived from conventional propagation of corm sections (CP)
|
Primer combination |
MIP |
MSP |
CP |
|
E-AG MH ATG |
4 |
1 |
0 |
|
E-AC MH-ATG |
3 |
1 |
0 |
|
E-AT MH-ATG |
0 |
0 |
0 |
|
E-AG MH-CTC |
4 |
3 |
0 |
|
E-AG MH-CAT |
0 |
0 |
0 |
|
E-AC MH-GT |
3 |
2 |
0 |
|
E-AG MH-GT |
0 |
1 |
0 |
|
E-A MH-CA |
0 |
0 |
0 |
|
TOTAL |
14 |
8 |
0 |
Table 9 Statistical analysis of DNA cytosine methylation polymorphisms in plants derived from the inflorescence and the sucker.(following the equation of Sokal and Rohlf 1969 - see materials and methods)
|
Sample source |
Mean level of Polymorphism |
Standard error |
95 % confidence interval |
|
Inflorescence-derived Plants |
0.0301075 |
0.0079183 |
0.0145 - 0.0456 (N.S.) |
|
Sucker-derived plants |
0.0172043 |
0.0060249 |
0.0054 - 0.0290 (N.S.) |
Figure 3 MSAP electrophoresis pattern in conventionally propagated plants using the primer combination MH-ATG/E-AG; M and H refers to digestion with EcoR I + Msp I and EcoR I + Hpa II, respectively. L= 50 bp ladder (Gibco BRL). (Echeverria et al., with permission from Elsevier Science)
5. DISCUSSION
5.1. AFLP
Variation found within the field-grown banana plants was less than 1%, which is expected considering the frequency of natural field variation observed at the phenotype level by Sampson [37] who reported that the natural mutation rate of bananas is ca. two per million plants per generation (ca. 1 mutant in 125 ha / year). This background variation can be taken as a reference to compare the variation observed in the micropropagated plants.
The upper confidence limit for the dissimilarity of the explants is below that of the dissimilarities of the other groups with the exception of regenerants derived from the sucker. In the present work we found that the micropropagation process generated significant variation in regenerants from both the sucker and male inflorescence explants. Dissimilarity within the regenerants from the male inflorescence was found to be greater than that found within regenerants derived from the sucker, suggesting that the male inflorescence generates greater variability. The origin and proliferation of shoots in micropropagated bananas has been found to be a major factor influencing the frequency of somaclonal variation detectable at the level of the phenotype. Shoots derived from longtitudinally fragmented explants (this study) have been found to generate significantly lower levels of somaclonal variation than those derived from shoot clusters which are also associated with the above explants [38]. The question as to which are neo-formed adventitious shoots and which are axillary in origin has not been examined histologically in micropropagated Cavendish bananas although Israeli et al. [38] considered it likely that shoot clusters were adventitious in origin.
Figure 4 MSAP electrophoresis patterns in micropropagated banana plants: (A) MSAP pattern of regenerants from the male inflorescence (1-10) and sucker explants (11-20) of one mother plant using the primer combination MH-ATG/E-AG; M and H refers to digestion with Eco R 1 + Msp 1 and Eco R 1 + Hpa 11, respectively; CP refers to conventionally propagated plants DNA pool. L = 50 bp ladder (Gibco BRL). Enlarged view of the left box area in (A) indicates DNA methylation polymorphisms in regenerants from the male inflorescence (see arrows). (C) Enlarged view of the right boxed area in (A) indicates DNA methylation polymorphisms in regenerants from the sucker (see arrow). (Echeverria et al., with permission from Elsevier Science)
Swamy and Sahijaram [27] found that buds induced in vitro from the male inflorescence explants originated from the male flower groups and that the apical dome per se, does not participate in the redifferentiation process and hence does not contribute to the development of these buds. However there is no histological evidence to support the origin of these buds. According to these authors, shoots buds from the male inflorescence arise from groups of flowers in the meristematic apex and that these are reprogrammed for reversion to the vegetative state. It is therefore likely that these buds arise from different cellular processes in comparison to the buds from the sucker explant and therefore there is a possibility that in this process alterations occur in cellular controls which are not occurring in buds from sucker explants. This may be the explanation for the differences in variability found between regenerants from the different explant types.
During the induction phase different responses were observed between the two types of explant; the male inflorescence explants exhibited a higher level of phenolization and this response could be contributing to the imposed stress. It has been suggested that changes induced during in vitro culture could be the result of a stress response mechnanism [39] which has been shown to activate retrotransposons [40]. In Nicotiana tabacum [41,42,43] and Oryza sativa [44] retrotransposons associated with mutations are activated by in vitro culture. In the present study, it is possible that stress by phenol oxidation and subsequent retrotransposon activation may have contributed to the higher level of polymorphisms observed in plants derived from the male inflorescence.
Genetic variations observed in regenerants do not necessarily correspond to phenotypic variations in the field; however variation at the genetic level increases the possibility of these changes being observable at the level of the phenotype.
In conclusion, this AFLP analysis has shown that micropropagated banana plants show significant genetic variation when compared to both types of explant. The results also clearly suggest that DNA variations are related, at least in part, to the origin of the explant and that regenerants derived from the sucker are more stable than those derived from the male inflorescence.
5.2. MSAP
5.2.1. Global methylation events
The degree of internal cytosine methyaltion at 5'- CCGG sequences detected in leaves of conventionally propagated plants (18.4%) was comparable to that found in rice (16.3%) by Xiong et al. [15]. However, as pointed out by Xiong et al. [15] the MSAPs method can detect only a proportion of the total cytosine methylation in the genome; this is primarily because detection is restricted to the recognition site of the isoschizomers used (5' - CCGG in the present study). The hypermethylation found in micropropagated plants (compare Figures 3 and 4) in comparison to conventionally propagated plants has similarities to the situation found in rice seedling (hypermethyalted) and rice flag leaves as reported by Xiong et al. [15]. It is thus likely that this is a tissue-specific and developmentally-regulated phenomenon. However during conventional propagation of banana this situation probably never occurs since no functional leaves of comparable size to the leaves of 6 week old micropropagated plants are produced. It has been reported that the anatomy of young tissue cultured banana plants is different to field grown plants and hence differences in methylation maybe a reflection of this [45]. Another explanation is that the hypermethylation common to all regenerant leaf tissue is induced by elements of the tissue culture environment per se and is not developmentally - related. For example plant growth regulators, in particular auxins (used in this study) have been shown to induce methylation changes in plant tissue cultures [46,47].
Differences in band intensity were clearly seen at some sites in both conventionally - and micro - propagated plants (Figures 3 and 4A). These intense bands may indicate the presence of repeated elements. Some of these intense bands are found to be demethylated in conventionally - propagated plants but the equivalent bands are methylated in micropropagated plants (for example see intense band above 750 bp in Figs. 3 & 4A). Repeated elements are known to be preferentially methylated in higher plants [48] and have also been found to be subject to tissue-culture induced methylation [20].
5.2.2. DNA methylation polymorphisms
One of the chief objectives of this study was to evaluate the occurrence of DNA methylation changes in micropropagated banana plants. The results suggest that the micropropagation process may be responsible for DNA methylation pattern alterations in plants derived from both explant types since conventionally-propagated plants do not show DNA methylation polymorphisms at least with the eight primer combinations tested. Some polymorphisms such as that found in a sucker-derived regenerant (Fig. 4C) maay6 indicaate that mobile elements such as transposons could be activated by the tissue culture process, as has been reported by Brettell and Lewis [49] who found a correlation between AC element activation and AC element demethylation in regenerants of Zea mays. An alternative explanation is that this kind of polymorphism could be due to the ectopic expression of genes as has been reported in Arabidopsis thalliana plants carrying the methyltransferase METI-antisense transgene and in which there was found to be ectopic expression of floral homeotic genes in leaves.
6. CONCLUSION
From this study it is evident that tissue culture of bananas increases the rate at which genetic change occurs. This may have both positive and negative effects. For example an Israeli company routinely passes elite Musa AAA Grand Naine through tissue culture with the aim of (after rigorous field selection) selection of banana clones with improved agronomic traits (personal communication, 1999; Dr. E.Khayat, Rahan Meristems, Israel). On the other hand, almost all well-characterised banana somaclonal variants have poorer agronomic characteristics than their parent clone and this kind of obvious phenotypic change can be said to be negative. The underlying basis for the accelerated rate of genetic change in tissue-cultured bananas is of both applied and basic interest. Further MSAP studies are required of known somaclonal variants. Bands of interest may be cloned and sequenced and characterised.
In this study we found that there was some correlation between the presence of apparent AFLP polymorphisms and MSAP polymorphisms. An example is regenerant 28i in Figure 2 (AFLP polymorphism); the same plant is represented as number 10i in Figure 4A (MSAP polymorphisms). Thus there may be a link between AFLP and MSAP polymorphisms as has been discussed in literature cited above. An evaluation of the field performance of regenerants is presently underway and regenerants will be monitored by MSAP analysis with the aim of checking the stability of the global methylation changes and the effect, if any, of AFLP and MSAP polymorphisms on the phenotype.
REFERENCES
[1] HWANG S., Chen C., Lin J. and Lin H. 1984. Cultivation of banana using plantlets from meristem culture. HortScience. 19: 231-233
[2] LARKIN S. and Snowcroft W. 1981 Somaclonal variation - a novel source of variability from cell cultures for plant improvement. Theoretrical Applied Genetics 60: 197-214
[3] SMITH M.K. 1988. A review of factors influencing the genetic stability of micropropagated bananas. Fruits, Vol. 43, 4: 219-223
[4] ISRAELI Y. and Reuveni O. 1991. Qualitative aspects of somaclonal variation in banana propagated by in vitro technique. Scientia Horticulturae. 48: 71-88
[5] REUVENI O., Israeli Y. and Golubowicz S. 1993. Factors influencing the occurence of somaclonal variations in micrpropagated bananas. Acta Horticulturae. 336: 357-363
[6] SMITH M. and Hamill S. 1993. Banana tissue culture. Banana Industry Protection Board of Queensland. Australia. Strategic Plan 1994-99 / Annual Report 1993-1994 pp. 27-29
[7] DANIELLS J., Smith M. and Hamill S. 1999. Banana Offtypes. An illustrated guide. Department of Primary Industries. Queensland. Austaralia. Information series Q199019.
[8] DAMASCO O., Graham G., Henry R., Adkins S., Smith M., and Godwin D. 1996. Random amplified polymorphic DNA (RAPD) detection of dwarf off-types in micropropagated Cavendish (Musa spp. AAA) bananas. Plant Cell Reports, 16: 118-123.
[9] PANCHOLI N.C., Wetten A. and Caligari PDS. Detection of levels of somaclonal variation in Musa using molecular markers. In: Meeting on tropical plants. Additional documents. EUCARPIA, Meeting on tropical plants, Montpellier, pp 11-15, 1996
[10] VOS P., Hogers R., Blecker M., Reijans M., Lee TVD., Hornes M., Frijters A., Pot L., Peleman J., Kuiper M and Zabeau M. 1995. AFLP: a new technique for DNA fingerprinting. Nucleic Acids Res. 23: 4407-4414
[11] POWELL W., Morgante M., Andre C., Haneefey M., Vogel MJ., Tingey SV., Rafelski A. 1996. The Comparison of RFLP, RAPD, AFLP and SSR (microsatellite). Markers for germplasm analysis. Mol. Breed. 2: 225-238
[12] ENGELBORGHS I., Swennen R. and Van Campenhout. 1999. The potencial of AFLP to detect genetic differences and somaclonal variants in Musa sp. InfoMusa, Vol. 7, No. 2, pp 2-6.
[13] REYNA-LOPEZ G.E., Simpson J. and Ruiz-Herrera J. 1997. Differences in DNA methylation patterns are detectable during the dimorphic transition of fungi by ampliflication of restriction polymorphisms. Mol. Gen. Genet. 253: 703-710
[14] BARRET B. and Kidwell K. 1998. AFLP - based genetic diversity assessment among wheat cultivars from the Pacific northwest. Crop Science. 38: 1261 - 1271
[15] XIONG L.Z., Xu C.G., Maroof S. and Zhang G. 1999. Patterns of cytosine methylation in an elite rice hybrid and its parental lines, detected by a methylation-sensitive amplification polymorphism technique. Mol. Gen. Genet. 261: 439 - 446
[16] QUEMADA H., Roth E. and Lark K. 1987. Changes in methylation of tissue cultured soybean cells detected by digestion with the restriction enzymes Hpa 11 and Msp 1. Plant Cell Reports. 6: 63-66
[17] BROWN P.T.H. 1989. DNA methylation in plants and its role in tissue culture. Genome 31: 717-729
[18] ANDERSON S., Lewis-Smith A, and Smith S. 1990. Methylation of ribosomal RNA genes in Petunia hybrida plants, callus cultures and regnerated shoots. Plant Cell Reports. 8: 554-557
[19] KAEPPLER S.M. and Phillips RL. 1993. Tissue culture - induced DNA methylation variation in maize. Proc. Natl. Acad. Sci. Vol. 90, pp 8773-8776
[20] SMULDERS M., Rus-Kortekaas W. and Vosman B. 1995. Tissue culture-induced methylation polymorphisms in repetitive DNA of tomato calli and regenerated plants. Theoretrical Applied Genetics 91: 1257-1264
[21] HARDING K. 1994. The methylation status of DNA derived from potato plants recovered from slow growth. Plant Cell, Tissue and Organ Culture. 37: 31-38
[22] CRONAUER S.S. and Krikorian A.D. 1985 Reinitiation of vegetative growth from aseptically cultured terminal floral apex of banana. Amer. J. Bot. 72 (10): 1598-1601.
[23] KRIKORIAN A.D., Irizarry H., Goenaga R., Scott M.E. and Lockhart B.E. 1999. Stability in plant and bunch traits of a 'French-type' dwarf plantain micropropagated from the floral axis tips of a single mother plant: Good news on the tissue culture and bad news on banana streak virus. Scientia Horticulturae 81: 159-177
[24] KRIKORIAN A.D., Irizarry H., Cronauer- Mitra S.S., Rivera E. 1993. Clonal fidelity and variation in plantain (Musa AAB) regenerated from vegetative stem and floral axis tips in vitro. Ann. Bot. 71: 519-535
[25] SANDOVAL J., Brenes G. and Perez-Sanchez L. 1991. Micropropagacion de platano y banano Musa (AAB, AAA) en el CATIE. Costa Rica. Centro Agronomico Tropical de Investigacion y Ensenanz, Catie, Turrialba. pp.2
[26] MURASHIGE T. and Skoog F. 1962. A revised medium for rapid growth and bioassays with tobacco tissue cultures. Physiologia Plantarum. 15: 473-497
[27] SWAMY R.D. and Sahijaram L. Micro propagation of banana from male floral apices cultured in vitro. Sci. Hort. 40: 181-188, 1989.
[28] ZABEAU M. and Vos P. 1993. Selective restriction fragment amplification: a general strategy method for DNA fingerprinting. European Patent Application number: 92402629.7 Publication number 0534858 A1
[29] VOS P., Hogers R., Bleeker M., Reijans M., Van de Lee T., Hornes M., Fijters A., Peleman J., Kulper M. and Zabeau M. 1995. AFLP: a new technique for DNA fingerprinting. Nucleic Acids Res. 23: 4407-4414
[30] SOKAL R. and Rohlf F. 1969. Biometry: the principles and practice of statistics in biological research. Ed. W.H. Freeman and Co. San Francisco.
[31] SNEATH P. and Sokal R. 1973. Numerical taxonomy. W.H. Freeman and Company, San Francisco.
[32] SKROCH P, Tivang J, Nienhuis J (1992) Analysis of genetic relationships using RAPD marker data. In: Joint Plant Breeding Symposia. Crop Science Society of America-American Society for Horticultural Science-American Genetic Asociation. Minneapolis, Mn. pp. 26-30
[33] EFRON B.E and Tibshirani R. 1993. An introduction to the bootstrap. Chapman and Hall. New York, London
[34] DAVISON A. and Hinkley D. 1997. Bootstrap methods and their application. Cambridge Univ. Press, Cambridge.
[35] PERAZA-ECHEVERRIA S., Herrera-Valencia V.A. and James-Kay A. 2001. Detection of DNA methylation changes in micropropagated banana plants using methylation-sensitive amplification polymorphism (MSAP). Plant Science. Vol. 161, No. 2: 359 - 367
[36] McCLELLAND M., Nelson M. and Raschke. 1994. Effect of site-specific modification on restriction endonucleases and DNA mofification methyltransferases. Nucleic Acids Research 22: 3640-3659
[37] SAMPSON J. 1980. Tropical Fruits. U.S.A. Longman Group Limited. pp. 121-123.
[38] ISRAELI Y., Lahav E. and Reuveni O. 1995. In vitro culture of bananas. In: Gowen S. (ed) Bananas and Plantains. Chapman and Hall, London U.K., pp. 147-175
[39] PHILLIPS R, Kaeppler S. and Olhoft P. 1994. Genetic instability of plant tissue cultures: breakdown of normal controls. Proc. Natl. Acad. Sci. 91: 5222-5226
[40] GRANDBASTIEN M., Lucas H., Morel J., Mhiri C., Vernhettes S. and Casacuberta J.1997. The expression of the tabacco Tnt 1 retrotransposon is linked to plant defense responses. Genetica 100: 241-252
[41] HIROCHIKA H. 1993. Activation of tobacco retrotransposons during tissue culture. The EMBO Journal. 6: 2521-2528
[42] TAKEDA S., Sugimoto K., Otsuki H. and Hirochika H. 1999. A 13 bp cis-regulatory element in the TR promoter of the tabacco retrotransposon Tto 1 is involved in responsiveness to tissue culture, wounding, methyl jasmonate and fungal elicitors. The Plant Journal. 18: 383-393
[43] OKAMOTO H. and Hirochika H. 2000. Efficient insertion mutagenesis of Arabidopsis by tissue culture-induced activation of the tabacco retrotransposon Tto 1. The Plant Journal. 23: 291-304
[44] HIROCHIKA H., Sugimoto K., Otsuki Y., Tsugawa H. and Kanda M. 1996. Retro-transposons of rice involved in mutations induced by tissue culture. Proc. Natl. Acad. Sci. 93: 7783-7788
[45] SANDOVAL J.A., Muller L. and Weberling. 1993. Foliar morphology and anatomy of Musa cv. Grande Naine (AAA) plants grown in vitro and during hardening as compared to field-grown plants. Fruits. 49: 37-46
[46] LOSCHIAVO F., Pitto L., Guiliano G., Torti G., Nuti-Ronchi V., Marazziti D., Vergara R., Orselli S. and Terzi M. 1989. DNA methylation of embryogenic carrot cell cultures and its variations as caused by mutation, differentiation, hormones and hypomethylating drugs. Theor. Appl. Genet. 77: 325-331
[47] ARNHOLDT-SCHMITT B.A. 1993. Rapid changes in amplification and methylation pattern of genomic DNA in cultured carrot root explants (Daucus carota L.). Theor Appl Genet 85: 793-800
[48] ARNHOLDT-SCHMITT B.A., Herterich S. and Neuman K. 1995. Physiological aspects of genome variability in tissue culture. 1. Growth phase-dependent differential DNA methylation of the carrot genome (Daucus carota L.) during primary culture. Theor. Appl. Genet. 91: 809-815
[49] BRETTELL R. and Dennis E. 1991. Reactivation of a silent Ac element following tissue culture is associated with heritable alterations in its methylation pattern. Mol. Gen. Genet. 229: 365-372
Acknowledgement. Tables 2, 7, 8, 9 and Figures 3 and 4 are reprinted from Plant Science, Vol. 161, No.2. Peraza-Echeverria P, Hererra-Valencia V. and James- Kay A. Detection of DNA methylation changes in micropropagated bananas plants using methylation-sensitive amplification polymorphism (MSAP). 2001. With permission from Elsevier Science.
![]()
![]()
![]()