


The outlook for the forest sector comprises two main parts. Firstly, there are the projections of future developments that are largely driven by external forces. Secondly, there are elements of the outlook that are based on the choices that are taken by individuals currently working in the sector. This chapter of the report focuses on the first part of the outlook, while the choices for future action are discussed in the next and final chapter of the report.
The chapter is divided into seven main sections. The first three sections present the outlook for industrial forestry. This starts with the outlook for processed products, then the outlook for raw materials (excluding industrial roundwood). The third section presents the outlook for the raw material balance and, derived from this, the outlook for industrial roundwood.
Sections 4.4 and 4.5 present the outlook for woodfuel and non-wood forest products and services. Following this, the outlook for forest products markets under the three alternative scenarios are compared and discussed. Finally, the outlook for forest resources is presented, along with a discussion of the outlook for forest management.
The majority of the projections presented here are based on the work of Kangas and Baudin (2003), who produced projections of production, imports, exports and consumption to the year 2030 for the eight most important processed forest product categories under all three scenarios. For completeness, additional projections were produced for the few products not covered in their analysis and the assumptions used in this process are explained in the text of this and following sections.18
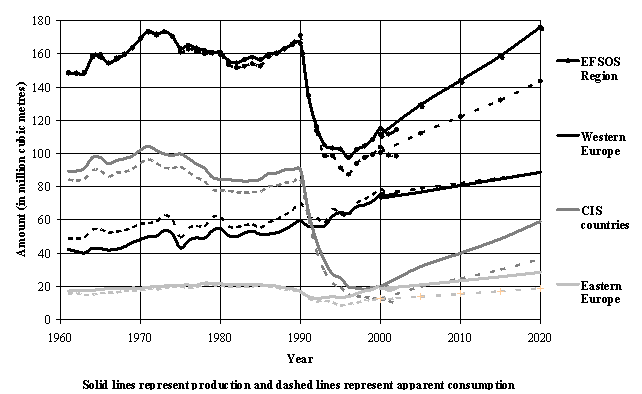
Figure 91 shows the projected production and consumption of coniferous sawnwood to 2020 under the assumptions in the baseline scenario. The most notable feature of this figure is the expected increase in production and consumption to the year 2020, which will continue the trend experienced in the latter half of the 1990s. Overall, production in 2020 will surpass the level reached in 1990, due to continued growth in Western and Eastern Europe and a recovery in production in the CIS sub-region. However, consumption outside Western Europe will continue to fall behind the expansion in production, leading to an increase in net exports from the region as a whole.
For Europe as a whole, production and consumption of coniferous sawnwood are expected to grow at an average annual rate of 2.3 percent and 1.8 percent respectively. Annual production and consumption at the end of the 1990s were around 111 million m3 and 101 million m3 respectively. Production will rise to 176 million m3 in 2020, while consumption is projected to increase to 144 million m3, leading to an increase in net exports from 10 million m3 per year to 32 million m3 per year. It is expected that the bulk of this increase in net exports will be exported to newly industrialising countries in Asia.
In Western Europe, growth in production and consumption is expected to slow slightly compared with the last decade, to resume the rate of growth experienced in earlier decades. In addition, the sector will probably revert back towards processing more roundwood grown in the sub-region (i.e. with relatively less use of imported industrial roundwood) as countries in the East develop their own sawmilling industry.
Figure 91 Trends and projections for the production and consumption of coniferous sawnwood under the baseline scenario
Source: trends derived from FAOSTAT production and trade statistics and projections from Kangas and Baudin (2003).
Production and consumption of coniferous sawnwood are expected to grow at an average annual rate of 1.0 percent and 0.8 percent respectively. At the end of the 1990s, annual production in Western Europe amounted to 73 million m3, while annual consumption amounted to 76 million m3. By 2020, production and consumption are both expected to reach 89 million m3 and Western Europe will no longer be a net importer of coniferous sawnwood.
In Eastern Europe, the outlook for coniferous sawnwood is similar to that expected in the West. Growth will slow down compared to the last decade and resume a trend similar to earlier decades. Although the availability of forest resources is not a variable in these projections, a slightly slower rate of growth would also be consistent with the likely supply of industrial roundwood, as the recent benefit of increased supply from the restitution of forests starts to come to an end.
However, net exports from Eastern Europe are likely to persist and will even increase slightly. In addition, production and consumption will expand twice as fast as in the West, with an average annual growth rate of 2.1 percent. Annual production and consumption of 19 million m3 and 12 million m3 respectively at the end of the 1990s will increase to 28 million m3 and 19 million m3 respectively by 2020, leading to a very small increase in net exports from this sub-region.
The fastest expansion of coniferous sawnwood production and consumption in the future is expected in the CIS sub-region, where average annual growth of 5.6 percent is expected for both production and consumption. This rate of growth is more than twice the rate of growth expected in Eastern Europe or five times higher than the projections for Western Europe and will lead to a three-fold increase in production and consumption by 2020.
This rapid expansion is due to the high rate of economic growth expected in the CIS sub-region over the next two decades. However, the projected increase in production will be feasible, due to the abundance of forest resources in this sub-region. For example, the projected levels of production and consumption in 2020 will still be well below the levels achieved in the past.
Production is expected to increase from 20 million m3 per year to 59 million m3 per year by 2020, while consumption will increase from 12 million m3 per year to 36 million m3 per year. Consequently, net exports will increase from 8 million m3 per year to 23 million m3 per year, accounting for most of the expected increase in net exports from Europe as a whole. Given that the Russian Federation will account for most of this increase, it is expected that much of these exports will be sold in the Asian market rather than the European market.
The very marked differences in expansion of coniferous sawnwood production and consumption across Europe will lead to realignment in terms of the relative importance of the three main sub-regions. Although Eastern Europe and the CIS sub-region are currently starting from relatively low levels of production and consumption, the very high rates of growth expected there will lead to a gradual decline in the dominance of production from Western Europe from around 66 percent of the European total now to only 50 percent of the total in 2020. Given that Europe as a whole is also likely to become an even larger net exporter of coniferous sawnwood (and Western Europe will no longer be a net importer by 2020), it seems likely that the competitiveness (or lack of it) of the European sawmilling sector in international markets will become increasingly important in determining levels of production and consumption.
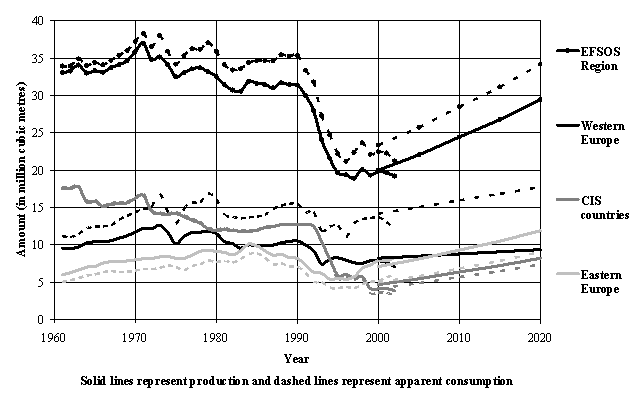
Figure 92 Trends and projections for the production and consumption of non-coniferous sawnwood under the baseline scenario
Source: trends derived from FAOSTAT production and trade statistics and projections from Kangas and Baudin (2003).
Figure 92 shows the projection for the production and consumption of non-coniferous sawnwood to 2020 under the baseline scenario. For the region as a whole, production and consumption in 2020 are expected to return to levels just slightly below those of 1990, with an expected average annual increase in production and consumption of 2.0 percent and 1.9 percent respectively over the next two decades.
These expected increases are in the opposite direction of recent trends in this market, where production and consumption of non-coniferous sawnwood have generally declined in the past. Most of the growth in this market is expected in Eastern Europe and the CIS sub-region. However, consumption in Western Europe is also expected to grow quite strongly over the next two decades, largely due to increased imports from Eastern Europe.
In Western Europe, production of non-coniferous sawnwood is expected to grow only slightly at an average annual rate of 0.7 percent, from 8.2 million m3 in 2000 to 9.4 million m3 in 2020. Consumption will increase at a faster rate of 1.1 percent per year, from 14.2 million m3 in 2000 to 17.8 million m3 in 2020. The level of net imports is likely to expand from 6.0 million m3 per year to 8.4 million m3 per year over the same period. As in the past, imports of tropical sawnwood and non-coniferous sawnwood from North America will account for a large share of these net imports, although the recent increase in imports from Eastern Europe is also expected to continue.
Production and consumption of non-coniferous sawnwood in Eastern Europe are expected to grow significantly in the future, continuing the recovery in this sector that started in the mid-1990s. Production and consumption are expected to grow at an average annual rate of 2.6 percent and 3.0 percent respectively over the period and Eastern Europe will account for the greatest share of European non-coniferous sawnwood production by around 2005.
Eastern Europe is a significant net exporter of non-coniferous sawnwood and this is not expected to change. Production will increase from 7.1 million m3 in 2000 to 11.9 million m3 in 2020, while consumption will increase from 5.0 million m3 per year to 9.1 million m3 per year over the same period. Therefore, the level of net exports will expand slightly from 2.1 million m3 per year to 2.8 million m3 per year.
In contrast to the coniferous sawnwood sector, the CIS sub-region accounts for the smallest share of the European market for non-coniferous sawnwood and the sector is expected to grow only modestly. The sector will expand at about the same rate as in Eastern Europe, with average growth in production and consumption of 2.8 percent per year and 2.9 percent per year respectively. By 2020, production in the CIS sub-region will approach the same level of production projected for Western Europe, but will still be far below the levels reached in earlier decades. Production will increase from 4.7 million m3 in 2000 to 8.2 million m3 in 2020 and consumption will increase from 4.2 million m3 per year to 7.4 million m3 per year, leading to a slight increase in net exports from 0.5 million m3 per year to 0.8 million m3 per year.
As in the coniferous sawnwood sector, the expected changes in the markets for non-coniferous sawnwood will lead to a shift in the balance of production and consumption from west to east over the next 20 years. However, in this case, Eastern Europe will become the dominant producing region, with a 40 percent share of all European production, while the remaining 60 percent of production will be divided almost equally between Western Europe and the CIS sub-region. Western Europe will remain the main consumer of non-coniferous sawnwood and it can be expected that the trade of non-coniferous sawnwood from Eastern Europe to Western Europe will expand.
Strong growth in all parts of the wood based panels sector is expected in the future, reflecting the continued expansion across this sector in Western Europe and the continued recovery of the sector in Eastern Europe and the CIS sub-region.
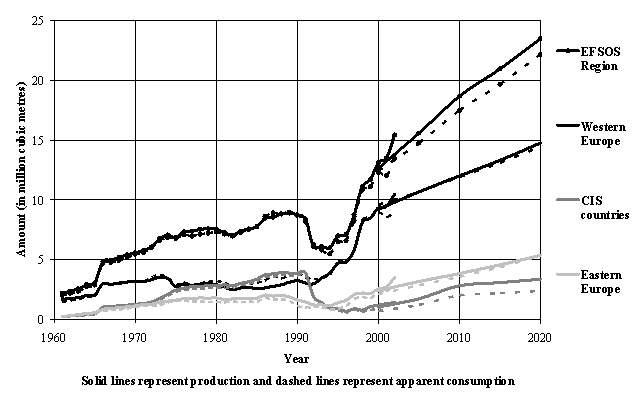
The outlook for fibreboard production and consumption to 2020 is shown in Figure 93. For Europe as a whole, production and consumption are expected to increase at an average annual rate of 3.1 percent and 2.9 percent respectively. This rate of expansion will be somewhat slower than in the last decade, but still well above the long-term trend in this sector. As already noted in Section 2.3.2, it is expected that this increase will be partly driven by expansion of the markets for MDF.
Production and consumption of fibreboard will almost double over the next 20 years, with production increasing from around 12.7 million m3 in 2000 to 23.5 million m3 in 2020 and consumption increasing from 12.4 million m3 per year to 22.2 million m3 per year over the same period. Europe’s position as a net exporter of fibreboard is also expected to increase significantly, from 0.3 million m3 per year to 1.3 million m3 per year, due to an expected increase in net exports from the CIS sub-region.
Western Europe is the largest market for fibreboard in Europe and will continue to dominate this sector. Average annual growth in production and consumption is expected to amount to 2.4 percent and 2.1 percent respectively over the next two decades. This will result in a total increase in the size of the market from around 9 million m3 in 2000 to 15 million m3 in 2020 (or an increase of slightly more than 50 percent). The levels of production and consumption in Western Europe are quite similar, so net trade is insignificant. However, it is expected that Western Europe will change from a small net importer of fibreboard to a small net exporter over the period.
In Eastern Europe, the market for fibreboard is expected to grow rapidly, with an average annual increase in production of 4.1 percent and growth in consumption of 4.7 percent. Production will expand from around 2.4 million m3 in 2000 to 5.4 million m3 in 2020, while consumption will expand from 2.1 million m3 per year to 5.3 million m3 per year over the period. As in Western Europe, production and consumption are roughly in balance, although the small amount of net exports from Eastern Europe is expected to decline by 2020.
The highest growth in the fibreboard sector is expected in the CIS sub-region, where production and consumption are projected to increase by 6.0 percent per year and 6.3 percent per year respectively. Although the sector will not reach the levels of production and consumption of 1990, production and consumption will both increase by more than 200 percent in total. Production will expand from around 1.0 million m3 in 2000 to 3.4 million m3 in 2020 and consumption will expand from 0.7 million m3 per year to 2.4 million m3 per year over the period, leading to a significant increase in net exports amounting to 1.0 million m3 in 2020.
Figure 93 Trends and projections for the production and consumption of fibreboard under the baseline scenario
Source: trends derived from FAOSTAT production and trade statistics and projections from Kangas and Baudin (2003).
The rapid expansion of the fibreboard sector in Eastern Europe and the CIS sub-region will also lead to an increase in the importance of these two sub-regions in total European production and consumption. However, Western Europe will remain the main market for this product, accounting for around 65 percent of European production and consumption in 2020. It is also notable that all three sub-regions will become net exporters of this product by 2020, suggesting that producers will have to continue to look for markets outside Europe to sell this product.
The outlook for the particleboard sector is very similar to the outlook described above for fibreboard. In general, the markets for this product will expand rapidly (compared with the markets for sawnwood) and the highest rates of growth are expected in the east. However, Western Europe will remain the major market for this product in Europe.
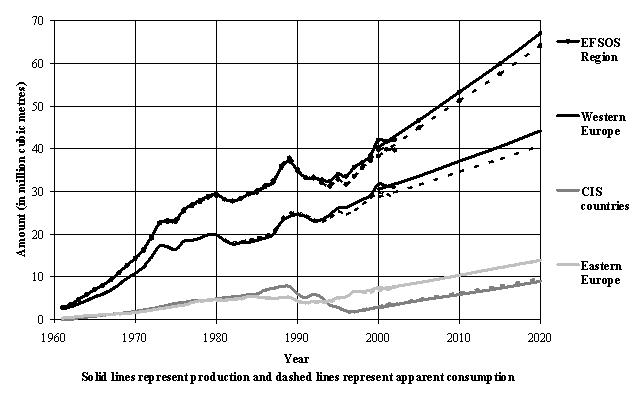
Figure 94 shows the outlook for particleboard production and consumption in Europe to 2020 under the baseline scenario. The projections of production and consumption follow the long-term trend in Western Europe and the more recent trends of recovery in the sector in the other two sub-regions. Overall, production and consumption are both expected to increase at an average annual rate of 2.6 percent, with an increase in production from 40 million m3 in 2000 to 67 million m3 in 2020 and a corresponding increase in consumption from 38 million m3 to 64 million m3.
Production and consumption in Western Europe are projected to increase by 1.9 percent and 1.8 percent respectively each year, leading to an increase in net exports. Production will expand from around 30.5 million m3 in 2000 to 44.2 million m3 in 2020 and consumption will expand from 28.7 million m3 per year to 40.7 million m3 per year over the period. Consequently, net exports will increase from 1.8 million m3 per year to 3.5 million m3 per year by 2020.
Figure 94 Trends and projections for the production and consumption of particleboard under the baseline scenario
Source: trends derived from FAOSTAT production and trade statistics and projections from Kangas and Baudin (2003).
In Eastern Europe, production and consumption of particleboard are expected to grow at an average annual rate of 3.4 percent and 3.7 percent respectively (or double over the next 20 years). Production will increase from 7.1 million m3 per year to 13.9 million m3 per year and consumption will increase from 6.7 million m3 per year to 13.8 million m3 per year over the period. Eastern Europe is a very small net exporter of particleboard and net exports are expected to decline to almost zero by 2020.
As in other sectors, the highest rate of growth in the future is expected in the CIS sub-region, although this will start from a very low level in 2000. Production will more than treble, from 2.7 million m3 in 2000 to 9.0 million m3 in 2020 (an average increase of 6.2 percent per year). Consumption will increase slightly faster than this, from 2.9 million m3 in 2000 to 9.7 million m3 in 2020 (an average increase of 6.3 percent per year). Thus, net imports into the CIS sub-region will increase, but remain quite insignificant.
As in the fibreboard sector, the importance of the different sub-regions will change slightly as production and consumption expands more rapidly in the east. However, Western Europe will remain the major market for this product, with only a modest fall in the share of total European production and consumption from around 75 percent in 2000 to 65 percent in 2020.
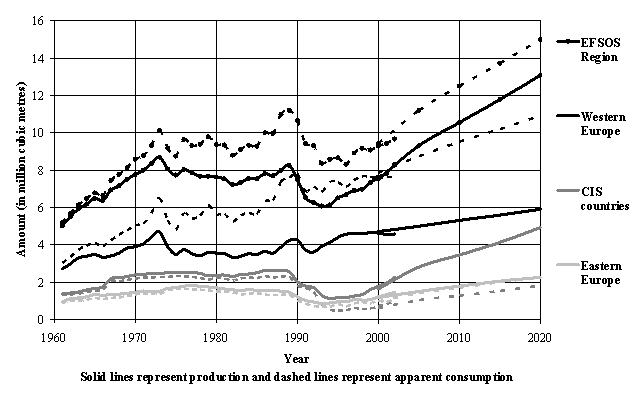
Figure 95 Trends and projections for the production and consumption of plywood and veneer sheets under the baseline scenario
Source: trends derived from FAOSTAT production and trade statistics and projections from Kangas and Baudin (2003).
The analysis by Kangas and Baudin (2003) only examined the markets for plywood in Europe and did not cover veneer sheets. As noted in Section 2.3.2, the share of veneer sheet production and consumption in total production and consumption of veneer sheets and plywood has remained roughly constant in the past. Therefore, it has been assumed here that the markets for veneer sheets will follow the same pattern as the projections for plywood.
The outlook for the production and consumption of plywood and veneer sheets under the baseline scenario is shown in Figure 95. For Europe as a whole, a relatively high rate of growth in production and consumption is projected, with average annual increases of 2.8 percent and 2.3 percent respectively. Production will increase from 7.5 million m3 per year to 13.1 million m3 per year, while consumption will increase from 9.4 million m3 per year to 15.0 million m3 per year. To a large extent, this growth in Europe as a whole will be driven by expected increases in production in the CIS sub-region.
Western Europe is currently the largest producer and consumer of plywood and veneer sheets in Europe and this is expected to continue, although Western Europe’s dominance of production is expected to decline. Average annual growth in production and consumption is expected to amount to 2.4 percent and 2.1 percent respectively over the next two decades. Production will increase from 4.7 million m3 per year to 5.9 million m3 per year and consumption will increase from 7.9 million m3 per year to 10.9 million m3 per year, leading to an increase in net imports into Western Europe from 3.2 million m3 per year to 5.0 million m3 per year. Tropical plywood accounts for a significant proportion of plywood and veneer sheet imports into Western Europe, but it is expected that imports from the CIS sub-region will increase in importance in the future.
Eastern Europe is the least important of the three European sub-regions in terms of the production of plywood and veneer sheets, although consumption there is higher than in the CIS sub-region. Production and consumption in Eastern Europe will grow quite rapidly, at an average annual rate of 3.3 percent and 4.4 percent respectively, but the amount of production will remain far behind the other two sub-regions. Production is expected to increase from 1.2 million m3 in 2000 to 2.3 million m3 in 2020 and consumption will increase from 1.0 million m3 per year to 2.3 million m3 per year over the same period. Net exports of plywood and veneer sheets from Eastern Europe are insignificant and are expected to decline to zero by 2020.
The most interesting feature of the outlook for the plywood and veneer sheets sector is the rapid expansion of production and consumption expected in the CIS sub-region over the next 20 years, where both production and consumption are expected to increase by about 5.7 percent per year on average. Production will increase from 1.6 million m3 in 2000 to 4.9 million m3 in 2020, while consumption will increase from 0.6 million m3 per year to 1.8 million m3 per year over the same period. This will lead to a dramatic increase in net exports from 1.0 million m3 in 2000 to 3.1 million m3 in 2020. Much of this increase in exports will probably be sold to Western Europe.
Broadly speaking, the outlook for the paper and paperboard sector in Europe will follow the historical trends in this sector. However, at the sub-regional level there will be some interesting developments with respect to changes in the shares of production and consumption of the different paper and paperboard products among the three European sub-regions.
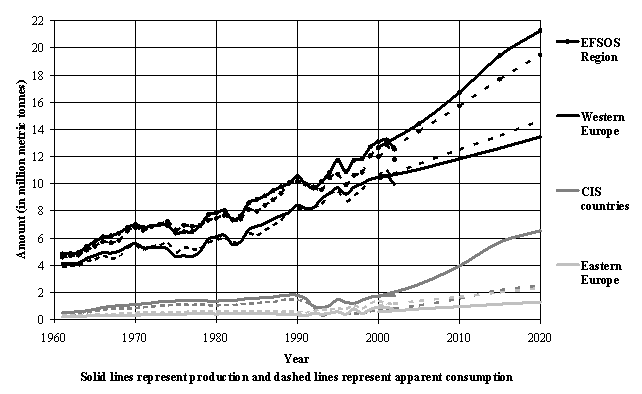
Figure 96 shows the outlook for the production and consumption of newsprint in Europe to 2020 under the baseline scenario. For Europe as a whole, production and consumption are expected to expand at roughly the same rate as in the past (or maybe slightly higher), with expected annual growth rates of 2.6 percent and 2.4 percent respectively. Production will increase from 12.7 million MT in 2000 to 21.3 million MT in 2020, while consumption will increase from 12.0 million MT per year to 19.5 million MT per year over the same period. Consequently, the level of net exports will expand slightly from 0.7 million MT per year to 1.8 million MT per year.
Western Europe is currently the largest producer and consumer of newsprint in Europe and this is expected to continue, although Western Europe’s dominance of production is expected to decline. Average annual growth in production and consumption is expected to amount to 1.3 percent and 1.8 percent respectively over the next two decades. Production will increase from 10.4 million MT per year to 13.5 million MT per year and consumption will increase from 10.3 million MT per year to 14.7 million MT per year. This will lead to net imports of 1.2 million MT per year by 2020, compared with the current situation of approximately equal production and consumption of newsprint in Western Europe.
In Eastern Europe, production and consumption of newsprint will grow quite rapidly, at an average annual rate of 4.3 percent and 4.1 percent respectively, but this sub-region will remain relatively insignificant compared with the other two sub-regions. Production will increase from 0.6 million MT per year to 1.3 million MT per year and consumption will increase from 1.0 million MT per year to 2.3 million MT per year, leading to an increase in net imports from 0.4 million MT per year to 1.0 million MT per year over the next two decades.
Again, the most significant change in the future is expected in the CIS sub-region, where both production and consumption of newsprint are expected to increase at about 7 percent per year. Production will increase from 1.7 million MT per year to 6.5 million MT per year, while consumption is expected to increase from 0.7 million MT per year to 2.5 million MT per year.
The CIS sub-region is already a net exporter of newsprint of about 0.7 million MT per year, but this is expected to increase significantly to 4.0 million MT per year. This increase in net exports is expected to flow to the rest of Europe and Asia.
Figure 96 Trends and projections for the production and consumption of newsprint under the baseline scenario
Source: trends derived from FAOSTAT production and trade statistics and projections from Kangas and Baudin (2003).
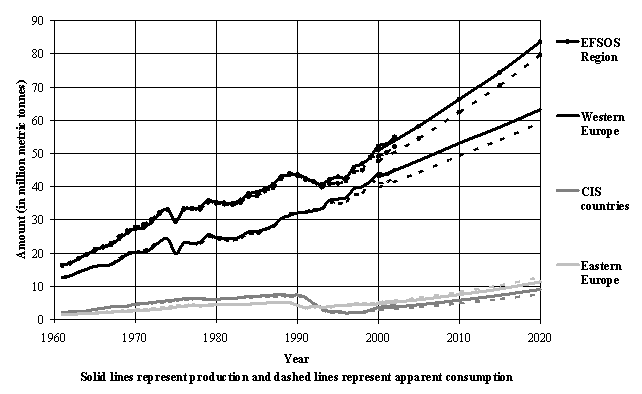
The outlook for the production and consumption of other paper and paperboard in Europe is shown in Figure 97. Similar to the outlook for newsprint, production and consumption are expected to expand at roughly the same rate as in the last decade, with an average annual growth rate of 2.5 percent and 2.6 percent respectively. In this sector, Western Europe is by far the largest market and the relative importance of Western Europe will not decline by very much.
Production of other paper and paperboard in Europe as a whole will increase from 51.0 million MT in 2000 to 83.7 million MT in 2020 and consumption will increase from 47.7 million MT per year to 79.8 million MT per year. This will lead to a very small increase in the level of net exports from 3.3 million MT in 2000 to 3.9 million MT in 2020.
In Western Europe, production and consumption will both increase at about 2.0 percent per year on average. Production amounted to about 42.9 million MT in 2000 and is expected to increase to 63.3 million MT in 2020. Consumption will increase from 39.8 million MT per year to 59.3 million MT per year over the same period. Net exports of around 3 million MT per year will remain unchanged.
The market for other paper and paperboard in Eastern Europe is expected to increase by about 150 percent over the next two decades and this sub-region is expected to remain in second place after Western Europe (but still a long way behind). Production is projected to increase at 4.5 percent per year on average, from 4.7 million MT in 2000 to 11.3 million MT in 2020. Consumption is projected to increase at 4.7 percent per year on average, from 5.2 million MT in 2000 to 12.8 million MT in 2020. Net imports to Eastern Europe are relatively small, but are expected to increase slightly.
Figure 97 Trends and projections for the production and consumption of other paper and paperboard under the baseline scenario
Source: trends derived from FAOSTAT production and trade statistics and projections from Kangas and Baudin (2003).
In the CIS sub-region, average annual growth in production will be slightly higher than in Eastern Europe, at 5.1 percent and 5.2 percent respectively, but the size of the market in this sub-region will remain relatively small. Production will increase from 3.4 million MT in 2000 to 9.2 million MT in 2020 and consumption will increase from 2.8 million MT per year to 7.7 million MT per year. Net exports will increase slightly, from 0.6 million MT in 2000 to 1.4 million MT in 2020.
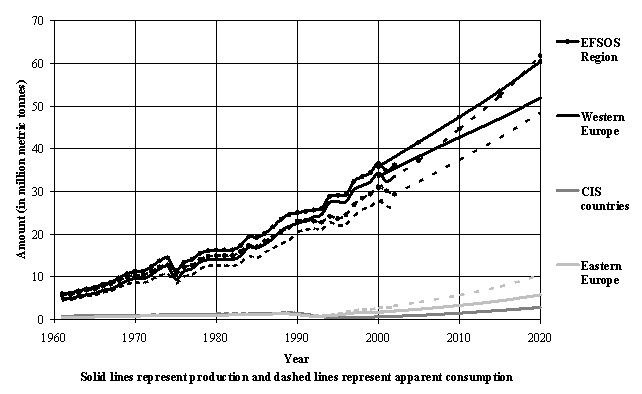
The outlook for the production and consumption of printing and writing paper in Europe is shown in Figure 98. The interesting feature of these projections is the expected reversal of Europe’s position as a net exporter of printing and writing paper (5.0 million MT in 2000) to a net importer of 1.4 million MT in 2020. This is largely due to the high growth in consumption expected in Eastern Europe and a reduction of growth in production expected in Western Europe. For Europe as a whole, production is expected to increase from 35.8 million MT in 2000 to 60.4 million MT in 2020, while consumption will double from 30.8 million MT per year to 61.8 million MT per year over the same period.
Figure 98 Trends and projections for the production and consumption of printing and writing paper under the baseline scenario
Source: trends derived from FAOSTAT production and trade statistics and projections from Kangas and Baudin (2003).
In Western Europe, growth in production is expected to slow slightly compared with the past, to an average annual rate of 2.2 percent. Production of around 33.5 million MT in 2000 will increase to 51.9 million MT in 2020. Consumption will continue to grow strongly, at an average annual rate of 2.9 percent, increasing from 27.5 million MT in 2000 to 48.5 million MT in 2020. Consequently, the level of net exports from Western Europe will decline from 6.0 million MT per year to 3.4 million MT per year over the period.
The greatest change in the printing and writing paper sector is expected in Eastern Europe, where consumption is expected to rise rapidly due to economic development in the sub-region. Production and consumption will increase at an average annual growth rate of 6.4 percent and 6.9 percent respectively, leading to an increased level of net imports into the sub-region. Production will increase from around 1.7 million MT in 2000 to 5.8 million MT in 2020, while consumption will increase from 2.7 million MT per year to 10.4 million MT per year over the same period. Net imports will expand from 1.0 million MT per year to 4.6 million MT.
In the CIS sub-region, growth in the market for printing and writing paper will be higher than in the other two sub-regions, but starting from a very low level. Production will increase by 7.9 per year on average, from 0.6 million MT in 2000 to 2.8 million MT in 2020. Consumption will increase by 8.2 per year on average, from 0.6 million MT in 2000 to 2.9 million MT in 2020. The level of net trade with the CIS sub-region will remain insignificant.
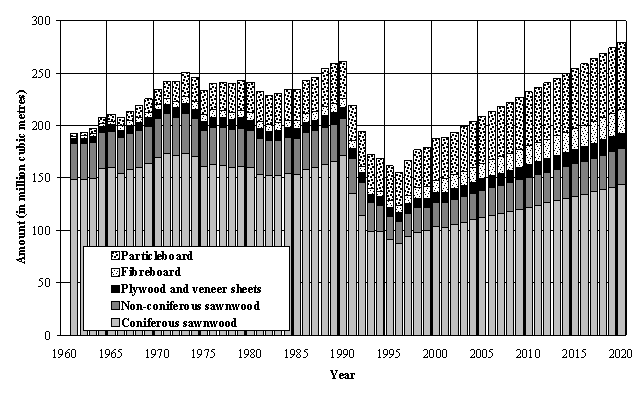
Overall, the structural changes in markets described in Section 2.3.4 are expected to continue in the future, but at different rates in each of the three European sub-regions. For example, for Europe as a whole, consumption of reconstituted panels is expected to continue to account for a greater share of consumption of solid wood products in the future, due to higher growth in fibreboard and particleboard consumption compared to the expected growth in sawnwood consumption.
Figure 99 Trends and projections for the consumption of sawnwood and wood based panels in Europe under the baseline scenario
Source: trends (to 2000) derived from FAOSTAT production and trade statistics and projections (2001- 2020) from Kangas and Baudin (2003).
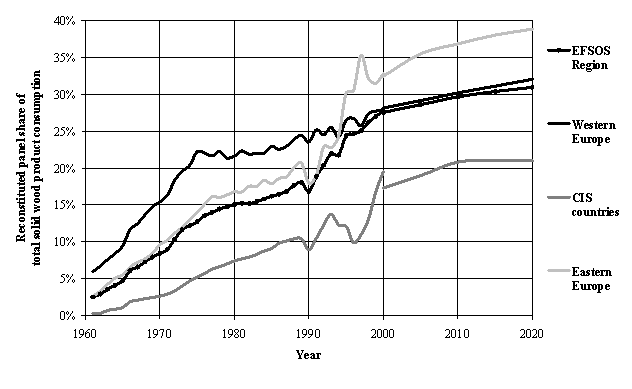
Figure 99 shows the outlook for the consumption of solid wood products in Europe under the baseline scenario. Overall, the share of reconstituted panels in total solid wood product consumption is likely to continue to increase slightly from 28 percent in 2000 to 31 percent in 2020. However, this shift towards reconstituted panels will be much stronger in Western and Eastern Europe than in the CIS sub-region (see Figure 100).
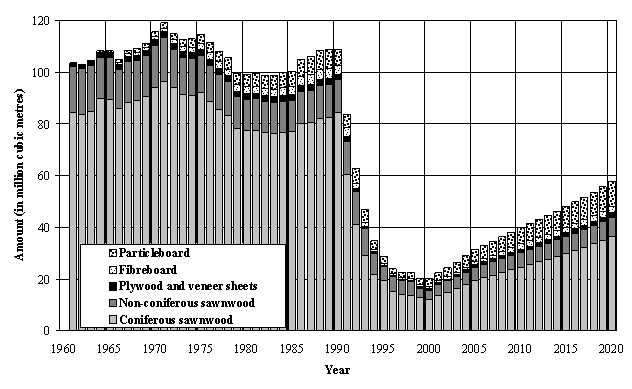
In the CIS sub-region, consumption of sawnwood will continue to dominate the domestic market (see
Figure 101). Furthermore, given the huge increase in net exports of coniferous sawnwood expected in the CIS sub-region, the share of sawnwood in total production of solid wood products will be much larger and will increase in the future. Thus, the demand for sawlogs and veneer logs in this sub-region will remain high and increase significantly in the future.
Figure 100 Trends and projections for the importance of reconstituted panels under the baseline scenario
Source: trends derived from FAOSTAT production and trade statistics and projections from Kangas and Baudin (2003).
Figure 101 Trends and projections for the consumption of sawnwood and wood based panels in the CIS sub-region under the baseline scenario
Source: trends (to 2000) derived from FAOSTAT production and trade statistics and projections (2001- 2020) from Kangas and Baudin (2003).
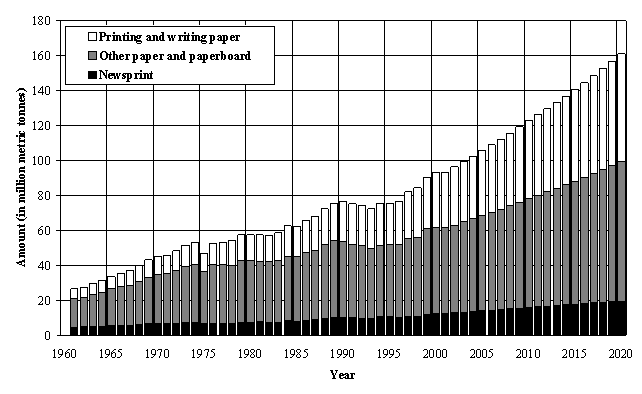
In the markets for paper and paperboard, the shift towards relatively more consumption of printing and writing paper is also expected to continue in the future, with the total market share of this product category increasing from 35 percent in 2000 to 40 percent in 2020 (see Figure 102). Conversely, the shares of newsprint and other paper and paperboard in total paper and paperboard consumption will both decline by a small amount.
Figure 102 Trends and projections for the consumption of paper and paperboard in Europe under the baseline scenario
Source: trends (to 2000) derived from FAOSTAT production and trade statistics and projections (2001- 2020) from Kangas and Baudin (2003).
Again, this shift will be largely driven by the outlook for Western Europe, although printing and writing paper consumption is expected to increase more rapidly than other types of paper and paperboard in both of the other two sub-regions. In addition, a significant increase in the production of newsprint is expected to occur in the CIS sub-region, leading to a major shift there towards the production of this product.
From a broad perspective, the expected changes in forest products markets in each of the three European sub-regions reflect the different patterns of consumer demand and competitiveness in the different sub-regions. Thus, for example, consumption will grow most rapidly in the east, where economies are expected to grow faster than in the west. However, the pattern of consumption between the different sub-regions will be subtly different, with the west focusing on products that meet the demands of a richer society (e.g. printing and writing paper), while the east will focus more on products that meet the more basic needs of housing and industrial development (e.g. sawnwood).
An even clearer distinction between the three sub-regions exists in the projections of production. The CIS sub-region will increase in importance for the production of products such as coniferous sawnwood, plywood, fibreboard and newsprint, where the abundance of forest resources will offer this region a distinct advantage and the availability of skills, capital and technology is suited to these types of forest product.
In contrast, Western Europe will focus more on the production of products that are less demanding on the raw material supply and require a higher level of development in production and marketing skills and technology (e.g. particleboard and printing and writing paper). In general, Eastern Europe will be in a curious position, somewhere between these two extremes. Consumer markets there will probably develop along similar lines to Western Europe, while the production of forest products will probably develop in a way that is more similar to the CIS sub-region. Thus, these changes in emphasis in the future in all three sub-regions will continue to influence the trade flows of forest products between the three sub-regions and between Europe and the rest of the World.
In order to produce projections for the wood raw material balance in the future, it is necessary to make projections about the production and consumption of raw materials and intermediate products. The analysis by Kangas and Baudin (2003) did not examine these products, so a variety of techniques were used to complete the analysis. The methodologies and assumptions used are presented here along with the main results of this part of the analysis.
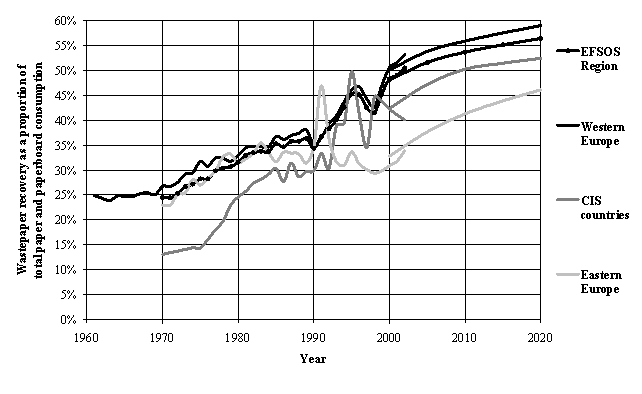
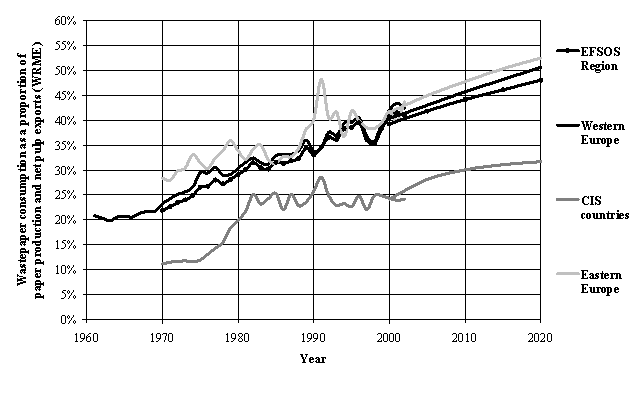
Projections for the production and consumption of recovered paper were based on an analysis of the historical trends in wastepaper recovery and the utilisation of recovered paper in paper and paperboard production. The policy analysis showed that both of these variables are expected to continue to follow past trends and increase in the future. However, there are technical limits to both of these variables; for example, some types of paper are very difficult to recover (e.g. household and tissue paper) and, as already noted, some types of paper are difficult to manufacture from recycled paper.
The projections for both of these variables were based on a simple extrapolation of past trends, subject to the limitations described above. For countries where these figures were already high, it was assumed that they would not increase. For countries that have experienced some growth in the past, the trends in wastepaper recovery were continued up to a limit of 50 - 60 percent, depending on the level of urbanisation in the country (recovery rates are generally higher in more urbanised countries). Trends in the use of recovered paper were also extrapolated (up to a limit of 70 percent in the few countries with high historical rates of recovered paper utilisation). For countries where the historical trends showed low rates of wastepaper recovery and utilisation, it was assumed that both variables would grow modestly by about 10 - 15 percentage points in total over the next two decades.
The results of this analysis are shown in Figure 103 and
Figure 104 and, based on this, the projections for recovered paper production and consumption are shown in Figure 105.
Figure 103 Trends and projections for wastepaper recovery
Source: trends derived from FAOSTAT production and trade statistics; for projections - see Section 4.2.1.
Figure 104 Trends and projections for the importance of recovered paper as a source of raw material supply for the pulp and paper industry
Source: trends derived from FAOSTAT production and trade statistics; for projections - see Section 4.2.1.
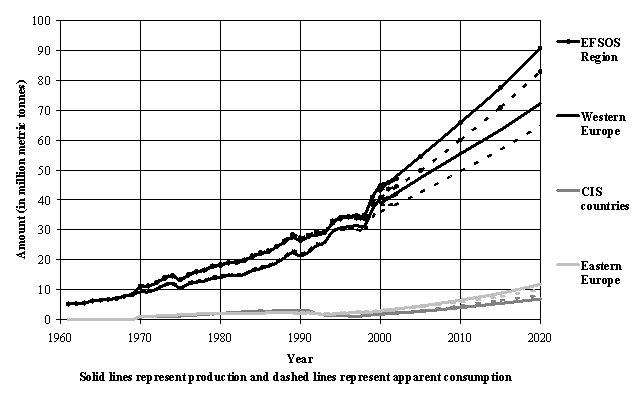
Figure 105 Trends and projections for the production and consumption of recovered paper under the baseline scenario
Source: trends derived from FAOSTAT production and trade statistics; for projections - see Section 4.2.1.
Figure 105 shows that production and consumption of recovered paper in Europe is expected to double over the next 20 years, with production increasing from around 44 million MT in 2000 to 91 million MT in 2020 and consumption increasing from 41 million MT to 83 million MT over the same period. Consequently, net exports of recovered paper are expected to increase from about 3 million MT to 8 million MT.
Western Europe will continue to account for the largest share of European recovered paper production and consumption and will experience the largest increase in production and consumption. This is due to the high levels of paper and paperboard production and consumption there. However, production and consumption in the other two sub-regions is likely to grow faster (in percentage terms) than in Western Europe, due to faster growth in the markets for paper and larger expected increases in the recovery and utilisation rates for wastepaper.
In Western Europe, recovered paper production and consumption will increase at about the same rate as in the past, at an average annual rate of 3.1 percent and 3.0 percent respectively over the next two decades. Production will increase from around 39 million MT in 2000 to 72 million MT in 2020, while consumption will increase from 36 million MT to 65 million MT over the same period.
In Eastern Europe, recovered paper production and consumption will increase much more quickly than in the past. This will be partly driven by the implementation of EU recycling policies in many countries. This will lead to average annual growth in production and consumption of 7.2 percent and 6.3 percent respectively. Production will increase from around 2.9 million MT in 2000 to 11.7 million MT in 2020, while consumption will increase from 3.0 million MT to 10.1 million MT over the same period. It is expected that the increase in production (driven by recycling policies) will increase slightly faster than the capacity of the industry to absorb these materials, leading to a small amount of net exports.
Recovered paper production and consumption will also increase much more quickly than in the past in the CIS sub-region. In this case, this will be driven by the expansion of the paper industry as well as recycling policies. Here, production and consumption will grow at rates of 7.1 percent per year and 7.7 percent per year respectively, equal to an increase in production from 1.7 million MT in 2000 to 6.9 million MT in 2020 and an increase in consumption from 1.8 million MT to 8.1 million MT. Net imports of recovered paper will increase to around 1.2 million MT in 2020, with much of these imports probably coming from Eastern Europe.
Projections for the production and consumption of wood pulp were also not covered in the detailed analysis by Kangas and Baudin (2003). However, a crucial variable in the wood raw material balance is the net trade in wood pulp between Europe and the rest of the world (see Section 2.5.3). The main objective of the analysis presented here was to make projections of future net trade in wood pulp, but the results may also be useful to some users of the study.
Projections of the consumption of wood pulp by the paper and paperboard sector19 were calculated by subtracting the projections for consumption of recovered paper (converted to WRME) from the projections for paper and paperboard production (in WRME). By definition, after converting all of these figures to WRME, the remaining fibre requirement must be equal to pulp consumption by the paper and paperboard industry in WRME. The historical trends in pulp consumption (in WRME) were calculated in the same way and the resulting trends and projections were converted to year-on-year changes (in percent). The growth rates for the projections were then used to extrapolate the historical trends in consumption of wood pulp by the paper and paperboard sector to give projections for wood pulp consumption to the year 2020.
For projections of wood pulp production, the historical statistics for total wood pulp production were converted to multipliers of the level of consumption (e.g. if a country produced 20 percent more wood pulp than it consumed in a year, the multiplier would be 120 percent). These multipliers were then examined to see if they displayed any trends upwards or downwards.
For countries that are net importers of wood pulp (i.e. with a multiplier of less than 100 percent) the trends in recent years were mostly stable, suggesting that wood pulp production closely follows consumption. This is what might be expected in such countries, where most pulp production is in integrated pulp and paper production facilities and is used for the production of paper rather than for sale. The exception was Germany, where wood pulp production has declined slightly in relation to consumption in recent years.
For most of the countries that are net exporters of wood pulp, the trends were also stable. However, in a few cases, there were some slight declines in the multipliers. Presumably, this reflects a shift towards further processing of wood pulp into paper and paperboard for export in these countries.
The trends in the multipliers described above were extrapolated forwards and applied to the projections for wood pulp consumption, to give projections for wood pulp production to the year 2020. The two main exceptions to this were the Russian Federation and Portugal. In the Russian Federation, an expansion in pulp production (for export) was projected. This was based on the results of the outlook study for the Russian Federation, specially prepared for the EFSOS (OAO NIPIEIlesprom, 2003). In the case of Portugal, wood pulp production currently exceeds consumption by a large amount. However, production of paper and paperboard in Portugal is projected to increase significantly over the next 20 years. Given the availability of forest resources (i.e. potential pulpwood supply) in Portugal, a continued high level of net pulp exports can not be supported and a greater proportion of pulp production will probably be used domestically in the future. This adjustment to the outlook for wood pulp production was included in the projections.
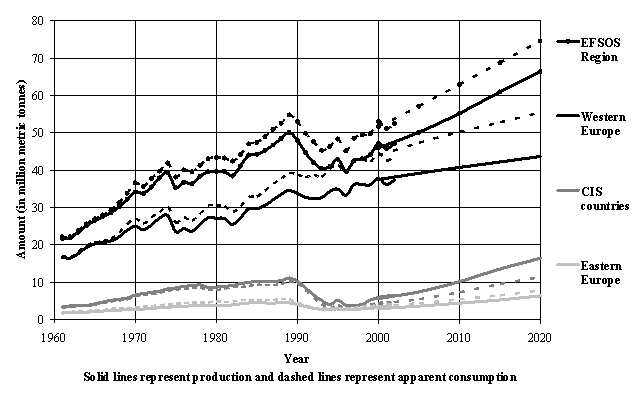
Figure 106 Trends and projections for the production and consumption of total wood pulp under the baseline scenario
Source: trends derived from FAOSTAT production and trade statistics; for projections - see Section 4.2.2.
Figure 106 shows the trends and projections for the production and consumption of wood pulp in Europe under the baseline scenario. (It was assumed that production and consumption of dissolving pulp would remain the same in the future and these figures include dissolving pulp in the total). As the figure shows, the projected growth in production and consumption will return to the long-term historical trend experienced before the 1990s and Europe as a whole will remain a major net importer of wood pulp.
Production is projected to increase from 46 million MT in 2000 to 66 million MT in 2020, while consumption is projected to increase from 52 million MT to 75 million MT over the same period. These increases are both equal to average annual growth of about 1.9 percent. Net imports will expand slightly from 6 million MT to 9 million MT over the period.
Growth in Western Europe will be subdued by the continued substitution of recovered paper for wood pulp in paper making and a reduction in the growth of wood pulp production for export. Production and consumption are projected to grow at an average annual rate of 0.8 percent and 1.2 percent respectively. This is equal to an increase in production from 38 million MT in 2000 to 44 million MT in 2020 and an increase in consumption from 44 million MT to 55 million MT. Net imports into Western Europe will increase significantly from 6 million MT to 11 million MT over the same period.
In Eastern Europe, wood pulp production and consumption will both double, growing at an average annual rate of 4.0 percent and 4.1 percent respectively. Production will increase from 2.9 million MT to 6.3 million MT over the next 20 years, while consumption will increase from 3.5 million MT to 7.8 million MT. Eastern Europe will remain a small net importer of wood pulp.
The greatest change in the wood pulp sector is expected in the CIS sub-region, where average growth in production and consumption is expected to reach 5.5 percent per year and 5.1 percent per year respectively. The projected three-fold increase in production will far exceed the expected increase in consumption, leading to an increase in net exports. A significant proportion of these exports will probably be destined for European markets, although an increase in trade with Asia can not be ruled-out. Production will increase from 5.6 million MT in 2000 to 16.4 million MT in 2020 and consumption will increase from 4.2 million MT to 11.3 million MT. Thus, net exports will increase from 1.4 million MT in 2000 to 5.1 million MT in 2020.
In the historical part of this analysis, wood chips and particles and wood residues20 were treated as an unquantified source of wood raw materials. Estimates of the utilisation and consumption of these materials were produced by subtracting the consumption of all known sources of wood and fibre from total wood and fibre demand. In the outlook, the historical trends in this source of wood raw materials have been analysed and have been used to make projections for the future. These projections can then be used to produce the derived demand for industrial roundwood.
This analysis comprised two main parts: an analysis of international trade in wood residues and an analysis of the residue utilisation rate.
For the analysis of international trade, it was noted that net exporters of wood residues tend to be countries where sawmilling accounts for a relatively large proportion of the whole forest sector. Conversely, net importers tend to have relatively small sawmilling sectors. This is as expected, as it broadly reflects the supply and demand for wood residues in each country. Therefore, countries were divided into two groups: net exporters and net importers.
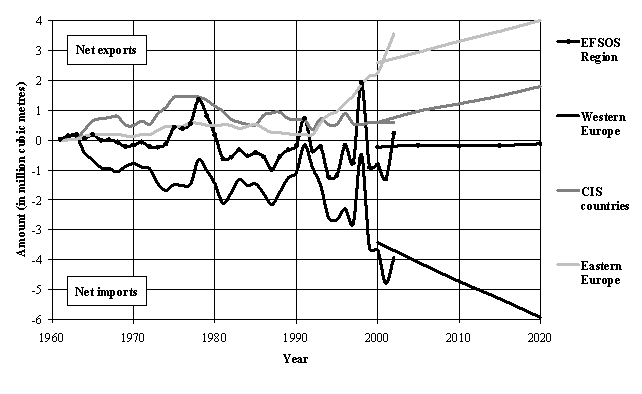
For net exporters, net exports of wood residues were projected to increase in proportion to the projected increases in sawnwood, plywood and veneer sheet production (i.e. the rates of growth in production in these sectors - converted to WRME - were used to extrapolate the historical time-series of net exports of wood residues). For net importers, the same process was applied, but using the projected increases in reconstituted panel production and paper production (after adjusting for the use of recovered paper). These calculations gave plausible projections for net trade in wood residues (see Figure 107), showing that increased flows of wood residues from east to west might be expected in the future.
To produce projections of the consumption of wood residues in the future, the historical trends in the residue utilisation rate were examined. Residue utilisation is the amount of residues consumed by the forest processing industry plus exports and minus imports and the utilisation rate is this amount divided by total residue availability (calculated from the sawnwood, plywood and veneer sheet conversion factors).
Figure 107 Trends and projections for net trade in wood chips, particles and residues
Source: trends from FAOSTAT trade statistics; for projections - see Section 4.2.3.
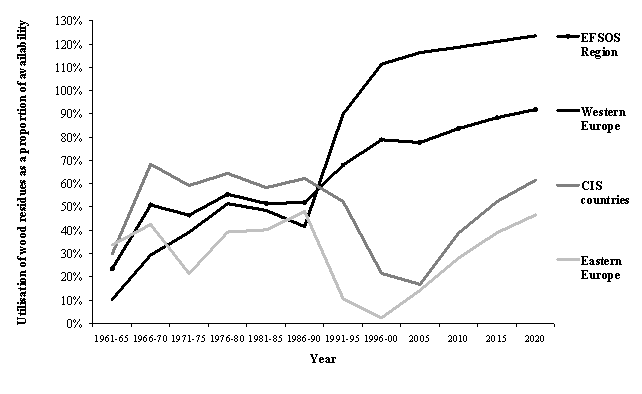
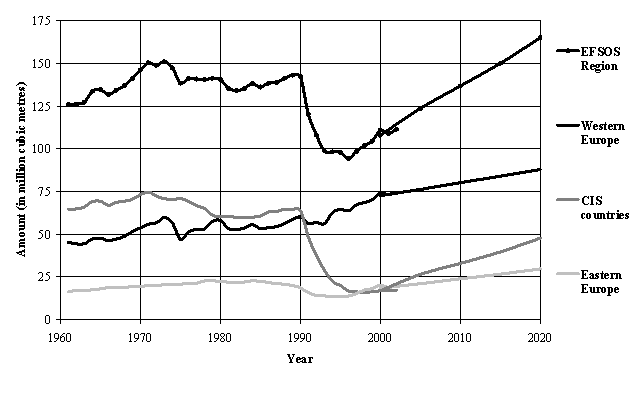
As already noted, Western Europe already has a utilisation rate of over 100 percent, due to the consumption of other unrecorded or unknown sources of wood and fibre, probably recovered wood, which is known to be important in some countries including Germany. Thus, for the majority of countries in this region the projected utilisation rate was held constant. For the few countries in Western Europe with currently low residue utilisation rates, a modest increase in the residue utilisation rate was included in the projections. For countries in Eastern Europe and the CIS sub-region, it was assumed that residue utilisation would return to the levels experienced up until the 1990s. These projections of residue utilisation (see Figure 108) were then applied to the projected total availability of wood residues (see Figure 109) to produce figures for projected residue consumption.
Although the presence of utilisation rates of over 100 percent is a weakness in the analysis and reflects problems of consistency in the forest products statistics, it is reasonable to assume that residue utilisation will increase in the east as the forest processing industry in these countries develops in the future. Furthermore, it can also be assumed that whatever is causing this problem (e.g. consumption of recovered wood products) will continue in the future. Based on the projections of increased utilisation of wood residues (and changes in trade), it is projected that residue consumption will increase by 30 million m3 in Western Europe, 25 million m3 in the CIS sub-region and 10 million m3 in Eastern Europe. In addition, the final projected level of residue consumption in the latter two regions would return to levels similar to those achieved in the late 1980s.
Figure 108 Trends and projections for the utilisation of wood residues
Source: trends derived from FAOSTAT production and trade statistics; for projections - see Section 4.2.3.
Figure 109 Trends and projections for the potential availability of wood residues
Source: trends derived from FAOSTAT production and trade statistics; for projections - see Section 4.2.3.
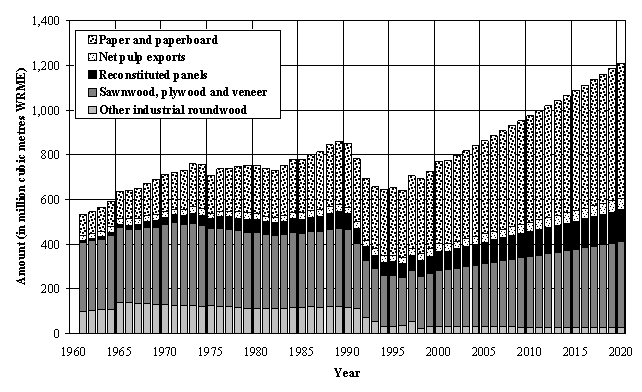
Projections for the future levels of wood raw material demand were produced in the same way as explained in Section 2.5.2 and it was assumed that the conversion factors (amount of wood required to produce one unit of forest product) would not change in the future. Based on the projections for the production of forest products, the projections shown in Figure 110 to Figure 113 were produced.
Figure 110 Trends and projections for wood raw material demand in Europe
Source: trends derived from FAOSTAT production and trade statistics; projections based on the outlook study analysis.
Figure 110 shows the projections for total wood raw material demand in the whole of Europe to 2020. This figure shows increases in the demand for wood and fibre across all major product categories except other industrial roundwood.21 Total demand is projected to increase by about 2.4 percent per year on average, from 771 million m3 WRME in 2000 to 1,210 million m3 WRME in 2020. Demand for wood and fibre for the reconstituted panel and paper and paperboard sectors will increase faster than average (2.9 percent and 2.6 percent respectively), while demand for sawnwood, plywood and veneer sheet production and net pulp exports will increase more gradually (2.2 percent and 2.0 percent respectively). As already noted, the projections for the different sub-regions of Europe will vary dramatically from the projection shown in Figure 110.
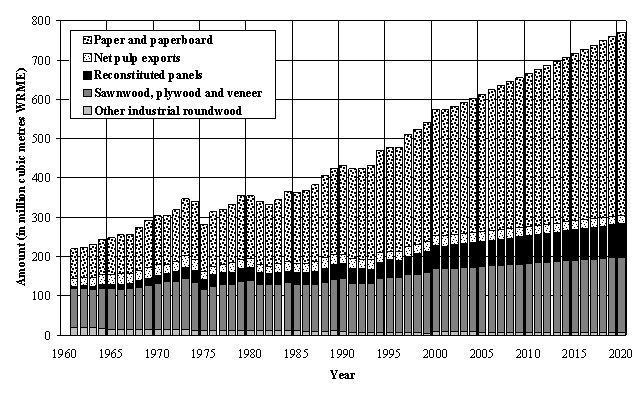
The projection for total wood raw material demand in Western Europe is shown in Figure 111. In Western Europe, total demand will increase by only 1.6 percent per year on average, from 573 million m3 WRME in 2000 to 771 million m3 WRME in 2020. In this sub-region, the demand for reconstituted panel production and paper and paperboard production will both increase by 2.0 percent per year, while demand for sawnwood, plywood and veneer sheet production will only grow at half this rate. A slight decrease in net pulp exports is anticipated, due to the reasons described in Section 4.2.2.
Figure 111 Trends and projections for wood raw material demand in Western Europe
Source: trends derived from FAOSTAT production and trade statistics; projections based on the outlook study analysis.
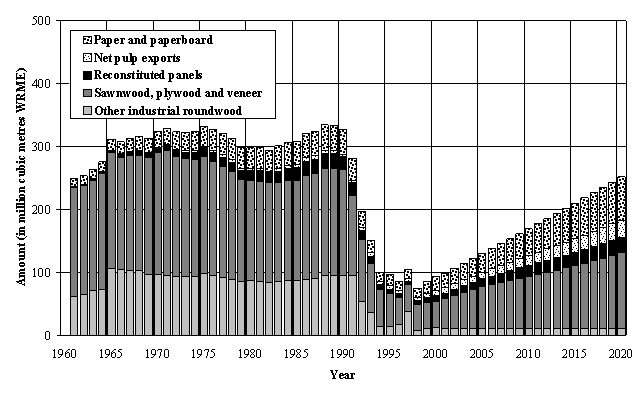
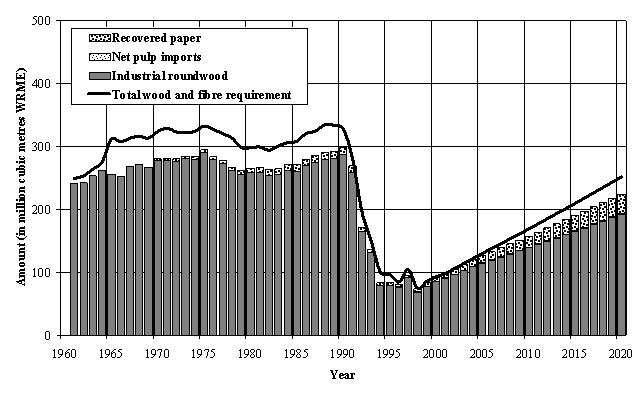
In the CIS sub-region, wood raw material demand is expected to increase by 5.3 percent per year on average, or a total increase of over 150 percent over the next two decades (see Figure 112). In 2000, total demand was around 93 million m3 WRME and this is expected to increase to 252 million m3 WRME in 2020. A projected increase in the consumption of sawlogs and veneer logs will account for the majority of the increase in total demand, with a projected three-fold increase in consumption from 43 million m3 WRME in 2000 to 120 million m3 WRME in 2020. The consumption of wood and fibre for the other three processing sectors (pulp, paper and reconstituted panels) will actually grow faster than the consumption of sawlogs and veneer logs (at over 6.0 percent per year), but the structure of industrial roundwood demand will remain heavily focused on sawlogs and veneer logs.
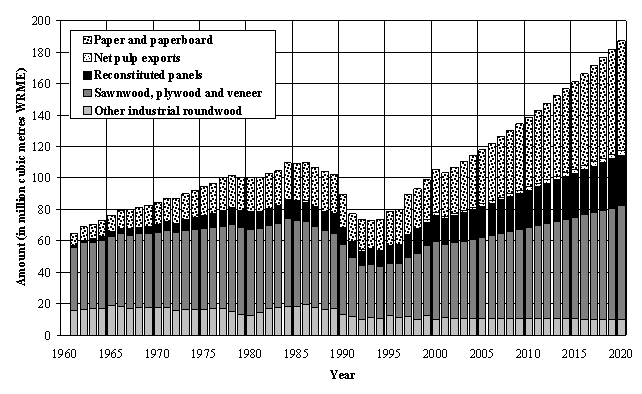
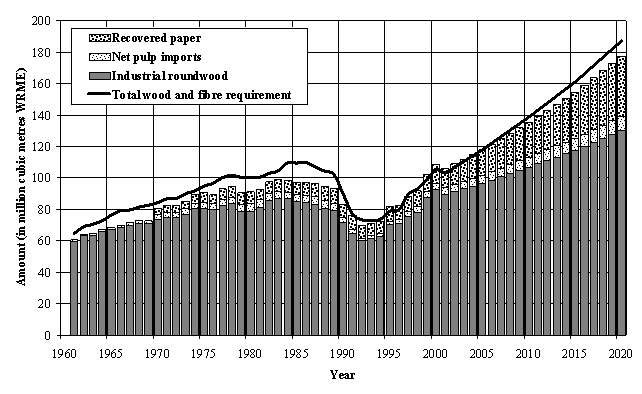
The projected growth in wood raw material demand in Eastern Europe will be equally dramatic, but will occur more broadly across all parts of the forest sector. Total demand will increase by 3.2 percent per year on average, from around 105 million m3 WRME in 2000 to 187 million m3 WRME in 2020 (see Figure 113). Growth in demand from the paper and paperboard sector will be highest, increasing at an annual average growth rate of 5.1 percent or from 26 million m3 WRME to 70 million m3 WRME over the period. Demand from the reconstituted panels sector will increase by 3.6 percent per year while demand from the sawmilling and plywood sectors will increase by 2.3 percent per year.
Figure 112 Trends and projections for wood raw material demand in the CIS sub-region
Source: trends derived from FAOSTAT production and trade statistics; projections based on the outlook study analysis.
Figure 113 Trends and projections for wood raw material demand in Eastern Europe
Source: trends derived from FAOSTAT production and trade statistics; projections based on the outlook study analysis.
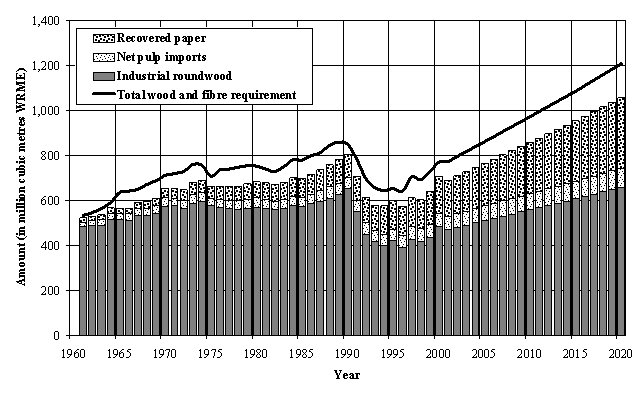
As noted in Section 4.2.3, the methodology used to identify the sources of wood raw material supply in the outlook projections was slightly different to the methodology used in the analysis of historical trends. In this case, the projections for consumption of recovered paper, wood residues and net pulp imports were subtracted from the projections of total wood raw material demand to produce projections of the consumption of industrial roundwood (or the derived demand for industrial roundwood). The results of this analysis are shown in Figure 114 to Figure 117. As before, the gap between the line and the total height of each bar represents the consumption of wood residues by the forest processing industry.
Figure 114 Trends and projections for wood raw material consumption in Europe
Source: trends derived from FAOSTAT production and trade statistics; projections based on the outlook study analysis.
Figure 114 shows the projections for consumption of each of the main sources of wood and fibre supply in Europe to 2020. Consumption of industrial roundwood and net pulp imports are both projected to increase at an average annual rate of 1.8 percent. Recovered paper consumption will increase by 3.6 percent per year on average and consumption of wood residues is projected to increase by 3.2 percent per year.
In Western Europe, consumption of industrial roundwood will increase by 0.8 percent per year on average, while consumption of recovered paper will increase by 3.0 percent per year (see Figure 115). Consumption of wood residues will increase by 1.4 percent per year on average. This rate of growth is relatively low, due to the low rate of growth projected for the sawmilling and plywood sectors. In addition, some of this growth in residue consumption will be due to the projected increase in net imports of wood residues into Western Europe. Net pulp imports will increase at an average annual growth rate of about 1.5 percent.
Figure 115 Trends and projections for wood raw material consumption in Western Europe

Source: trends derived from FAOSTAT production and trade statistics; projections based on the outlook study analysis.
Figure 116 shows the projected consumption of wood raw materials in the CIS sub-region. In this sub-region, industrial roundwood will remain by far the most important source of wood and fibre for the forest processing sector. However, consumption of recovered paper will grow more rapidly, at an average annual rate of 7.7 percent compared with a rate of growth of 4.2 percent for industrial roundwood. Similarly, consumption of residues is likely to expand rapidly over the next 20 years.
The pattern of projected wood raw material consumption in Eastern Europe will fall somewhere between the other two sub-regions (see Figure 117). Consumption of recovered paper will grow quite rapidly, at 6.3 percent per year on average. In contrast, consumption of industrial roundwood will increase at an average annual rate of only 2.0 percent. Given that recovered paper is already quite important in this sub-region, the dominance of industrial roundwood in the wood raw material supply is likely to be eroded significantly. Furthermore, net pulp imports are quite important in this sub-region and will grow at an average annual rate of 4.4 percent.
Figure 116 Trends and projections for wood raw material consumption in the CIS sub-region
Source: trends derived from FAOSTAT production and trade statistics; projections based on the outlook study analysis.
Figure 117 Trends and projections for wood raw material consumption in Eastern Europe
Source: trends derived from FAOSTAT production and trade statistics; projections based on the outlook study analysis.
One of the limitations of the current outlook study is that it was not possible to obtain projections for roundwood supply in Europe. Roundwood supply projections were produced for ETTS V (Pajuoja, 1995), based on information supplied by national experts. However, based on past experience and the advice of the national experts, it was decided not to attempt this part of the analysis in the EFSOS.
Projections of roundwood production and consumption are a very important component of any outlook study, as this information can be used to assess the impact of future forest harvesting on the forest resource. Projections of roundwood production are also, of course, of major interest to forest owners and managers. Therefore, an attempt was made to produce some tentative projections about the future level of industrial roundwood production. It should be noted that these are not officially endorsed statements of future production, but projections of the level of production that might occur in the future, based on market forces and other currently available information.
Projections of future industrial roundwood consumption were derived from the projections of wood raw material demand and supply of non-forest wood and fibre sources (as described above). The staring point for the projections of future industrial roundwood production was to assume that production would increase in the future at the same rate as consumption. These preliminary projections were then examined country by country and adjusted to take into account other published information such as:
• the previous projections of roundwood production used in ETTS V (Pajuoja, 1995);
• published national forecasts of future roundwood production, such as those from the United Kingdom Forestry Commission (2002);
• the outlook study for the Russian Federation (OAO NIPIEIlesprom, 2003); and
• information about future production from forest plantations (Brown, 2000).
In addition, information about the ratio of fellings to increment in each country was used to adjust the projections. Broadly speaking, the projections of future industrial roundwood production were adjusted upwards by a slight amount in countries with a high proportion of forest plantations, while production was reduced (or limited to no growth at all) in the few countries where the felling to increment ratio is already very high.
A further assumption that was incorporated into these projections was that the trade flows of industrial roundwood between the three sub-regions and between Europe and the rest of the world would remain roughly the same over the next two decades. Broadly speaking, industrial roundwood trade accounts for only a very small proportion of forest products trade and the quantities traded do not generally change by very much. However, Europe has experienced some major shifts in trade over the last decade, particularly in terms of increased exports of industrial roundwood from east to west. There are signs that this trade is stabilising, so it seemed reasonable to assume that trading patterns would not change significantly in the foreseeable future.
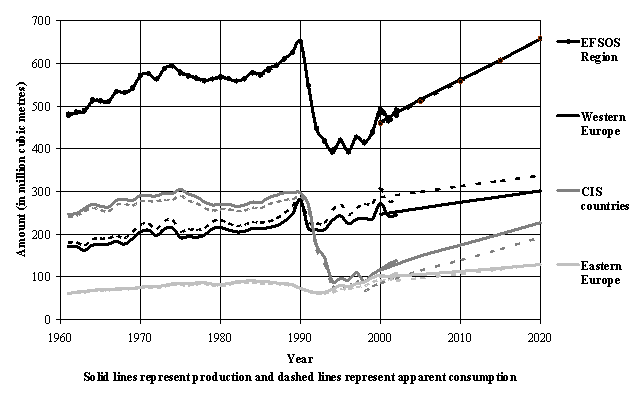
Figure 118 shows the projections for the production and consumption of industrial roundwood that were produced as a result of this part of the analysis. They show that production in Europe may expand by slightly less than consumption in the future, altering net trade from the current situation of net exports of 3 million m3 per year to net imports of 2 million m3 in 2020. Production in Western Europe is expected to increase by slightly more than consumption, due to increased production from forest plantations in some countries (Ireland, Spain, Portugal and the United Kingdom).
In addition, growth in production may revert to the rates experienced in the 1980s in some of the traditional large producers (Sweden, Finland, Germany and France). In Eastern Europe, it is expected that net exports (currently 12 million m3 per year) will decline to zero, because production will not keep up with consumption. The ratio of harvesting to increment in a few of these countries is already very high (e.g. Latvia and Estonia) and it was assumed that production in such countries would not increase over the next two decades. In the CIS sub-region, it is expected that net exports may increase very slightly to replace some of the losses in net exports expected from Eastern Europe.
Figure 118 Trends and projections for the production and consumption of industrial roundwood under the baseline scenario
Source: trends derived from FAOSTAT production and trade statistics; projections based on the outlook study analysis.
Based on the projected growth in consumption of industrial roundwood and the growth in demand from the sawmilling and plywood sector, consumption of sawlogs and veneer logs may grow slightly faster than consumption of pulpwood in Eastern Europe and the CIS sub-region, but growth for both types of industrial roundwood is expected to be about the same in Western Europe.
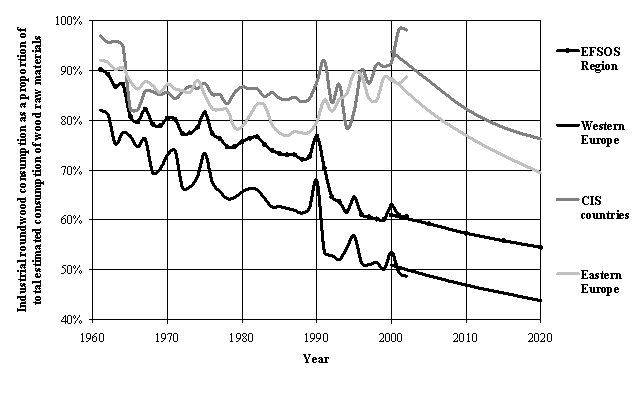
As in the past, the rate of growth in industrial roundwood production and consumption will fall behind the rates of growth in product markets due to the continued substitution of other types of wood and fibre for industrial roundwood. The importance of industrial roundwood as a source of wood raw material supply will fall slightly in Western Europe, as the scope for increased substitution of other types of wood and fibre is limited by technical factors. However, in Eastern Europe and the CIS sub-region, it is expected that the opposite will occur, as environmental policies are strengthened and changes in the structure of the processing sector open-up new opportunities to use recycled fibre and wood residues (see Figure 119).
Figure 119 Trends and projections for the importance of industrial roundwood as a source of wood raw material supply
Source: trends derived from FAOSTAT production and trade statistics; projections based on the outlook study analysis.
Table 29 The European wood raw material balance in 2020
Component |
Europe |
Sub-regions | ||
Western Europe |
Eastern Europe |
CIS | ||
Derived demand for wood raw materials |
||||
Other industrial roundwood |
27.7 |
6.9 |
10.1 |
10.7 |
Sawnwood, plywood and veneer sheets |
383.9 |
191.8 |
72.1 |
119.9 |
Reconstituted panels |
141.8 |
85.2 |
32.1 |
24.4 |
Net pulp exports |
52.1 |
21.5 |
3.0 |
27.7 |
Paper and paperboard |
604.1 |
465.1 |
69.9 |
69.1 |
Total derived demand |
1,209.7 |
770.6 |
187.2 |
251.8 |
Consumption of wood raw materials |
||||
Industrial roundwood |
659.4 |
337.4 |
130.0 |
192.0 |
Recovered paper |
315.4 |
246.5 |
38.3 |
30.7 |
Net pulp imports |
83.1 |
72.3 |
9.2 |
1.6 |
Other |
151.8 |
114.5 |
9.8 |
27.6 |
- net imports of chips, particles and residues |
0.1 |
5.9 |
-4.0 |
-1.8 |
- utilisation of wood residues |
151.7 |
108.5 |
13.8 |
29.4 |
Total consumption |
1,209.7 |
770.6 |
187.2 |
251.8 |
Note: the above figures are expressed in million m3 WRME. For trade in chips, particles and residues, imports are shown as a positive number and exports are shown as negative numbers.
Table 29 shows the projected wood raw material balance for the whole of Europe and the three sub-regions in 2020. Compared with Table 7, this shows that the structure of the forest sector in Eastern Europe and the CIS sub-region will start to diversify and look slightly more similar to Western Europe in 2020. However, the dominance of industrial roundwood and sawnwood production is likely to remain a feature of these two sub-regions for many years to come.
The EFSOS analysis of forest products markets did not examine trends in woodfuel production and consumption or produce an outlook for this component of the forest products sector. However, an earlier FAO study (Broadhead et al, in prep) examined global trends in the use of woodfuel and produced projections for every country in the World.
These projections were based on a statistical analysis of cross-sectional and time series data from countries, including official statistics at the national level (recorded in FAOSTAT) plus additional field-level information from a variety of sources. The study only examined trends in the consumption of woodfuel, which was modelled at the national, sub-regional and regional level, depending on the availability of data.
A number of statistical models were used to estimate trends in woodfuel consumption and produce projections to the year 2030. All consumption statistics were converted to consumption per capita and the models used the following explanatory variables: GDP; level of urbanisation (proportion of population living in urban areas); forest cover; temperature; level of oil production; total land area; and country-specific dummy variables. All of these variables were found to have a significant effect on the levels of per capita woodfuel consumption in countries and the variables had the expected signs (e.g. woodfuel consumption is generally higher in colder countries and countries with a higher level of forest cover, but lower in countries that have a higher GDP and higher level of urbanisation). The projections produced in this analysis are shown in Figure 120 below.
Overall, annual consumption of woodfuel in Europe is expected to decline from the current level of around 116 million m3 to 90 million m3 in 2020. Consumption in Eastern Europe and the CIS sub-region is expected to continue the declining trends in consumption recorded over the last four decades. In Eastern Europe, annual consumption of woodfuel is projected to decline from around 26 million m3 in 2000 to 17 million m3 in 2020. In the CIS sub-region, the projections show a decline from 57 million m3 in 2000 to 43 million m3 in 2020.
In Western Europe, the projections show almost no decline in future woodfuel consumption. The level of annual consumption recorded in 2000 - 33 million m3 - is expected to fall slightly to 31 million m3 in 2005, but remain at this level until 2020. This projection is due to some countries in Western Europe showing a declining trend in woodfuel consumption, while others show an increasing trend.
It should be noted that these projections follow a baseline or “business as usual” scenario. They assume that consumption is driven by socio-economic factors such as income growth and growth in urbanisation, which all tend to reduce woodfuel consumption over time. They do not take into account the possibility of new policy measures to increase the use of woodfuel as part of strategies to increase the use of renewable energy. Furthermore the data on which the projections are based are unfortunately unreliable and incomplete, and the resulting projections are significantly different from the upward trend desired by policy, such as the EU White Paper on renewable energy, and with trends observed in the early 2000s. Thus, they should be treated with a great deal of caution (see Section 4.6.6 for further discussion of an alternative scenario for the woodfuel sector).
Figure 120 Trends and projections for the consumption of woodfuel in Europe
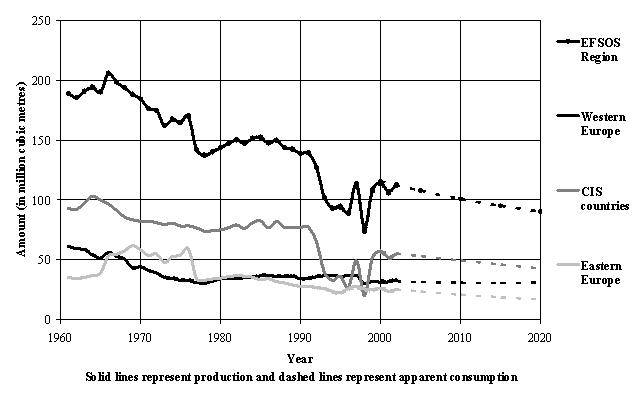
Source: Broadhead et al (in prep). Note the caveats about data quality and methods set out in the text
The statistics available for NWFPs and forest services are quite weak, so it has not been possible to undertake a detailed and quantitative analysis of the trends in these forest outputs or construct models and produce projections for the outlook. However, based on the information that is available, it is possible to present a qualitative assessment of what the future might look like for these outputs and this is done below. Following this, a short section also examines the outlook for employment in the forest sector.
In general, the outlook for NWFPs will vary by product and by sub-region, depending on future trends in the main socio-economic driving forces. Broadly speaking, the following market developments might be expected in the future:
Collection of NWFPs as a recreation activity. Already, the collection of NWFPs is more of a recreational activity than a commercial activity or necessity in most of Western Europe. Thus, it can be expected that the production of some NWFPs might increase in future in line with an expected increase in forest recreation. In particular, an increase in production of fruits and berries, mushrooms and (possibly) medicinal plants might occur in the future.
Commercial collection of NWFPs. In Western Europe, commercial collection of NWFPs is likely to continue to decline, due to the labour intensive nature of these activities and the relatively high labour costs in Western Europe. This is most likely to affect the production of those NWFPs already listed above. The existing trend towards more intensive management should work in the opposite direction in the case of truffles and cork, leading to increased production in the future. In addition, it is possible that active management of medicinal plant and foliage production might occur (e.g. with deliberate planting of desired plants) if increased market demand makes this a financially viable proposition. This would lead to growth in production, but this is far from certain.
In Eastern Europe and the CIS sub-regions, relatively low labour costs will continue to give these sub-regions a comparative advantage in commercial NWFP production. However, there is a risk that some sectors will decline in the face of competition from countries outside Europe with better growing conditions and even lower labour costs (e.g. China).
Demand for edible NWFPs. In Western Europe, it is possible that demand for many edible NWFPs will increase in the future as social trends continue to stimulate interest in natural and organic foods. In particular, this may affect some of the higher value products such as mushrooms and honey. The outlook for these products in the other two sub-regions is far from certain. On the one hand, these could be viewed as inferior goods, in which case rising incomes would tend to reduce demand. On the other hand, they could experience trends that are similar to those expected in Western Europe. On balance, a safe assumption would be that demand will not change by very much in these countries in the future.
Demand for medicinal plants. Based on the socio-economic projections for Western Europe, an increase in demand for medicinal plants might be expected in this sub-region in the future. However, if such an increase were to arise, it would probably be only a gradual increase. In the other two sub-regions, the problem noted above (for edible NWFPs) would also apply to this market, making it very difficult to suggest what the future market might look like.
Markets for cork. Stable and moderate growth appears to have returned to the market for cork bottle stoppers and it seems unlikely that producers of high quality wines will switch to alternative materials, so long as the product remains price competitive and reliable. Low-cost competition from other producers (e.g. in North Africa) reduced demand in the 1980s, but this problem also seems to have been overcome, Therefore, there is little reason to suggest that cork production and consumption will not continue to increase modestly, in line with recent historical trends.
Decorative foliage and Christmas trees. Both of these NWFPs are luxury items, so there is always a possibility to raise prices in Western Europe, with innovative marketing and advertising. Studies of the wider market for floral products have suggested that future growth will be very strong (especially in Western Europe), so the prospects for increased demand for decorative foliage seem quite good. In the case of Christmas trees, it seems reasonable to assume that demand will largely be driven by population numbers. Therefore, only very slight growth in the demand quantity might be expected in the future (although, as noted above, growth in the value of this market could be higher).
Tree nuts. The historical statistics for tree nut production and consumption show quite strong trends, indicating level consumption with declining production in Western Europe and increasing consumption and production in the other two sub-regions. It would be reasonable to assume that these trends will continue.
Hunting (game meat and pelts). It is not possible to make projections for this activity without more in-depth information about the economic and social driving forces that underlie this activity.
Protection of soil, water and infrastructure. Historical statistics have shown that demand for this forest function is quite small overall, but very high in specific locations. It has also shown that supply and demand have not changed very much in the past (see Figure 12). It seems likely that the importance of this function will remain unchanged in the future.
Recreation demand. Demand for forest recreation is already probably very high in Western Europe, so high growth in visitor numbers seems unlikely given the expected changes in population. Furthermore, high growth would probably lead to more problems of overcrowding in some countries, which would also tend to have a self-regulating effect on the growth in numbers. In the future, it seems most likely that demand will increase for a higher quality of forest recreations experience (e.g. more organised and specialised recreation activities and a higher expectation of visitor facilities). In contrast, high growth in forest recreation can be expected in the other two sub-regions, as these countries rapidly develop in the future.
Demand for biodiversity conservation. Demand for biodiversity conservation will probably increase in all countries, due to the projected changes in socio-economic forces. Again, the largest increases in demand might occur in the future in Eastern Europe and the CIS sub-region, where economic growth will be most rapid.
Recreation and biodiversity supply. The supply of these forest services in the future will very much depend upon government policies. Some forest owners will probably develop commercial forest recreation businesses, but even this will be determined in part by government policies (e.g. planning regulations). Apart from this, supplying forest recreation services will remain a loss-making activity (in a financial sense) for the majority of forest owners and managers, as will biodiversity conservation. The future supply of these services will depend upon future public support for these activities, so this is an area where individuals in the sector can have an influence on the future course of events and it would be inappropriate to speculate about this here.
Mitigation of climate change. On the supply-side, Europe’s forests are almost certainly going to continue to increase in volume over the next 20 years, so increased “supply” of carbon storage in the future is virtually guaranteed. On the demand-side, much will depend on future policies and the incentive mechanisms that are developed to encourage reductions in net carbon emissions.
There remains considerable uncertainty about the exact mechanisms for controlling carbon emissions that will be chosen by countries. However, it seems likely that climate change will be taken info account in the formulation of policies for the forest sector in the future. These might include measures such as the following:
• measures to maintain carbon stock in forest ecosystems, by keeping losses of woody biomass below increment and by avoiding silvicultural practices leading to carbon loss from forest soil;
• incentives for wood energy use (from existing forests and trees outside the forest, new plantations, industry residues or recovered wood products) as part of the general promotion of renewable energy;
• measures to encourage the use of forest products instead of less “carbon-friendly” materials, based on sophisticated and detailed life cycle analysis (it should be noted that life cycle analysis will not always endorse the use of forests products, but may be expected to be a positive influence overall); and
• incentives to encourage the establishment of new fast-growing plantations, some for the supply of wood energy and some for carbon sequestration: in Western and Central Europe, the extent of these plantations is likely to be limited by competing land uses, but in the rest of Europe, there is considerable development potential.
At present, employment in the European forest sector is about 3.9 million full-time equivalents (FTE). Over the last few decades, labour productivity has been rising faster than the volume of production, so total employment in the sector has been falling steadily. It is expected that this trend will continue, so that total employment in 2010 would be just over 3.5 million FTE.
Regarding employment quality, wage levels in the pulp and paper sector compare favourably with those in the other two forestry sub-sectors and with average manufacturing wages, but wages in forestry and the wood industries are typically lower than average. Furthermore, the wages paid to females continue to be significantly lower than those paid to male employees.
The health and safety situation has improved in the forest processing industry but continues to be a major problem in forestry in many countries. In some regions and for some groups, the situation has actually deteriorated significantly over the past decade, most notably for the self-employed and private forest owners in Eastern Europe.
Projections of future wood product production and consumption have been produced for all three of the alternative scenarios described in Section 3.4. Overall, the projections are quite sensitive to the choice of alternative scenarios, with the conservation scenario reducing market growth (compared to the baseline scenario) by between 30 percent and 60 percent (depending on the product) and the integration scenario increasing growth by similar amounts in the opposite direction. However, there are significant differences between sub-regions and products. In general, the CIS sub-region is most affected by the choice of scenario, followed by Eastern Europe, while market expansion in Western Europe is generally less sensitive to the choice of scenario. The following text describes some of the main differences between these projections by sub-region and product.
Figure 121 shows the projections for coniferous sawnwood production and consumption under the three alternative scenarios. This shows that, at the European level, total growth in the production and consumption of coniferous sawnwood would be reduced by about 50 percent (compared to the baseline) under the conservation scenario or increased by about 50 percent under the integration scenario.
Comparing the three alternative scenarios, the figure shows that the relatively small changes anticipated under each of the scenarios would have a significant impact on the growth of coniferous sawnwood markets in Europe. For example, under the conservation scenario, total production is projected to increase by around 28 percent, while under the integration scenario it would increase by 88 percent. For consumption, the corresponding increases would be 21 percent and 65 percent.
However, at the sub-regional level, there are significant differences between the alternative projections in each of the three sub-regions. In Western and Eastern Europe, the differences between the three alternatives scenarios are quite small. Compared with the baseline scenario, total growth in coniferous sawnwood markets in Western Europe would be reduced by 40 percent under the conservation scenario or increased by 40 percent under the integration scenario. In Eastern Europe, the projections show a variation in total growth of +/- 35 percent under the two alternative scenarios.
The figure shows that the CIS sub-region is the location that is most sensitive to the alternative socio-economic scenarios. Under the conservation scenario, total production and consumption would both increase by about 80 percent by 2020 (compared with the baseline scenario of total growth of around 200 percent in both cases). However, under the integration scenario, production is projected to increase by 316 percent by 2020, with a projected increase in total consumption of 309 percent over the same period. This variation between the different scenarios in the CIS sub-region accounts for the majority of the variation between scenarios at the European level. It also accounts for nearly all of the difference in net exports from Europe under the different scenarios.
Figure 121 Projections for the production and consumption of coniferous sawnwood in 2020 under the three alternative scenarios
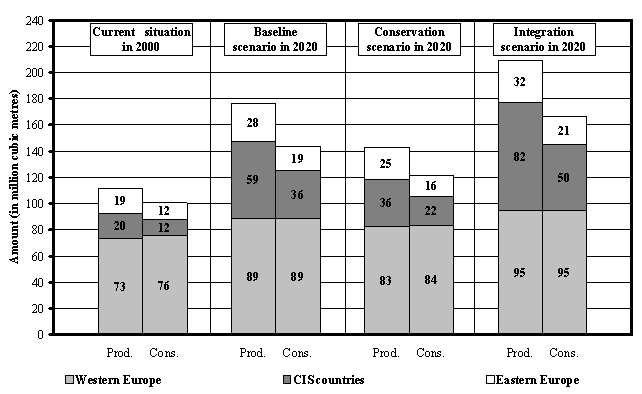
Source: Kangas and Baudin (2003).
Figure 122 presents the same information for non-coniferous sawnwood markets. In this case, the sensitivity of the projections to the alternative scenarios is about the same, with total growth reduced by about 50 percent under the conservation scenario or increased by about 50 percent under the integration scenario. Furthermore, the projections in all three sub-regions change significantly between the different scenarios. The only exception to this is non-coniferous sawnwood production in Western Europe, which is not affected very much by the different underlying scenarios.
Figure 122 Projections for the production and consumption of non- coniferous sawnwood in 2020 under the three alternative scenarios
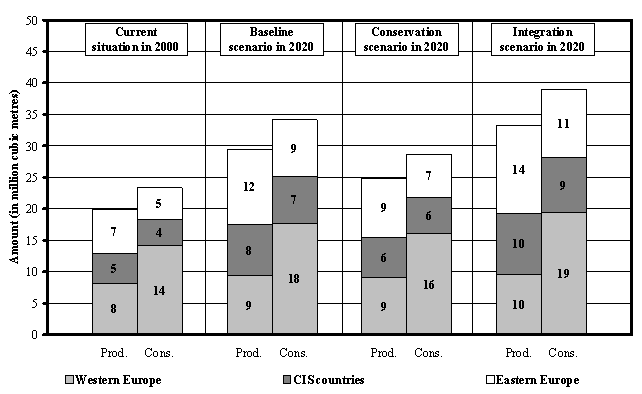
Source: Kangas and Baudin (2003).
Figure 123 presents the outlook for European fibreboard markets under the three different scenarios. Again this shows that the alternative scenarios have a significant impact on total growth in European production and consumption, with changes of +/- 50 percent in total growth under the integration and conservation scenarios.
Markets in Western Europe are least sensitive to the alternative scenarios. Production and consumption are projected to increase by 60 percent and 50 percent respectively under the baseline scenario. Under the conservation scenario, the corresponding figures would be 38 percent and 28 percent while, under the integration scenario, they would be 81 percent and 73 percent. Thus, total growth would be approximately one-third higher under the integration scenario or one-third lower under the conservation scenario.
Eastern Europe is the second largest fibreboard market in Europe and is very sensitive to the alternative scenarios. Under the baseline scenario, production and consumption are projected to grow by 125 percent and 150 percent respectively by 2020. Under the conservation scenario, this growth would be cut by more than half, resulting in increased production of only 56 percent and an increase in consumption of only 64 percent. Under the integration scenario, total growth in production and consumption would be 193 percent and 237 percent. The projections for the CIS sub-region show a similarly high sensitivity to the alternative scenarios, with an increase or reduction in total growth of more than 50 percent under the integration and conservations scenarios.
Figure 123 Projections for the production and consumption of fibreboard in 2020 under the three alternative scenarios
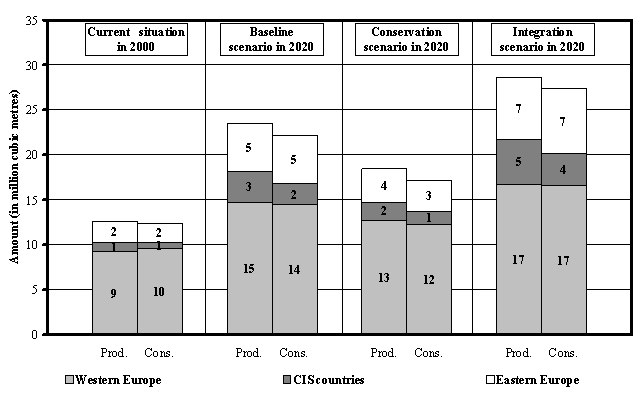
Source: Kangas and Baudin (2003).
Figure 124 shows the projections for production and consumption of particleboard under the three different scenarios. In this case, the outlook is much less sensitive to the alternative scenarios, with a baseline projection of production and consumption growth of 66 percent and 68 percent respectively, projections of growth in production and consumption of 40 percent and 36 percent under the conservation scenario and projections of 93 percent growth and 100 percent growth in production and consumption under the integration scenario.
The reduced impact of the alternative scenarios on production and consumption is due to the dominance of Western Europe in this market and the low sensitivity in this sub-region to the underlying differences between the alternative scenarios. For example, total growth in production and consumption would only change by about one-third under the conservation and integration scenarios (compared with the baseline scenario).
The projections for Eastern Europe are also not greatly affected by the choice of scenario, with a variation in total growth of about +/- 40 percent under the integration and conservation scenarios. The CIS sub-region has the largest projected growth of all three sub-regions (230 percent growth in production and 238 percent growth in consumption under the baseline scenario), but is the most sensitive to the alternative scenarios. Total growth would be reduced by more than half under the conservation scenario or increased by more than half under the integration scenario. Although these results are very different under the three alternative scenarios, these differences have less of an impact at the European level because the CIS sub-region accounts for only a small share of the total European market.
Figure 124 Projections for the production and consumption of particleboard in 2020 under the three alternative scenarios

Source: Kangas and Baudin (2003).
One other point worth noting is that the projections of consumption are affected much more than the projections of production by the choice of future scenario. Thus, under the baseline and conservation scenarios, the level of net exports from Europe is projected to increase compared to the current situation while, under the integration scenario, the level of net exports would diminish.
Figure 125 shows the projections for plywood and veneer sheet production and consumption under the three alternative scenarios. The markets for these products are the most sensitive to the choice of alternative scenario, showing a decline in total growth of production and consumption of over 50 percent under the conservation scenario or an increase in growth of more than 50 percent under the integration scenario. This sensitivity of the projections to the choice of scenario is almost the same across all three sub-regions.
Figure 125 Projections for the production and consumption of plywood and veneer sheets in 2020 under the three alternative scenarios
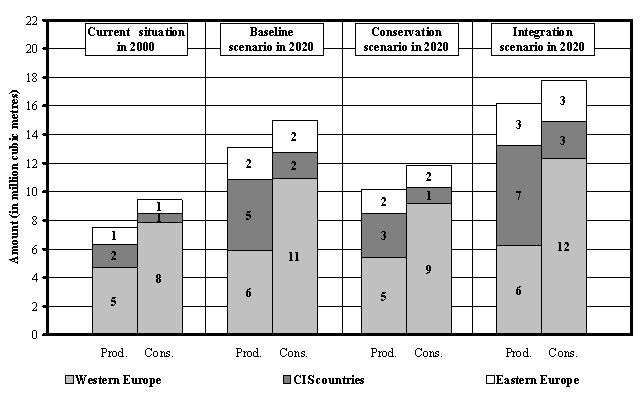
Source: Kangas and Baudin (2003).
Figure 126 shows the newsprint production and consumption projections under the three alternative scenarios. At the European level, the projections are very sensitive to the choice of scenario. The baseline scenario shows a total increase in production of 68 percent by 2020 and an increase in consumption of 62 percent. Under the conservation scenario, these figures would fall to 31 percent and 35 percent respectively while, under the integration scenario, they would increase to 106 percent and 90 percent. Thus, the difference in total production growth between the baseline scenario and the two alternative scenarios is +/- 50 percent (and slightly less than this in the case of growth in consumption).
The CIS sub-region accounts for most of the difference between the projections under each of the three alternative scenarios. Under the baseline scenario, production in the CIS sub-region is projected to increase by 288 percent by 2020. Under the conservation scenario, the projected increase is cut to 104 percent while, under the integration scenario, it is raised to 467 percent. These differences are huge and would result in a very different balance of production across Europe as a whole. For example, under the conservation scenario, the relative importance of the CIS sub-region will remain about the same as it is now, accounting for slightly less than 20 percent of all European production. However, under the Integration scenario, the CIS sub-region would account for almost 40 percent of total European newsprint production.
The differences between the alternative scenarios in the CIS sub-region also account for the differences in European net trade under the alternative scenarios. Under the conservation scenario, net exports from Europe will diminish slightly but, under the integration scenario, Europe would become a major net exporter of newsprint, largely from the CIS sub-region.
Figure 126 Projections for the production and consumption of newsprint in 2020 under the three alternative scenarios
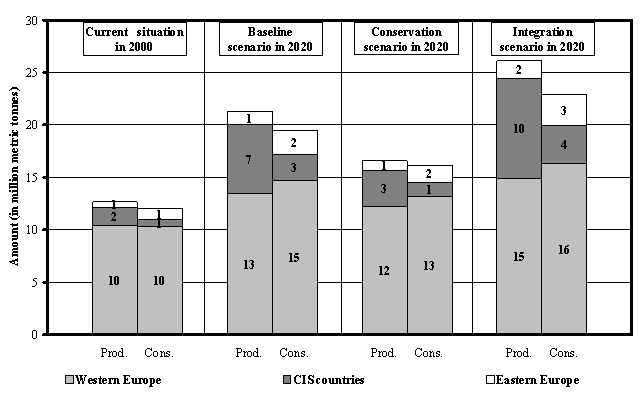
Source: Kangas and Baudin (2003).
Projections for production and consumption of other paper and paperboard under the three alternative scenarios are given in Figure 127. This figure shows that the expansion of this market is not affected as much by the choice of alternative scenario. The baseline scenario shows total growth in production and consumption of 64 percent and 67 percent respectively. Under the conservation scenario, these figures would both be 37 percent while, under the integration scenario, they would increase to 90 percent and 96 percent respectively.
The sensitivity of this market to the choice of scenario is quite low because of the dominance of Western Europe in this market. Market expansion in both Western Europe and Eastern Europe would fall by less than 50 percent under the conservation scenario (or increase by less than 50 percent under the integration scenario).
The CIS sub-region is more sensitive to the choice of scenario. For example, the conservation scenario shows a projected increase in production and consumption of 72 percent, compared with a baseline projection of a 170 percent increase in production and a 173 percent increase in consumption. However, the CIS sub-region accounts for only a small share of the total European market, so these results have little effect at the European level.
Figure 127 Projections for the production and consumption of other paper and paperboard in 2020 under the three alternative scenarios
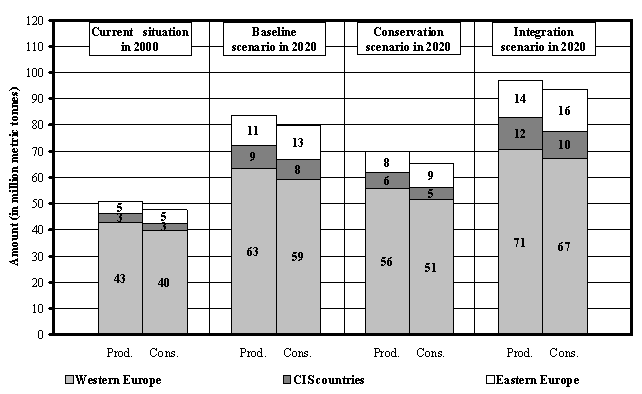
Source: Kangas and Baudin (2003).
Figure 128 shows the difference between the projections for production and consumption of printing and writing paper under the three alternative scenarios. This also shows that the expansion of these markets is not strongly affected by the choice of scenario, although projected net trade from Europe is quite different under the alternative scenarios.
Again, this market is dominated by Western Europe, where market expansion is not greatly affected by the choice of scenario. The baseline projection for Western Europe shows growth in production and consumption of 55 percent and 76 percent by 2020. Under the conservation scenario, total growth would only amount to 39 percent and 50 percent for production and consumption respectively. Under the integration scenario, the corresponding figures would be 70 percent and 104 percent. The much greater sensitivity of consumption to the choice of scenario also affects the net trade position for Western Europe (and Europe as a whole), with a significant level of net exports in 2020 under the conservation scenario and a much lower level of net exports under the integration scenario.
In Eastern Europe, projected total growth in production and consumption is 246 percent and 282 percent respectively under the baseline scenario. The corresponding figures under the conservation scenario are 124 percent and 127 percent, or around half of the expected increase under the baseline scenario. The integration scenario shows a similar change in market expansion in the opposite direction, with an increase in the growth in production and consumption by more than 50 percent. The different levels of growth in East European consumption also contribute significantly to the differences in net trade in Europe under the alternative scenarios.
The CIS sub-region shows a similar amount of sensitivity to the choice of scenario, but the effect on European markets as a whole is relatively small, because this sub-region accounts for only a small share of the total European market for printing and writing paper.
Figure 128 Projections for the production and consumption of printing and writing paper in 2020 under the three alternative scenarios
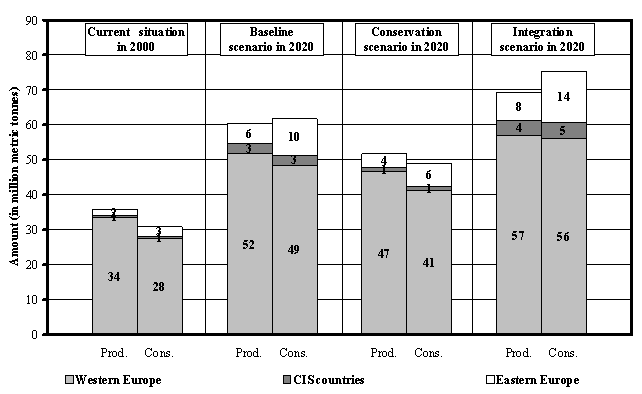
Source: Kangas and Baudin (2003).
Projections for the future production and consumption of wood pulp in Europe were constructed as previously described (in Section 4.2.2), by calculating wood pulp consumption from the wood and fibre required to produce the projected levels of paper production, after subtracting the projected consumption of recovered paper (all in WRME). Also as before, production of wood pulp was estimated from the trends in the historical relationship between wood pulp production and consumption in individual countries. The assumptions about future levels of wastepaper recovery and use were not changed in the alternative scenarios (although it might be expected that higher levels of wastepaper recovery could be reached in some countries under the conservation scenario).
Figure 129 shows the projections for wood pulp production and consumption in 2020 under the three alternative scenarios. These show that the projections are very sensitive to the choice of future scenario. Under the baseline scenario, production and consumption of wood pulp are both projected to increase by 44 percent by 2020. Under the conservation scenario, these increases are cut by almost two-thirds, with a projected increase in production of only 15 percent and a projected increase in consumption of 19 percent. Under the integration scenario, the corresponding increases are 74 percent and 70 percent. The relatively large differences between the alternative scenarios are due to the different effects that each scenario has on the production and consumption of paper and paperboard (and, as a result of this, the changes to wastepaper recovery).
Figure 129 Projections for the production and consumption of wood pulp in 2020 under the three alternative scenarios
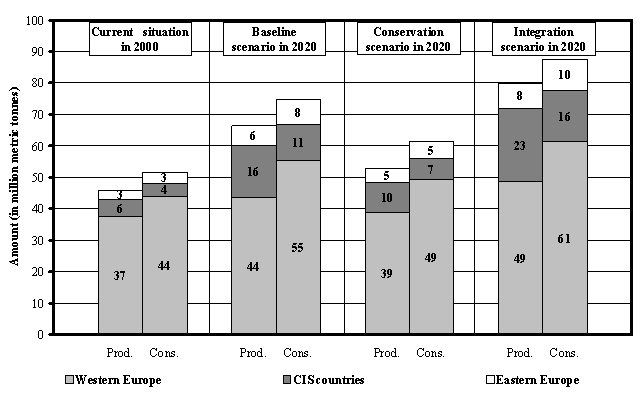
Source: based on the outlook study analysis (see Section 4.2.2).
Western Europe accounts for the largest proportion of European wood pulp production and consumption and accounts for most of the differences between the alternative scenarios. For example, under the conservation scenario, wood pulp production would increase by only three percent by 2020 compared with a total increase of 16 percent under the baseline scenario and an increase of 30 percent under the integration scenario.
The other sub-region that is greatly affected by the choice of scenario is the CIS sub-region, but this sub-region is a net exporter of wood pulp and the differences between the alternative scenarios are not that great and tend to act in the opposite direction. For example, under the conservation scenario, production still increases by 70 percent by 2020, compared with the baseline scenario increase of 192 percent. Although this is less than half of the projected increase under the baseline scenario, the cut in expansion is nowhere near as dramatic as that for Western Europe.
The net effect of these sub-regional differences is that the level of net imports of wood pulp into Europe is not significantly affected by the choice of scenario as differences in net trade with Western Europe are balanced by changes in the opposite direction in the CIS sub-region.
Projections of industrial roundwood production and consumption have also been produced for each of the three alternative scenarios. As before, the projections of consumption have been based on the derived demand for industrial roundwood, while the projections of production have been based on the demand projections and modifications to take into additional available information about roundwood supply and the condition of Europe’s forest resources (see Section 4.3.3).
The projections for production and consumption of industrial roundwood under each of the three alternative scenarios are shown in Figure 130. At the European level, the choice of scenario has a significant impact on the total growth in industrial roundwood production and consumption. For example, under the baseline scenario, production is projected to increase by 42 percent, while consumption is projected to increase by 44 percent by 2020. Under the conservation scenario, both figures would be cut to 16 percent. Under the integration scenario, production would increase by 70 percent, while consumption would increase by 72 percent.
Figure 130 Projections for the production and consumption of industrial roundwood in 2020 under the three alternative scenarios
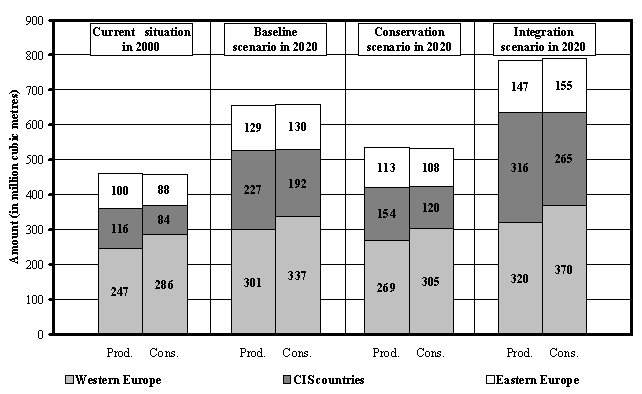
Source: based on the outlook study analysis (see Section 4.3.3).
On the demand side, the differences between the consumption projections under the three different scenarios are largely driven by the differences in the projections for products markets (described above). Furthermore, as already noted for wood pulp above, some of these differences are magnified by the different effects that each scenario has on the production and consumption of processed products and the availability of alternative non-forest sources of wood and fibre. Thus, for example, growth in the consumption of industrial roundwood in Western Europe would be cut by more than half under the conservation scenario compared with the baseline scenario.
On the supply side, the same constraints already described in Section 4.3.3 have been applied to the alternative scenarios, notably that some countries would be limited in their ability to increase wood supply significantly to meet increasing demands. However, as also noted above, some countries with forest plantation resources are not constrained so much and others have an abundance of potential supply.
The conservation scenario implies a very modest increase in the production and consumption of industrial roundwood in all three sub-regions, which can easily be achieved with the available forest resource. However, under the integration scenario, some countries in Western and Eastern Europe would find it difficult to meet additional demands from domestic forest resources.
The CIS sub-region does not face these constraints and it has been assumed that future demand for industrial roundwood could be easily met by increased production and exports from this sub-region and a very small increase in net imports from outside Europe. It should also be noted that, under this scenario, the projected level of industrial roundwood in the CIS sub-region would, by 2020, approach the levels achieved before the 1990s. Thus, although the almost three-fold increase in production may seem remarkable, it would not go beyond the level of production that has been achieved before in the past.
The previous five sections of this study have described what might happen to European forest products markets under a baseline or “business as usual” scenario and two alternative scenarios, focusing on greater emphasis on conservation in Europe’s forests or a more rapid drive towards economic growth and integration between the different European sub-regions. For reasons of focus and clarity, the analysis does not explore in detail some of the other possible changes that might occur in the future, such as those described in Thoroe et al (2004). However, there are two significant issues that should be mentioned as likely to have an effect on forest products markets in the future.
Technological change. Changes in technology have already had a significant impact on European forest products markets and are likely to do so in the future. The analysis presented here is based on statistical relationships estimated from past trends in historical data. Thus, to the extent that technological changes have already occurred in the market place, they should reflect some of the current trends in technology. However, this methodology can not identify or examine the impact of new and emerging technologies on markets.
Two major changes in technology are currently developing and are not likely to be reflected in these projections. The first of these is the growth of office automation, the internet and electronic communication. Changes in the way that information is stored, reproduced and communicated could have a profound impact on the future markets for paper and paperboard. On the one hand, increased use of computers has not led to the “paperless office”, but has probably tended to increase the consumption of printing and writing paper. To a large extent, this shift in technology is probably captured quite well in these projections. On the other hand, changes in the way that people communicate (e.g. e-mails, websites, etc.) could lead to lower demand for printing and writing paper and newsprint. Widespread use of the internet is only a recent phenomenon, which has increased significantly in Western Europe and, to a lesser extent in Eastern Europe. The extent to which this will reduce the demand for paper is unknown and the effect of this change in technology is still too recent to influence the statistical models that are based on historical supply and demand.
Another recent technological innovation is the development of new solid wood products and the greater acceptance of these products in the marketplace. Relatively new products such as OSB and MDF have been used for a while now in Europe and the projections probably capture most of the shift towards using these products. However, a whole new range of engineered wood products are gradually gaining acceptance in the market place (e.g. high-density fibreboard, laminated veneer lumber, I-joists, pre-cut lumber, etc.). Greater use of these products in the future is expected, but there is currently insufficient information to estimate exactly what effect they might have on forest products markets in the future. They will certainly result in some substitution between wood products as they are used in stead of older, traditional (and usually more expensive) products such as plywood and sawnwood. However, the development of these products may also expand the markets for wood products more generally.
The overall effects of these technological changes could be slightly less paper production and consumption than presented in these projections and slightly more of a shift from sawnwood and plywood towards wood based panels.
Wood energy. The other major issue that is currently highly relevant to the outlook is the future use of woodfuel as part of strategies to increase the production of renewable energy in Europe. As already noted, a baseline scenario for woodfuel consumption suggests that this will continue to decrease in the future, in line with historical trends. However, if policies are put in place to deliberately encourage the use of woodfuel in the future, the consumption of woodfuel could increase significantly.
The impact of renewable energy policies on the outlook for woodfuel will depend upon how much encouragement (e.g. subsidy) is given to promoting the use of woodfuel and the focus of such support. Broadly speaking, the lowest cost sources of wood for energy production are likely to be residues from the wood processing sector. These are already concentrated at specific sites (i.e. wood processing facilities), many of which are in urban areas (where demand for energy is highest). The next most cost-effective sources of woodfuel are likely to be forest residues and thinnings, followed by tree crops grown specifically for woodfuel production (energy crops).
Demand-side policies that encourage renewable energy production at the lowest possible cost (e.g. subsidies per unit of energy produced) are likely to result in the diversion of wood processing residues to energy production. However, supply-side policies that encourage the utilisation of forests or the establishment of new energy crops are likely to favour alternative sources of woodfuel supply. The latter may be chosen in order to meet broader objectives of rural development and the reduction of agricultural production, as well as the objective of increasing renewable energy supply.
Given the very different effects of these policies on forest products markets, this would suggest that the outlook for woodfuel production is currently very uncertain and could have both positive and negative effects on the rest of the forest sector. In view of the outlook presented above, this is a potentially interesting area for further discussion and analysis.
The projections of roundwood production presented above suggest that a significant increase in roundwood production will occur in Europe over the next 20 years. In order to examine the impact of these changes on the development of forest resources in Europe, the EFISCEN model was used to show how the projected level of fellings might affect forest resource parameters such as growing stock volume and NAI.
The EFISCEN model was used to examine two of the alternative scenarios described above, namely the baseline scenario and the integration scenario. These two scenarios result in the highest levels of projected fellings in Europe, so they are the two scenarios where the sustainability of future roundwood production might be constrained by the productive capacity of European forest resources. The conservation scenario results in a much lower level of projected fellings, which is very unlikely to exceed the potential availability of wood supplies.
Full details of the methodology used in the EFISCEN model are given in Schelhaas et al (in prep) and will not be repeated here. The following text presents the main findings of the forest resource analysis,22 followed by some comments about possible future developments that might occur in the management of forests.
Under the baseline scenario, trends in the FAWS area were extrapolated into the future. In most countries, this resulted in a slight expansion of FAWS area, presumably because the growth in total forest area will be larger than the area of forest transferred from avaialbale to unavailable for wood supply. For the Russian Federation it was assumed that the recent reported decline in FAWS area (see Section 2.1.2), which may be a classification problem, rather than a trend, would not continue into the future. For the integration scenario, the work of Thoroe et al (2004) suggested that a modest expansion in FAWS might be expected in the future (over and above the baseline scenario) and this increase was included in the projections. These projections of FAWS were checked with national correspondents and were, where necessary, adjusted on the basis of their expectations about the future. In most of the few cases where adjustments were suggested, this resulted in a slight reduction of FAWS in the future compared with the original assumptions.
Figure 131 Outlook for the area of forest available for wood supply (FAWS) under the baseline and integration scenarios
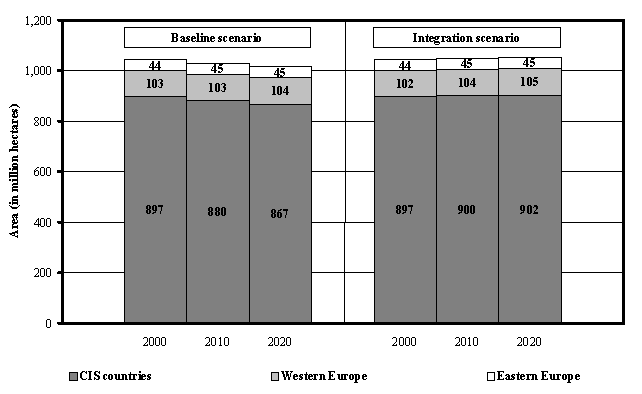
Source: derived from Schelhaas et al (in prep). Note: all of the countries included in the EFSOS are included in these figures except Bosnia and Herzegovina, where no statistics were available.
Figure 131 shows the outlook for FAWS area under the two alternative scenarios. Under the baseline scenario, it is expected that the total FAWS area in Europe will decline by about 28 million hectares. However, this decline is all due to the projected decrease of 30 million ha in the FAWS area in the CIS sub-region. In contrast to this, a very slight increase in the FAWS area is expected in the future in Western and Eastern Europe (and in the majority of countries included in these two sub-regions).
The EFISCEN model produced projections for the volume of growing stock on FAWS under each of the scenarios and these are shown in Figure 132 below. Under the baseline scenario, growing stock volume is projected to increase significantly, from 109 billion m3 o.b. in 2000 to 129 billion m3 o.b. in 2020. However, the majority of this increase will occur in the CIS sub-region (despite the expected decline in FAWS area). In Western and Eastern Europe, growing stock volume is expected to increase in both sub-regions throughout the period, but at a much lower rate of growth.
Figure 132 Outlook for the volume of growing stock on FAWS under the baseline and integration scenarios
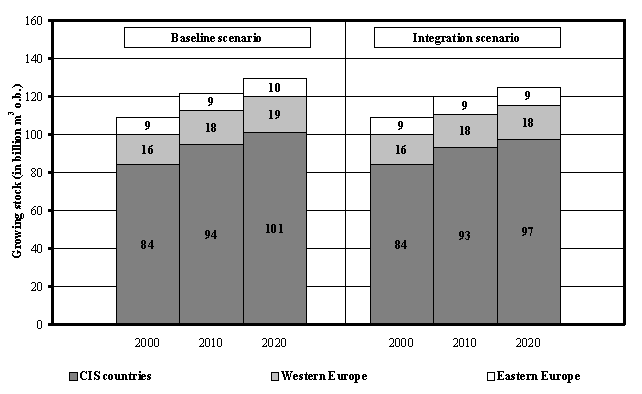
Source: derived from Schelhaas et al (in prep). Note: all of the countries included in the EFSOS are included in these figures except Bosnia and Herzegovina, where no statistics were available.
The volume of growing stock is also expected to increase under the integration scenario, but by about 15 percent less than under the baseline scenario. Under this scenario, the European growing stock volume is projected to increase to 125 billion m3 o.b. by 2020. Again, the CIS sub-region accounts for the majority of this increase. In Western Europe, growing stock volume is expected to increase slightly at first, but remain about the same over the period 2010 to 2020. In Eastern Europe, very little increase in the growing stock volume is projected for the whole period 2000 to 2020 under this scenario. This reduction in the projected increase in growing stock volume is due to the fact that the level of fellings will approach the level of increment in these two sub-regions under this scenario (see below).
Figure 133 Outlook for the volume of growing stock per hectare on FAWS under the baseline and integration scenarios
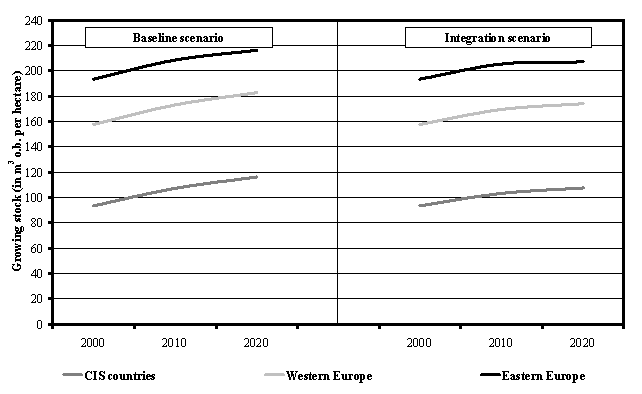
Source: derived from Schelhaas et al (in prep). Note: all of the countries included in the EFSOS are included in these figures except Bosnia and Herzegovina, where no statistics were available.
Figure 133 presents this information in a slightly different way, showing the projected level of growing stock per hectare in each of the three sub-regions under the two alternative scenarios. This shows that growing stock volume per hectare will continue to increase under the baseline scenario. Under the integration scenario, the increase in growing stock per hectare will slow down over the next 20 years. In particular, in Eastern Europe, it will level-off by 2020 at a level of around 210 m3 per hectare.
The outlook for total annual increment (i.e. NAI) of FAWS is shown in Figure 134 and the corresponding figures for NAI per hectare are shown in
Figure 135. These show that total annual increment is expected to fall over the ten years 2000 to 2010, then remain about the same under the baseline scenario or increase slightly under the integration scenario. Again, almost all of the projected changes occur in the CIS sub-region, which accounts for the majority of increment in European forests due to the size of the forest resource there. In Western and Eastern Europe, the projected levels of fellings will have little impact on total annual increment, although the historical trend towards an increase in annual increment in these sub-regions (particularly in Western Europe - see Figure 7 on page 19) will be halted.
The projections of annual increment per hectare present a slightly different picture, with a slight decline in annual increment projected for Western and Eastern Europe and very little change projected for the CIS sub-region. Furthermore, there is very little difference between the two alternative scenarios. The reasons behind these changes are complex and are related to the age-class structure of European forests.
Figure 134 Outlook for NAI on FAWS under the baseline and integration scenarios
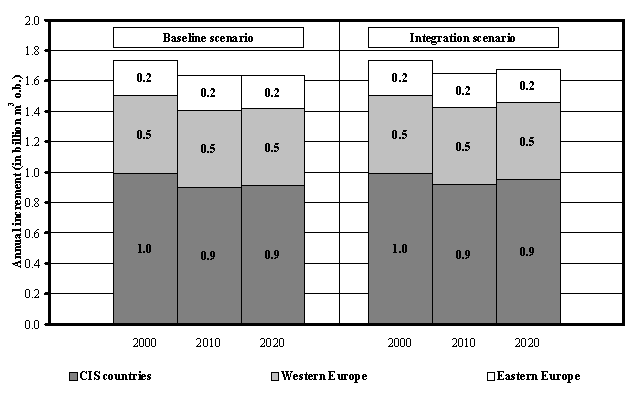
Source: derived from Schelhaas et al (in prep). Note: all of the countries included in the EFSOS are included in these figures except Bosnia and Herzegovina, where no statistics were available.
Figure 135 Outlook for NAI per ha on FAWS under the baseline and integration scenarios
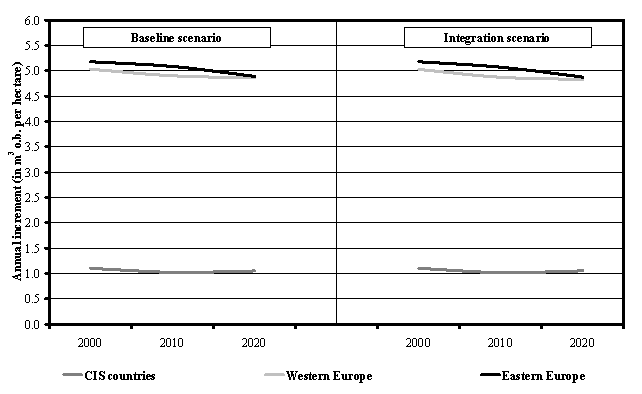
Source: derived from Schelhaas et al (in prep). Note: all of the countries included in the EFSOS are included in these figures except Bosnia and Herzegovina, where no statistics were available.
The outlook for the ratio of fellings to increment is presented in Figure 136 below. As before, the projections for fellings used to construct this figure have been calculated by taking the projections for industrial roundwood production and woodfuel consumption and multiplying these total roundwood removals by a factor derived from the FRA 2000 (UN, 2000).
Figure 136 Outlook for the ratio of fellings to increment on FAWS under the baseline and integration scenarios
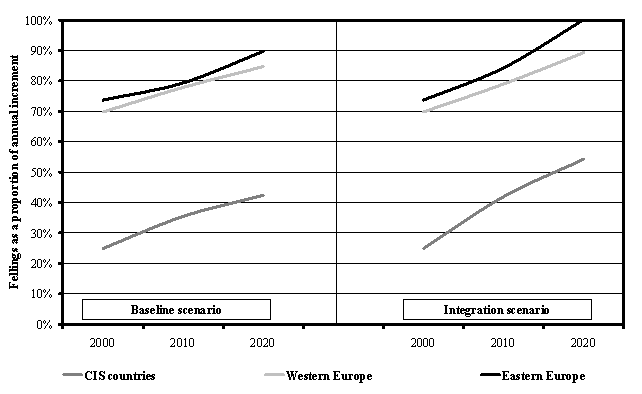
Source: derived from Schelhaas et al (in prep). Note: all of the countries included in the EFSOS are included in these figures except Bosnia and Herzegovina, where no statistics were available.
The figure shows that the ratio of fellings to increment is expected to increase significantly over the next 20 years in all sub-regions and under both scenarios. This would represent a reverse in the historical trends in this variable, which has tended to decline over most of the last 40 years in Europe.
Under the baseline scenario, the ratio remains under 100 percent in all three subregions and in most European countries. Under the integration scenario, the higher projected level of fellings pushes the ratio to 100 percent in Eastern Europe by 2020. The countries where the ratio is higher than 100 percent are mostly the same in both scenarios and the industrial roundwood supply projections assume that fellings will not increase in the future in these countries. Thus, the higher ratio for Eastern Europe under the integration scenario is largely due to a number of other countries approaching a fellings to increment ratio of 100 percent by 2020.
At first sight, the projections in Figure 136 suggest that a number of countries in Eastern Europe may be harvesting at a level that is above the sustained yield (or will do so in the near future). However, these projections must be interpreted with some caution. Firstly, the projections of fellings include woodfuel consumption, which may be harvested from a variety of sources outside FAWS and would probably include non-stem biomass that is not included in the annual increment figures. Furthermore, it may be incorrect to apply the removals to fellings conversion figures to this component of roundwood production. Secondly, the annual increment figure is only for FAWS and it is possible that some industrial roundwood is harvested from other areas not included in the calculations of projected annual increment. Finally, as noted above, annual increment depends on a range of complex factors related to the age-class structure of forests, site productivity and the felling regimes used in countries. Thus, it is possible for increment to start to increase again after a period of harvesting at a level above the annual increment (the “allowable cut effect”, where old slow-growing forests are harvested and replaced by younger more vigorous stands). The currently available tools and statistics are not adequate for a detailed investigation of the complex dynamics of forest growth at the European level, but these results suggest that this is an area where further research might be useful, particularly in some countries in Eastern Europe.
Forest management is one area where individuals working in the sector have a lot of control or influence over the future and a discussion of the merits of different courses of action will be presented in the conclusions to this study. However, there are certain aspects of forest management that are determined largely by events outside the sector and these will be discussed here below.
Expansion of forest management objectives. The first trend that is likely to continue into the future is that the demands placed on forests will continue to expand in scope. In response to this, it is also likely that the objectives of forest management will continue to change and expand.
It is now quite well understood by the public that forests produce a wide range of market and non-market products and services. As accessibility to the countryside increases with expanding incomes and leisure time, it can be expected that the public will place ever greater demands on forests for the production of non-market services such as recreation, landscape and conservation.
This projection that the demand for goods and services will expand in scope can not be quantified, nor can it be projected with any degree of accuracy. However, there is a significant amount of partial and anecdotal evidence at the country level that this trend will continue into the future.
Public support for forest management. In support of the above trend, there is also likely to be continued public support for the forest sector, based on the genally positive views the public has of forests and foresters, and with higher priority given to non-wood functions and objectives, widely believed to be forests’ main contribution to the general welfare (Rametsteiner and Kraxner, 2003). However, given the continual desire to increase the efficiency of government an unavoidable limits on public spending, it can be expected that these incentives will be increasingly targeted to meet specific objectives or to produce specific outputs. It already seems quite likely that incentives are increasing in importance relative to the demands of the forest processing sector. In the future it can be expected that forest management may be driven more by the requirements necessary to obtain such subsidies and less by the need to produce roundwood for the industry.
Continued strong public interest of the sector. It was already noted in Section 2.2.2 that public participation in forestry policy making is increasing. This is due to a number of factors such as greater accessibility to the countryside (noted above), changing social values and the greater ease of communication between stakeholders and government (e.g. by e-mail and the internet). It is also a natural response to the increase in public support for the sector noted above, as well as realisation that conflicts concerning forest use are of political/value nature, not purely technical.
This trend is likely to lead to increased public scrutiny of the sector and may also lead to expectations of higher standards in the quality of forest management. In addition, it increases the risk that the reputation of the sector can be harmed by the actions of a few or by the misdirection of public opinion. The result of this could be increased public pressure to manage forests in a certain way, which may not always be technically valid or economically feasible. Increasingly, it will be the role of forest sector professionals to structure these public discussions about priorities, and to inform participants of the technical and economic consequences of the various options, rather than being the ultimate decision makers.
Management capability. Forest privatisation and restitution has led to a huge increase in the number of small forest owners across much of Europe in recent years. In addition to this, public subsidies have encouraged many farmers to plant forests and this trend is likely to continue in the near-term. The capacity of these new forest owners to manage their forests is unknown. However, it would seem likely that a large proportion of them are probably lacking in financial and technical capability, particularly in light of the new demands being placed on the sector. The same applies to the millions of “old” private forest owners in western Europe who are increasingly unable to manage their forests in a rational way and to handle the complex and public dilemmas associated with forest management in the twenty-first century. Many countries have maintained or reinforced systems of extension services, cooperatives etc. to provide support and guidance to these owners, without encroaching on their property rights. These problems are more urgent and severe in the countries which have recently restituted significant forest areas.
The projections for forest management described above do not apply to all forest managers in all countries. However, they do give an indication of some of the challenges for forest management in the future that probably apply to many different forest owners. The business of forest management is becoming more complicated and will probably require a wider range of skills in the future. At the same time, many more people are now forest managers. How the sector responds to these challenges will influence public opinion and could affect the outlook for forest products markets.
18 In addition, due to the limitations of data, Kangas and Baudin (2003) did not include Bosnia and Herzegovina in their analysis. It has been assumed here that the markets in this country will expand at the same rate as the average for the other countries in the former Yugoslavia.
19 The analysis in these two paragraphs only applies to wood pulp used for paper production - i.e. mechanical, semi-chemical and chemical wood pulp. Production and consumption of dissolving pulp is insignificant and was simply assumed to continue at the same level in the future as in the past. Other fibre pulp is also negligible and was excluded from the analysis.
20 In international trade, these materials are divided into two categories: “wood chips and particles” and “wood residues”. For brevity, the term “wood residues” is used here to imply both types of material.
21 For other industrial roundwood, projections of future production were based simply on an extrapolation of historical trends. In most countries, this resulted in a slight decline in production over the next two decades.
22 It should be noted that the projections of fellings used in the EFISCEN analysis were preliminary estimates and differed from those presented here. However, the differences between those projections and the final projections are relatively small at the sub-regional level, so the major conclusions of the EFISCEN analysis would not be affected significantly by these changes. It should also be noted that Schelhaas et al (in prep) only refer to the European part of the Russian Federation, whereas the results presented here include the whole of the Russian Federation (and are derived from the EFISCEN results).