![]()
![]()
![]()
It was noted in Section 2 that the majority of the lacustrine water resources in Asia are man-made lakes or reservoirs, and that there are relatively few natural lakes. In this section, stock-enhanced fisheries in large lakes and reservoirs in the region are considered. This will be dealt with on a by-country basis, followed by an evaluation of the general issues pertaining to stock-enhanced fisheries in large lacustrine waters in the region. "Large lacustrine waters" refers to lacustrine waterbodies that have a surface area larger than 1 000 ha. While this is a subjective classification, in can be generalized that smaller waterbodies tend to have some form of ownership or rights attached to their fisheries. In contrast, large lacustrine waterbodies in Asia are typically open access. This basic difference has a strong influence on the sort of strategy that can be used to enhance fish yields, and the overall yield that can be expected. Also, there is a significant difference in how revenue is generated and the type of fishers that utilize the resource.
Bangladesh has no natural lakes and only one reservoir - Kaptai Lake (58 300 ha), impounded primarily for hydroelectricity generation in 1961. The fishery has developed since about 1965, and yields ranging from 55 to 113 kg/ha/yr with a mean of 80.0±17.3 kg/ha/yr for the period 1986 -1999 having been reported (Halder et al. 2002). This reservoir has witnessed many changes in the commercial landings over the last four decades. Currently, a small pelagic clupeid, the Ganges River sprat (Corica soborna), dominates the fishery, accounting for about 60 percent of the landings (Ahmed et al. 2001).
The reservoir was stocked with Indian major carps immediately after impoundment, and thereafter at regular intervals. Stocking of Indian major carps has intensified since about 1985 (Halder et al. 2002). Between 1981 and 1985, 1.6 million fingerlings of common carp (686 550), silver carp (914 142) and grass carp (7 216) were stocked with a view to filling vacant food niches (Halder et al. 2002). Although, in the initial years following impoundment, the Indian major carps accounted for 50 to 80 percent of the landings, the contribution of stocked fish to the fishery has been less than 5 percent over the past three decades. Ahmed et al. (2001) reported a negative correlation between the amount stocked and the amount caught, and that this correlation increased further when the moving average for stocked fish was used. These authors suggested that stocking of major carps in Kaptai Lake has been both unproductive and uneconomical. The above observations also conform to the findings of Halder et al. (2002). The former authors attempted to evaluate the reasons for the lack of apparent positive impact of stocking on fish yield, among which were:
indiscriminate fishing and over fishing resulting in stocked fingerlings being. shed early;
the inability of the stocked species to establish breeding populations in the reservoir; and
a general deterioration of the reservoir habitats through siltation etc.
The experience from Kaptai Lake favours the contention that stock enhancement of large lacustrine waters based on species that are unlikely to establish breeding populations and thereby contribute to yearly self-recruitment is unlikely to be viable or economical. Major carps, both Chinese and Indian, need very specific riverine conditions to breed. These conditions are highly unlikely to be encountered in lacustrine waters, except in one or two very rare instances (see Section 6.6.2). The general consequences of this biological trait of Chinese carps and its impact on stock enhancement in lacustrine waters will be dealt with in Section 6.6.2.
India has vast areas of lacustrine waters, the great bulk of which are man-made except for a few natural lakes in the high elevations in the north. The latter are of marginal importance from the viewpoint of foodfish production, being used primarily for recreational fisheries for exotic salmonids and indigenous Tor spp. On the other hand, the vast hectarage of reservoirs in India constitutes the main lacustrine resources utilized for foodfish production.
In India, reservoirs are classified as small (0-1 000 ha), medium (1 001-5 000 ha) or large (>5 000 ha). The estimated hectarage of each type is 1 484 557 (n = 19 134), 527 541 (n = 180) and 1 140 268 (n = 56), respectively (Sugunan 1995). The distribution of Indian reservoirs varies greatly between states. The largest number and hectarage of small reservoirs occurs in the southern state of Tamil Nadu, whereas the greatest area of large reservoirs is in the southeastern state of Andhra Pradesh. In this section, only the stock enhancement fisheries of medium and large-sized reservoirs will be considered, and that of small reservoirs will be dealt with in Section 8.
Inland fisheries in India contribute about 27% of the availability of freshwater fish in the country (Figure 6). The inland capture fisheries in India contribute about 13 percent to the total Asian inland capture fishery (Figure 8), and are thus a significant contributor to Asian inland fisheries. On the other hand, the inland fishery in India contributes about 21 percent to the country’s overall fish landings from capture fisheries (Figure 9). More importantly, the contribution of inland fisheries to total landings has been increasing over the years, albeit slowly. The yield from inland capture fisheries has nearly doubled in the between 1992 and 2003 (from 373 287 to 777 273 tonnes). This increase in production has occurred despite the virtual collapse of some fisheries, such as those based on diadromous species such hilsa (Tenulosa spp.). The collapse of the hilsa fisheries is considered to be due to the damming of major rivers and general habitat degradation. It is also generally agreed that most riverine fisheries (e.g. those for Indian major carps) have declined considerably over the last two decades. Although, based on currently available data, it is impossible to separate accurately the contribution of the different habitats or waters to inland fisheries production, a conservative estimate is that the country’s lacustrine waters, primarily the reservoirs, contribute in excess of 30 percent of this total.
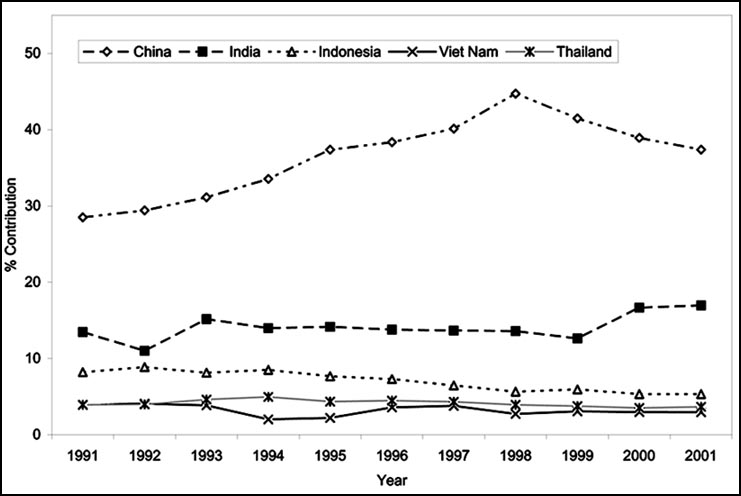
Figure 8. The percent yearly contribution of inland capture fishery of selected countries (PR China, India, Indonesia and Viet Nam) to the total Asian capture fishery production between 1991 to 2001 (based on FAO Statistics, 2003)
Figure 9. The overall capture fishery and inland capture fishery production between 1991 to 2001, in India, and the percent contribution of the inland capture fishery yield to the latter
Sugunan (1995) recognized the deficiency in data collation on
catches and related effort in reservoir
fisheries in India and suggested that
this is the weakest link in the database on reservoirs in India. The
difficulties on data collation for reservoir fisheries, according to Sugunan
(1995), were primarily due to:
the multiplicity of agencies owning fishing rights that pose difficulties for state agencies to gather data;
highly scattered and unorganized market channels, which are mostly controlled by illegal money lenders who are reluctant to provide information to state authorities;
ineffective fisher cooperative arrangements;
the diverse licensing/royalty/crop sharing systems practiced by different state governments, which provide little scope for catch data gathering; and
inadequate and poorly trained manpower that is incapable of following statistically valid sampling procedures.
It has been pointed out on many occasions that the estimated fish production in medium and large reservoirs in India is generally far below the average production observed elsewhere in Asia in comparative climatic regimes (De Silva 2000). For example, the annual mean fish production in medium and large-sized reservoirs was 12.3 and 11.4 kg/ha/yr, respectively (Table 13) (Sugunan 1995). The complexity of the problem is evident when one considers the productivity of some large reservoirs. The fish yield in the large Tungabhadra Reservoir (37 418 ha), impounded in 1953, was estimated to range from 91 to 185 kg/ha/yr (mean of 136) in the period 1980-1987 (Singit et al. 1988), which was far above the national average. Although this reservoir is an exception, it is certainly indicative of the potential that could be achieved.
Table 13. Fish production in selected reservoirs in India (modified from Sugunan 1995)
| State |
Medium-sized reservoirs |
Large reservoirs |
||||
|
Number |
Production (tonnes) |
Yield (kg/ha/yr) |
Number |
Production (tonnes) |
Yield (kg/ha/yr) |
|
|
Tamil Nadu |
8 |
269 |
13.7 |
2 |
294 |
12.7 |
|
Uttar Pradesh |
13 |
156 |
7.2 |
1 |
50 |
1.1 |
|
Andhra Pradesh |
29 |
1 306 |
22.0 |
3 |
800 |
16.8 |
|
Maharashtra |
12 |
314 |
11.8 |
4 |
794 |
9.3 |
|
Rajasthan |
17 |
600 |
24.5 |
2 |
120 |
5.3 |
|
Kerala |
2 |
17 |
4.8 |
- |
- |
- |
|
Bihar |
3 |
7 |
1.9 |
1 |
0.8 |
0.1 |
|
Madya Pradesh |
20 |
625 |
12.0 |
3 |
1 184 |
14.5 |
|
Himachal Pradesh |
- |
- |
- |
2 |
1 453 |
35.6 |
|
Orissa |
6 |
163 |
12.8 |
3 |
925 |
7.6 |
The current low levels of fish production have been attributed to ineffective management and poor enforcement of regulatory measures. Despite this, the enhancement of stocks in medium and large reservoirs is one of the strategies adopted to increase fish production for these reservoirs and has been practiced for a considerable length of time.
The major species assemblages of the reservoir fisheries in India are categorized as follows:
the Indian major carps (e.g. Labeo rohita, Catla catla, Cirrhinus cirrhosus);
the mahseers (e.g. Tor spp.);
the minor carps (e.g. Puntius spp.);
large cat fishes (e.g. Pangasius hypophthalmus);
featherbacks (e.g. Notopterus spp.);
air-breathing catfishes (e.g. Heteropneustes fossilis);
murrels or snakeheads (e.g. Channa spp.);
weed fishes (generally of low commercial value, e.g. Ambassis spp.); and
exotic species (e.g. Oreochromis spp., Chinese major carps).
Almost all stock enhancement strategies in Indian reservoirs have been based upon the Indian major carps or the major Indo-Gangetic carps, viz. Labeo rohita, L. calbasu, L.. mbriatus, Cirrhinus cirrhosus and Catla catla. Occasionally these species have been supplemented with minor carps such as L. bata, Barbodes sarana etc. and cat fish species.
Although isolated stock enhancement practices in Indian reservoirs have often been cited in the literature, regrettably, no concerted attempt has been made to evaluate critically the impact of these practices. Indeed, the present authors were unable to find any information on cost-benefit effects for any of the stocking practices with reference to even a single reservoir in India. For this review, an attempt is made to determine the effectiveness of stocking in a group of reservoirs for which data were available for more than five years (Table 14), using the published data of Sugunan (1995).
Table 14. Stocking and yield data on selected reservoirs in India. The statistical relationships indicate the relationship between the numbers stocked per ha (x) and the yield in kg per ha (y) in year of stocking and a year +1 after stocking (correlation coefficient = R2). Those relationships that are significant are shown in bold
|
Reservoir, state (size in ha) |
Years of data |
Mean SD (no/ha) |
Mean yield (kg/ha) |
|
Relationship between: numbers stocked/ha (x) and yield in kg/ha (y) |
R2 |
Species stocked |
|
Aliyar, Tamil Nadu (650 ha) |
1985-90 |
352.8 |
126 |
Yr 0 |
y = -0.0663x + 133.28 |
0.095 |
Cyprinus carpio, Cirrhinuscirrhosus, |
| |
|
|
Yr +1 |
y = 0.0928x + 54.458 |
0.985 |
cirrhosus, Catla catla, Labeo rohita, |
|
| |
|
|
|
|
|
Hypophthalmichthys molitrix |
|
|
Malampuzha, Kerala (2 213 ha) |
1981-92 |
203.0 |
5.3 |
Yr 0 |
y = -0.0023x + 5.7228 |
0.146 |
not available |
| |
|
|
Yr +1 |
y = 2E-05x + 5.4082 |
0.000 |
|
|
|
Meenkara, Kerala (259 ha) |
1966-92 |
393.7 |
39.5 |
Yr 0 |
y = 0.0613x + 15.406 |
0.551 |
not available |
| |
|
|
Yr +1 |
y = 0.0629x + 5.6874 |
0.841 |
|
|
|
Peechi, Kerala (1 263 ha) |
1985-92 |
344.2 |
11.4 |
Yr 0 |
y = -0.0035x + 12.622 |
0.152 |
not available |
| |
|
|
Yr +1 |
y = -0.0028x + 11.951 |
0.106 |
|
|
|
Chulliar, Kerala (159 ha) |
1983-92 |
802.2 |
123.6 |
Yr 0 |
y = 0.0791x + 60.134 |
0.22 |
not available |
| |
|
|
Yr +1 |
y = 5E-05x + 93.129 |
0.000 |
|
|
|
Nagarjunasagar, Andhra Pradesh (28 474 ha) |
1971-79 |
11.6 |
4.0 |
Yr 0 |
y = 0.079x + 3.1194 |
0.203 |
C. carpio, C. cirrhosus, C. catla, |
| |
|
|
Yr +1 |
y = -0.0074x + 4.1257 |
0.002 |
L. rohita |
|
|
Gandhisagar, Mathar Pradesh (66 000 ha) |
1962-75 |
5.1 |
0.004 |
Yr 0 |
y = -1E-05x + 266.96 |
0.000 |
C. carpio, C. cirrhosus, C. catla, |
| |
|
|
Yr +1 |
y = 0.0003x + 164.81 |
0.095 |
L. rohita |
|
|
Vallabhasagar, Gujarat (52 000 ha) |
1975-80; |
50.8 |
43.7 |
Yr 0 |
y = 6.7935x - 17.25 |
0.824 |
not available |
|
1983-89 |
|
|
Yr +1 |
y = 5.5113x - 12.121 |
0.823 |
|
|
|
Getalsud, Bihar (3 459 ha) |
1976-81 |
177.6 |
1 096 |
Yr 0 |
y = -0.3654x + 1 161.2 |
0.002 |
Indian Major & minor carps |
| |
|
|
Yr +1 |
y = -5.8396x + 1 932.8 |
0.487 |
|
|
|
Gumti, North East (4 500 ha) |
1978-93 |
245.1 |
31.5 |
Yr 0 |
y = -0.0211x + 36.659 |
0.091 |
|
| |
|
|
Yr +1 |
y = -0.0133x + 36.961 |
0.043 |
not available |
The results of the analysis are somewhat confusing and not uniform. For example, in the instances where the relationship between stocking density and yield was significant, there were cases in which the relationship was negative (Getalsud Reservoir). The most promising was the results of stock enhancement in Vallabhasagar Reservoir in Gujarat, where the yield was highly correlated to stocking density in a year one (n) as well as year n+1. This is particularly encouraging, because this reservoir is one of the largest in the region; however, the reasons for the apparent success of the stock enhancement programme are not clear. In none of the reservoirs was the correlation valid in years n+2 onwards, indicating that in all probability, the effects of stock enhancements are not evident two years after stocking. The inconclusivity of the analysis of this limited data set highlights the fact that the evaluation of the impact of stocking practices in Indian reservoirs is an area that warrants further study. This may also allow a more rational and cost-effective stocking programme.
Inland fisheries in Indonesia provide approximately 1.6 kg/caput/yr to the fish availability in the country, which approximates about 33 percent of the availability from the total fish production in inland waters (Figure 6). The inland capture fisheries in Indonesia contribute about 6 percent to the total Asian inland capture fishery (Figure 8). On the other hand, the inland fishery in Indonesia contributes about 7 percent to the overall fish landings from capture fisheries in the country (Figure 10). The inland capture fishery in Indonesia increased only marginally over the last ten years, particularly in comparison with the increase in overall landings from capture fisheries (287 183 tonnes in 1991 versus 306 560 tonnes in 2001, as compared to 2 818 538 tonnes versus 4 247 591 tonnes for capture fisheries over the same period).
Figure 10. Total capture fishery and inland capture fishery production in Indonesia and the percentage contribution of the latter to the total (based on FAO statistics 2003)
A summary of the stock enhancement practices in Indonesia is given in Table 6, and it is evident that here also, only those species that have the ability to establish spawning populations have had an impact on the fisheries. As with other countries in the region, no information is available on the cost of stocking or the cost-benefits of the stock enhancement practices adopted.
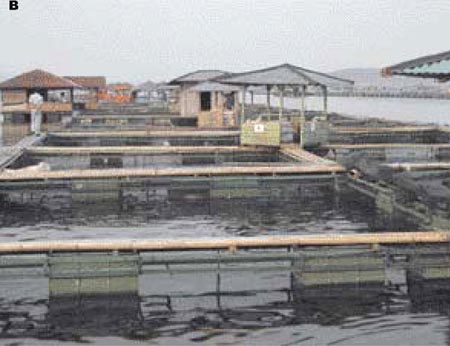
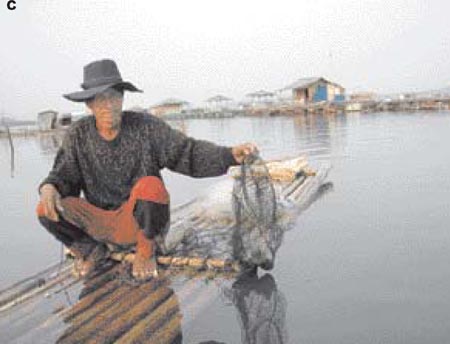
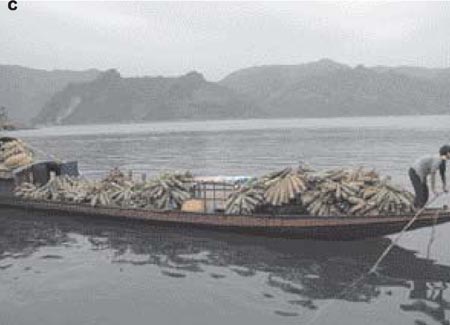
In contrast to stock enhancement in reservoirs, cage-based aquaculture has been promoted in relatively recently impounded large reservoirs, such as Jatiluhur (1967, 8 300 ha), Saguling (1985, 5 607 ha) and Cirata (1987, 6 210 ha) of the Citarum watershed in west Java. Cage culture was encouraged as an alternative means of livelihood for displaced persons. Cage culture activities were initially subsidized, and as result of good returns (at least in the initial phase), these activities expanded and intensified to "industrial" proportions (Plate 13). This tended to occur without proper planning or consideration for environmental aspects such as carrying capacity. Consequently, there have been regular fish kills that have not only resulted in cagefish mortalities, but also in mortalities in the naturally occurring stocks, upon which a large number of artisanal fishers are dependent for their livelihoods. These artisanal fishers have to find alternative livelihoods following fish kills until the natural stocks recover, which results in conflicts between the two groups of resource users.
Although these reservoirs were initially stocked with Nile tilapia and common carp, there was no regular programme of stock enhancement. It is thought that escapees from netcages and the natural recruitment of the two species are sufficient to sustain the artisanal fishery, albeit at a relatively low level.
|
Plate 13. (A) The "industrial sacle" cage culture activities in Cirata reservoir, and (B) an artisanal fisher with his catch |
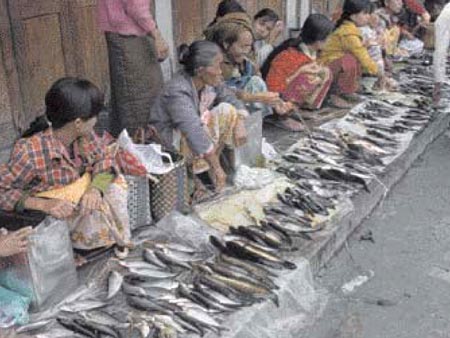
In addition to its vast riverine and floodplain resources, Myanmar has significant lacustrine water resources. These include a number of natural lakes, most notably lakes Logotok, Inle, Er Hai and Indawgyi, and a large number of reservoirs, amounting to a total area of approximately 115 867 ha. Although artisanal fisheries exist in the lakes and contribute significantly to the foodfish supplies (Plate 14) of the nearby townships and villages, there have been no attempts at their stock enhancement. A recent government policy resulted in a ban on fishing in reservoirs, although the basis for this decision does not appear to have a scientific or fisheries justification.
|
Plate 14. A weekly fish market in a twonship on Inle Lake shores which deals almost exclusivley with catches from the lake, estimated to yield about 500 mt of fish per year |
Inland fisheries in PR China provide approximately 2.0 kg/caput/yr to the fish availability in the country, which equals about 14 percent of the availability from the total fish production in inland waters (Figure 6). The inland capture fisheries in PR China contribute about 30 percent to the total Asian inland capture fishery (Figure 8), but in PR China, the inland capture fisheries contribute only about 10 percent to the overall fish landings from capture fisheries in the country (Figure 11). The inland capture fishery in PR China more than doubled over the last ten years, as did the overall landings from capture fisheries (998 961 tonnes in 1991 versus 2 149 932 tonnes in 2001, as compared to 7 674 809 tonnes versus 16 971 730 tonnes for overall landings from capture fisheries over the same period).
Apart from its seven major river systems (Changjiang, Huanghe, Huaihe, Hai-luan, Zhujiang, Songhuajiang and Liaohe), PR China also has a large resource of inland, lacustrine waters. These include natural lakes (e.g. Tahiu) and a large number of reservoirs (about 86 000), built since the 1950s (Table 15). In PR China, unlike anywhere else in the world, fisheries activities were taken into consideration during reservoir planning and construction. The result of this planning is that fishery management bureaus are established for each of the medium and large reservoirs, and for most other reservoirs (De Silva et al. 1991). In addition, fishery activities are coordinated with other downstream activities and water management, thereby generating a high degree of synergy that is beneficial to all stakeholders and reduces conflicts over the management of reservoir water.
Figure 11. Total capture fishery and inland capture fishery production in PR China and the percentage contribution of the latter to the total (based on FAO statistics 2003)
Table 15. The reservoir resources of PR China (modified from Huang et al. 2001)
|
Reservoir size |
Number |
Storage (x 106 m3) |
Percent |
|
Large (>677 ha) |
326 |
2 975 |
72.0 |
|
Medium (66-677 ha) |
2 298 |
605 |
14.7 |
|
Small - 1 (<67 ha) |
14 108 |
366 |
8.9 |
|
Small - 2 |
70 120 |
184 |
4.4 |
One of the earliest analyses of stocking and related yields in Chinese reservoirs was conducted De Silva et al. (1992). In this analysis, the authors attempted to develop relationships of stocking rates to yields etc. from the aggregated results for reservoirs of all sizes in three different regions (Table 16). It is evident that the fish yields were related to both stocking rates and the reservoir area. Consequently, the authors developed multiple regressions incorporating these two independent variables to fish yield, for the three groups of reservoirs (Table 17).
Although the above analysis remains the only detailed study each area makes it that much harder to determine its more general application. This is particularly so because the fishery management practices in Chinese reservoirs have changed significantly over the last decade. Among the major changes adopted (Li and Xu 1995), particularly in respect of small reservoirs, are:
more controlled stocking in relation to selected limnological features of the smaller waterbodies;
use of a standard-sized fingerlings (12.7 to 13.5 cm); and
use of different species combinations to match the limnological features.
These modified management measures will be covered later in the section on culture-based fisheries (Section 8).
Table 16. Statistical relationships between stocking rates, area and yield (SRn and SRw refer to stocking rate in numbers and in kg/ha, respectively; A= area in ha; Y= yield in kg/ha/yr; modified after De Silva et al. 1992)
|
Relationship(s) |
n |
r |
p< |
|
Guandon Province: |
|||
|
Y = 661.84 A-0.468 |
64 |
-0.48 |
0.05 |
|
Y = -17.63 + 0.084 SRn - (7.32 x 10 - 16 SRn2) |
64 |
0.68 |
0.01 |
|
Y = 0.14 SRn- 88.44 |
|
0.83 |
0.01 |
|
Jianling County & Hubei Province: |
|||
|
Y = 213.89 (A/D)-0389 |
14 |
0.57 |
0.05 |
|
Y = 35.42 + 2.71 SRw |
11 |
0.86 |
0.01 |
|
Reservoirs from other provinces (4): |
|||
|
Y = 5 220.4 A-0.653 |
6 |
0.79 |
0.01 |
|
Y = 20.14 + 0.039 SRn |
6 |
0.94 |
0.01 |
Sri Lanka has no natural lakes, and its inland fishery is dependent on the multitude of reservoirs that are scattered throughout the dry zone - the region that receives <187 mm of annual rainfall. Sri Lanka has one of the highest, if not the highest, densities of reservoirs in the world, estimated to be about 3 ha/km2 (De Silva 1988). However, the area of large reservoirs in which capture fisheries is prevalent is estimated to be about 136 590 ha, and includes major irrigation reservoirs, medium-scale irrigation reservoirs and hill country hydroelectric reservoirs.
Table 17. Multiple correlations depicting the fish yield to other independent variables, as given in Table 16, for the three groups of Chinese reservoirs (modified after De Silva et al. 1992)
|
Relationship(s) |
n |
r |
p< |
|
Group I: |
|
|
|
|
Y = -22.44 + 1.58x 10⁻³ (A) + 6.89 SRw |
56 |
0.76 |
0.01 |
|
Group 2: |
|
|
|
|
Y = 63.78 - 0.318 (A) + 2.21 SRw |
10 |
0.87 |
0.01 |
|
Group 3: |
|
|
|
|
Y = -9.86 + 0.021 (A) + 0.043 SRn |
7 |
0.94 |
0.01 |
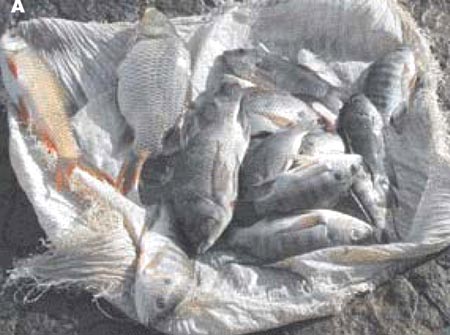
The inland fishery of Sri Lanka is based almost exclusively on reservoir capture fisheries. Current production is about 27 000 tonnes/yr and is still in recovery after a period of decline starting in the early 1990s resulting from the removal of governmental patronage (Amarasinghe and De Silva 1999). According to De Silva (1988), the inland fishery of Sri Lanka is characterized by three main features (Plate 15):
it is confined to large, medium and small reservoirs;
it involves the use of non-motorized fibreglass canoes (5 m) with an outrigger, operated by two fishers;
it is dominated by introduced exotics - Oreochromis mossambicus, which is gradually being replaced by O. niloticus, and is purported to have developed to present levels only as a result of the introduction of O. mossambicus in the early 1950s.
The fishery is essentially dependent on self-recruiting populations of the exotic cichlids O. mossambicus and O. niloticus (since the 1980s, the reservoirs have been "re-seeded" with the latter, due to its more desirable traits). These two exotics hybridize relatively easily, and the reservoir populations have varying amounts of the parental species and hybrids (De Silva and Ranasinghe 1989). Amarasinghe and De Silva (1996) have pointed out that such hybridization could also affect the fishery in the long term by reducing the reproductive capacity of the stocks.
Since the mid-1980s, there has also been a concerted attempt to stock selected reservoirs with Chinese and Indian major carps. The results of an experimental stocking in Giritale Reservoir, a medium-sized irrigation reservoir of 338 ha, are given in Table 18. In this example, the authors failed to consider the cost of production of fingerlings and consequently arrived at very high rate of return that would make a stocking a very viable proposition. In contrast, the data from the stocking of 17 reservoirs with Chinese and Indian major carps do not appear to be encouraging (Jayasekera 1989). These reservoirs ranged in size from 262 to 6 300 ha. A re-analysis of this data (Table 19) indicates that over a five-year period 6 241 580 fingerlings were stocked, but the resulting yield of stocked fish was only 420 tonnes out of a total yield of 17 634 tonnes, or a return of only 2.4 percent. Details on the performance of stocked fingerlings in some of the reservoirs are given in Table 20, and strongly indicate that enhancement of major Asian carps in Sri Lankan reservoirs is not a viable strategy. Among the species stocked, Labeo rohita, an Indian carp, yielded the best results.
Table 18. Details on stocking and returns of major carps in Giritale Reservoir (308 ha), Sri Lanka (modified from Chandrasoma and Wijeyaratne 1994)
|
Stocking |
Harvest |
% recapture |
Harvest per 100 stocked |
Rate of return (%) |
|||
|
Species |
Number |
Total (kg) |
Number |
Weight (kg) |
Value (Rs)1 |
||
|
Bighead carp |
365 000 |
89 300 |
71 440 |
19.6 |
24.5 |
244 |
482 |
|
Mrigal |
56 000 |
12 900 |
10 320 |
18.4 |
23.0 |
230 |
448 |
|
Rohu |
148 000 |
38 540 |
30 832 |
20.8 |
26.0 |
260 |
519 |
1 Rs = Sri Lankan rupees. 1 US$ = 49.00 rupees
Table 19. Summary on stocking and resulting yield of Chinese and Indian major carps in 17 Sri Lankan reservoirs ranging in size from 262 to 6 300 ha, between 1983 to 1987 (based on data from Jayasekera 1989)
|
Species |
Stocking (number) |
Total harvest (tonnes) |
|
|
Reservoirs |
Fingerlings |
||
|
Ctenopharyngodon idellus |
4 |
213 850 |
2.0 |
|
Aristichthys nobilis |
9 |
3 889 300 |
72.2 |
|
Hypophthalmichthys molitrix |
7 |
167 950 |
nil |
|
Catla catla |
3 |
80 150 |
2.3 |
|
Labeo rohita |
12 |
1 217 030 |
340.1 |
|
Cirrhinus cirrhosa |
10 |
668 300 |
3.3 |
|
Total |
|
6 241 580 |
419.9 |
Table 20. Data on the stock and recapture of Chinese and Indian major carps in a number of Sri Lankan reservoirs. Where relevant, the years are given in parentheses (based on data from Jayasekera 1989)
|
Reservoir/species |
Stocking |
Production |
Return (%) |
||
| |
Number |
Year |
Tonnes |
Year |
|
|
Udawalawe (3 374 ha) Total production - 532 tonnes (85/86) |
|||||
|
Ctenopharyngodon idellus |
54 000 |
(78/79) |
- |
|
|
|
157 000 |
(86)1 |
1.7 |
(85/86) |
0.3 |
|
|
Aristichthys nobilis |
147 300 |
(78/84/85) |
- |
|
- |
|
2 968 000 |
(86)1 |
- |
|
- |
|
|
Hypophthalmichthys molitrix |
13 400 |
(84/86) |
- |
|
- |
|
Catla catla |
8 400 |
(83/84) |
|
|
|
|
65 750 |
(86)2 |
|
|
|
|
|
Labeo rohita |
252 680 |
(83/86) |
35.1 |
(85/86) |
6.6 |
|
Cirrhina cirrhosus |
51 450 |
(84/86) |
- |
|
- |
|
23 400 |
(86)2 |
|
|
|
|
|
Bathalagoda (262 ha) Total production - 217 tonnes (83/86); 100 tonnes (83/86) |
|||||
|
C. idellus |
1 200 |
(85) |
0.3 |
(85/86) |
- |
|
A. nobilis |
1 700 |
(85) |
0.1 |
|
- |
|
H. molitrix |
2 750 |
(85/86) |
- |
|
- |
|
L. rohita |
19 300 |
(83/85/86) |
9.6 |
(83/86) |
9.6 |
|
C. cirrhosus |
7 150 |
(85/86) |
3.2 |
(85/86) |
3.2 |
|
Kandalama (780 ha) Total production - 727 tonnes (86); 248 tonnes (84/86); 299 tonnes (83/86) |
|||||
|
A. nobilis |
97 800 |
(85) |
5.7 |
|
4.4 |
|
L.rohita |
337 000 |
(83/85) |
106.5 |
|
42.9 |
|
C. cirrhosus |
171 000 |
(86) |
- |
|
- |
|
Parakrama Samudra (2 262 ha) Total production - 5 786 tonnes (78/86); 343 tonnes (86) |
|||||
|
C. idellus |
1 250 |
(86) |
- |
|
- |
|
A. nobilis |
55 500 |
(78/86) |
- |
|
- |
|
H. molitrix |
33 800 |
(78/86) |
- |
|
- |
|
L. rohita |
223 600 |
(86) |
4.6 |
|
- |
|
C. cirrhosus |
47 200 |
|
- |
|
- |
|
Minneriya (2 551 ha) Total production - 1 176 tonnes (86) |
|||||
|
C. cirrhosus |
135 000 |
(86) |
0.15 |
|
- |
|
Maduruoya (6 300 ha) Total production - 2 585 tonnes (83/87) |
|||||
|
A. nobilis |
131 000 |
(83) |
- |
|
- |
|
L. rohita |
64 000 |
(83/86) |
- |
|
- |
|
Giritale (2 262 ha) Total production - 194 tonnes (85/87) |
|||||
|
A. nobilis |
365 000 |
(84/87) |
62.4 |
|
32.1 |
|
H. molitrix |
25 000 |
(84) |
- |
|
- |
|
L. rohita |
148 000 |
(84/85/87) |
36.6 |
(85/87) |
18.8 |
|
C. cirrhosus |
2 000 |
(85) |
- |
|
- |
|
Tabbowa (500 ha) Total production - 2 856 tonnes (84/87) |
|||||
|
A. nobilis |
27 800 |
(82/87) |
- |
|
- |
|
H. molitrix |
5 000 |
(87) |
- |
|
- |
|
L. rohita |
30 800 |
(83/87) |
136.2 |
(84/87) |
4.8 |
|
C. cirrhosus |
18 180 |
|
- |
|
- |
|
Why was stocking of Sri Lankan reservoirs with Chinese and Indian carp not a successful strategy? A number of reasons have been suggested for the apparent failure of use of Asian major carps for stock enhancement in Sri Lankan reservoirs. Foremost among these are:
|
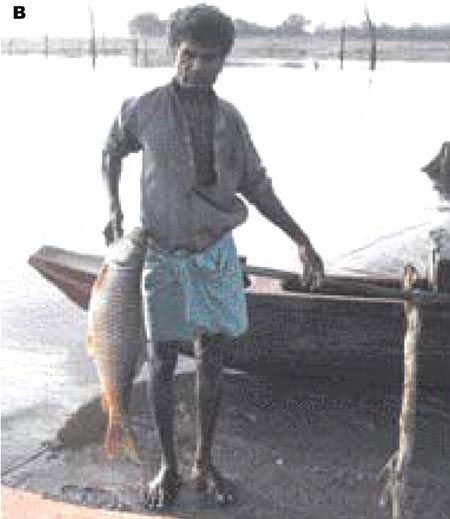
In some Sri Lankan reservoirs, notably Udawalawe Reservoir (2 386 ha), a reservoir located in the vicinity of an Asian major carp governmental hatchery, there are reports of the appearance of juvenile Catla catla in the artisanal fishery catches on a regular basis (see Plate 15). Similarly, there are reports that large-sized catla (>10 kg) occur in catches on a fairly regular basis in Mahaaluthgamara Wewa, a medium-sized reservoir (400 ha). Both these reservoirs were stocked with this species in the 1980s, but the latter only once in 1989. At this juncture, it is difficult to determine that if breeding populations of the species have established, either in the reservoirs or in the in fluent rivers, and this should certainly be investigated. If breeding populations of catla have established in Sri Lankan waters, this would be a very rare occurrence where an Indian major carp species has been able to reproduce naturally beyond its normal range of distribution.
Inland fisheries in Thailand provide about 3 kg/caput/yr to the fish availability in the country, equalling about 38 percent of the availability from the total fish production in inland waters (Figure 6). The inland capture fisheries in Thailand contribute about 5 percent to the total Asian inland capture fishery, and this has not changed significantly since 1991 (Figure 8). The inland fisheries in Thailand currently contribute about 7.3 percent to the country’s overall fish landings from capture fisheries (Figure 12). Fish yield from inland fisheries increased from 138 146 tonnes in 1991 to 209 977 tonnes in 2000, this increase accounting for nearly 27 percent of the increase in capture fisheries production in Thailand over the same period of time.
Thailand has three major natural lakes, Bung Borapet in the central plain (13 000 ha), Nong Harn in the northeast (12 500 ha) and Kawn Phyao in the north (2 100 ha), as well as the freshwater/brackishwater Songkhla Lake (96 000 ha) in the south (Pawaputanon 1992). The natural lakes have fisheries, and Songkhla Lake, in particular, has an extensive fresh and brackishwater fishery that has been studied fairly extensively. There have been few studies on the fisheries of the freshwater lakes. Thailand has about 316 690 ha of reservoirs (23) larger that 1 000 ha (Verdegem 1999), and a total of 1 745 reservoirs totalling 425 500 ha (Pawaputanon 1992). Bernacsek (1997) reports that Thailand has 28 reservoirs of over 1 000 ha, totalling 336 605 ha. Almost all of Thailand’s reservoirs have been impounded in the second half of the 20th century. Fisheries exist in all the reservoirs at varying degrees of intensity. These fisheries are almost entirely artisanal, and a diverse range of gear is used, depending on the nature of the reservoir.
|
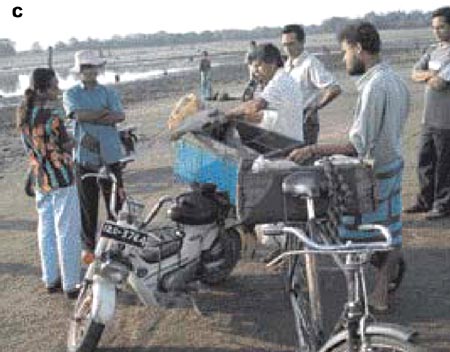
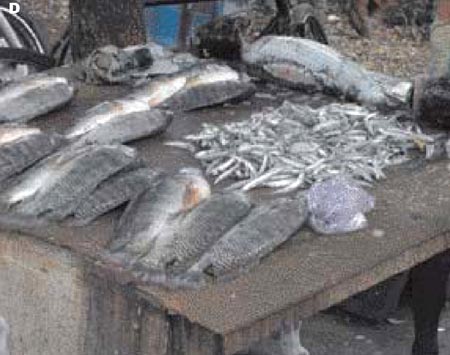
Plate 15. Features depicting some main cahracteristics of the inland fishery in large reservoirs in Sri Lanka (A) a common catch; note the predominance of exotic cichlids (B) A rare instance when a large stocked cyprinid (Catla catla) is caught (C) Vendors waiting for the fishers at a landing site and (D) a village vendor |
Figure 12. Total capture fishery and inland capture fishery production in Thailand and the percentage contribution of the latter to the total (based on FAO statistics 2003)
The inland fisheries in Thai reservoirs are very diverse, and individual fisheries may differ from each other with respect to:
overall fish yield;
predominant gears used;
dominant species in the catches;
impact of exotics and stocked species on the individual reservoir fisheries; and
utilization of the catches.
Over 150 fish species have been recorded in inland catches, but only about 20 of these are known to be economically important (Pawaputanon 1992). In recent years, there have been many accounts of the fisheries of individual reservoirs in Thailand (Plate 16), for example on Rajjaprabha (Chookajorn et al. 1999), Ubolratana (Pholprasith and Sirimongkonthaworn 1999) and Sirinthorn reservoirs (Jutagate et al. 2003). The mean fish yield from 11 reservoirs managed by the Electricity Generating Authority of Thailand ranged from approximately 7-52.2 kg/ha/yr for the years 1987 to 1998 (Table 21). This rather random selection of reservoirs, representative of the varied climatic regimes in the country, provides insight into a number of features of the reservoir fisheries in Thailand. The most significant and relatively obvious deductions that could be made are:
the wide range in yields between years in each of the reservoirs;
the apparent lack of correlation (generally expected to be negative) of fish productivity to reservoir surface area (for example, one of the highest mean yields was recorded for Ubolratana Reservoir, which is one of the largest in the country);
the general dominance of indigenous species: cyprinids, nandids, notopterids, bagrids, channids etc. in almost all the fisheries;
the fishery on clupeids (the Thai river sprat) being restricted only to a few reservoirs; and
the general lack of dominance and/or significant contribution of stocked/introduced species to the fisheries in most reservoirs (these species contributed significantly only in those reservoirs that were relatively small, most notably in Mae Chang (tilapia) and Nam Phung (tilapia and rohu).
Stock enhancement of inland waters, in particular, in reservoirs, has been carried out since the early 1950s, commencing with the stocking of Trichogaster pectoralis and Oreochromis mossambicus into natural swamps (Pawaputanon 1992). Subsequently, exotic species such as common carp, rohu, Nile tilapia and Chinese carps were used in the stocking programmes. According to Pawaputanon (1992), stocking programmes have shifted strategy over time to target indigenous species, either for improvement of fish yields in reservoirs, using species such as Barbonymus gonionotus (Java barb), or towards conservation or repopulation of economically important indigenous species such as Pangasius hypophthalmus, Pangasianodon gigas, Probarbus jullieni, Chitala chitala and Osphronemus gouramy. The authors estimate that nearly 100 million fingerlings of various fish species are stocked yearly in reservoirs; however, in the large reservoirs the return is probably less than one percent.
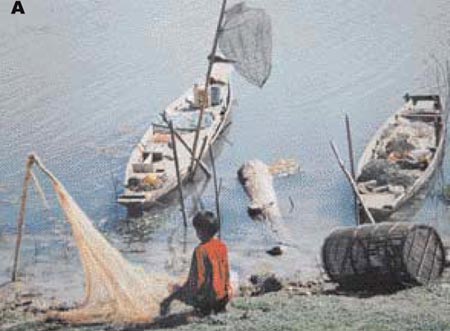
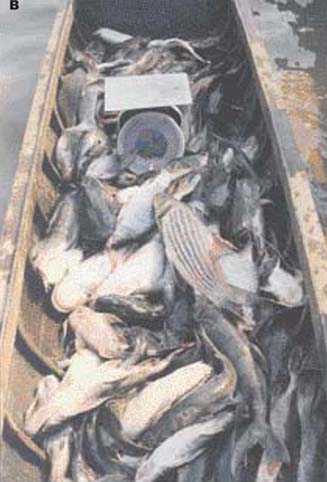
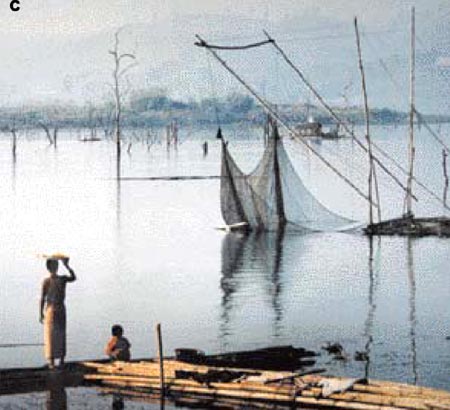
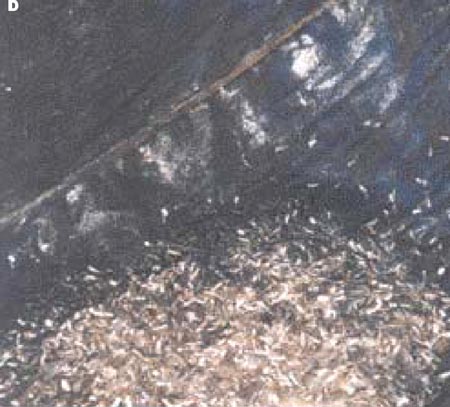
|
Plate 16. Some features of the reservoir fisheries in Thai reservoirs. (A) Typical gears and traps used in fisheries. (B) A typical catch showing the diversity. (C) A lift net for catching the Thai river sprat and (D) a haul of Thai river sprat. |
As noted for other countries in the region, a comprehensive analysis of stocking and returns and the cost-effectiveness of these programmes has not been carried out for Thai inland waters. Bhukaswan (1988) attempted to assess the effectiveness of cyprinid stocking in large inland waterbodies in Thailand. He concluded that over a ten-year period 42 232 700 cyprinids/yr (approximately 61.4 percent of all fish stocked), costing 2.96 million Baht/Yr (US$ 1 = 25 Baht), were stocked into large inland waterbodies. Although indigenous and exotic cyprinids (principally Labeo rohita and Cyprinus carpio) accounted for about 25 to 40 percent of the landings and a similar proportion in value, this author concluded that it was impossible to assess the effectiveness of stocking, as there was no mechanism to discern between landings of naturally recruited and stocked fish; large scale stocking continues to the present time. It should be noted that in this analysis the author did not comment on the exotic Chinese carps that were stocked, which is unfortunate since these landings were unlikely to be augmented by natural recruitment.
Table 21. Mean yield (and range), dominant species in the fishery and species stocked in 11 reservoirs in Thailand. The yield data are based on catches from 1987 to 1998 (from the Electricity Generating authority of Thailand). Other information is based on data from Bernacsek (1997). The years for which the indigenous fish contribution to the catch is available are given in parentheses
|
Reservoir/coordinates |
Size (ha) |
Mean yield (kg/ha/yr) |
Dominant species |
Species stocked |
Contribution of indigenous species (%) |
|
Mae Chang |
1 230 |
19.5 |
Oreochromis niloticus, |
O. niloticus, |
51.8 |
|
Bhumipol |
31 600 |
15.9 |
Puntioplites proctozysron, |
A. nobilis, |
94.6 |
|
Sirikit |
26 000 |
17.7 |
Rasbora spp., |
C. carpio, |
97.4 |
|
Nam Phung |
2 165 |
52.2 |
Osteochilus hasselti, |
L. rohita, |
76.4 |
|
Chulaphon |
1 200 |
29.1 |
O. hasselti, |
O. niloticus, |
46.3 |
|
Ubolratana |
41 000 |
35.8 |
P. proctozysron, |
O. niloticus, |
97.4 |
|
Sirinthorn |
28 800 |
15.4 |
C. aesarnensis, |
O. niloticus |
98.8 |
|
Sri Nagarind |
41 900 |
7.0 |
P. fasciata, |
L. rohita, |
96.2 |
|
Khao Laem |
38 800 |
13.4 |
H. molitrix, |
Cirrhinus molitorella, |
98.3 |
|
Rajjaprabha |
18 400 |
17.6 |
C. micropeltes, |
L. rohita, |
87.5 |
|
Banglang |
5 090 |
17.3 |
Cyclocheilichthys apogon, |
L. rohita, |
99.7 |
The fisheries in Thai reservoirs are somewhat different to others in the region, particularly in the importance of indigenous cyprinids, nandids (featherbacks), bagrids (cat fish) and channids (snakeheads) in the landings. Also, unlike in the rest of Asia, the dominance of introduced cichlids is still relatively limited. De Silva et al. (2004) demonstrated that the Oreochromis niloticus in the landings (Y, in kg/ha/yr) in Thai reservoirs were related to reservoir size (ha) under the following statistical relationship:
|
Y = -1.794ln (X) +18.53 |
(r = 0.70; p <0.05) |
There is still very little known of the role of exotic cyprinids that are stocked yearly into most reservoirs, although the stocking of these species is typically confined to the smaller reservoirs, as they are not expected to establish breeding stocks (Dr. Maitree Pawaputanon pers. comm.).
Thailand is one of the few countries that practice stock enhancement of a crustacean species, the giant river prawn, Macrobrachium rosenbergii. This species is regularly stocked in some Thai reservoirs, for example in Pak Mun Reservoir (4 910 ha), which has a run-of-river type dam[3]. Sripatrprasite and Lin (2003) reported that this reservoir has been regularly stocked with giant river prawn since 1995, totalling 22 million fry up to 2000. The giant river prawn catches (16 646 kg/yr) contributed 53.8 percent to the total fish catch by weight, but 97 percent to the economic value of the landings. These authors demonstrated that despite the low return from stocking (only 1 percent), the high price of the captured prawns (US$ 5.4/kg) resulted in an economic rate of return of 43 percent, making the practice economically viable. Macrobrachium rosenbergii is also regularly stocked into Songkhla Lake; however, it is impossible to determine whether the captured shrimp are from the wild populations or from returns from enhancement.
Inland fisheries in Viet Nam provide about 2 kg/caput/yr to the fish availability in the country, which approximates to about 25 percent of the availability from the total fish production in inland waters (Figure 6). Viet Nam’s contribution to the inland capture fisheries of Asia is one of the lowest of the countries considered in this section and has remained at this level (about three to five percent) throughout the last decade (Figure 8). The inland fishery in Viet Nam currently contributes only about 11 percent to the overall fish landings from capture fisheries in the country (Figure 13) and more importantly, this contribution has been slowly decreasing over the years. For example, it decreased from about 16.5 to 11.4 percent between 1991 and 2001 (136 822 versus 170 000 tonnes as compared to 831 070 versus 1 491 123 tonnes for overall landings for capture fisheries over the same period[4]).
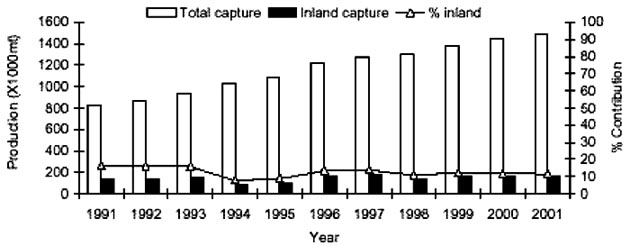
Figure 13. Total capture fishery and inland capture fishery production in Viet Nam and the percentage contribution of the latter to the total (based on FAO statistics 2003)
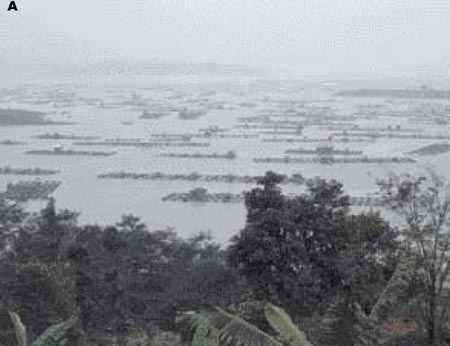
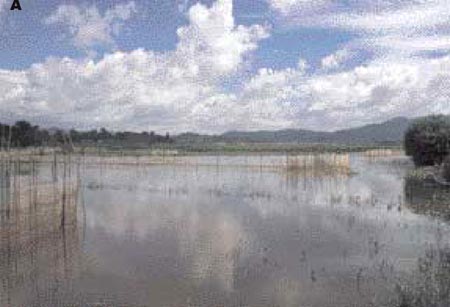
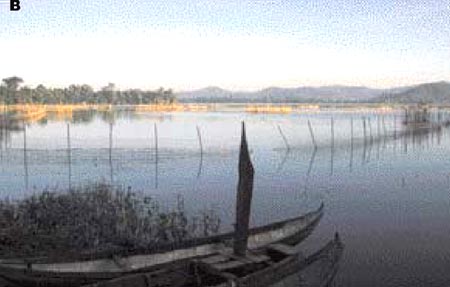
Viet Nam has very limited natural lake resources. The biggest lake, ThiNai Lake, has an area of 5 060 ha, and almost all the others are less than 500 ha. Some of these lakes are heavily silted, and as a result have gradually been transformed into wetlands. An example of this is Dak Lak Lake in the central highlands (Plate 17). Consequently, open-water fishery activities are limited, and the commonest gears are traps and fence nettings. Generally, very little is documented on the fisheries of natural lakes in Viet Nam (Thai et al. 2001).
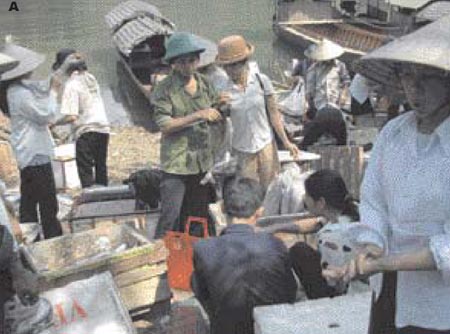
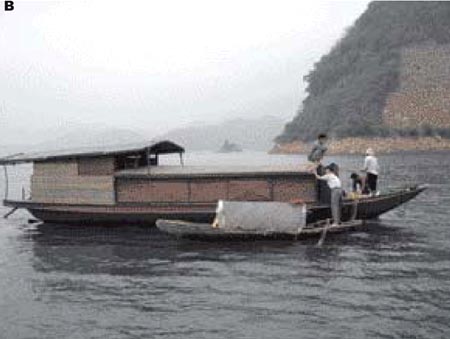
The inland fisheries of Viet Nam are mostly dependent on the river systems and reservoirs, and are artisanal in nature, as elsewhere in Asia (Plate 18). The reservoir resource in Viet Nam was estimated to be 181 167 ha in 1993 (Nguyen 2001), but it is accepted that with the impoundment of a few large reservoirs in the last decade the area is now close to 300 000 ha. The inland fishery activities and their management, particularly in large waterbodies, have undergone major changes in the last ten years, reflecting the changes in the economic milieu of the country. Bui The Anh (RIA No. 1, Viet Nam, personal communication) divided reservoir (= inland) fishery developments in Viet Nam into three phases:
early development period - all fishery activities were subsidized by the government (up to 1985);
declining period (1986 -1995);
and recovery period (1995 to date).
|
Plate 17. (A) & (B) A general view of Lak Lake, Dak Lak Province, in the central highlands of Viet Nam, showing the general transformation of the lake into a wetlands, that restricts the fishing to traps and fence nets |
With economic liberalization and the consequent adoption of a free-market policy, all government subsidies were effectively withdrawn in 1985. This led to a period of uncertainty and hence, to a decline in inland fisheries between 1986-1995. During the recovery period, new management regimes came into being, and reservoir fishery development in Viet Nam is being revitalized. Indeed, the Government of Viet Nam has made a policy decision to utilize reservoir fisheries for poverty alleviation and to provide employment. The aim is to increase food fish supplies, at an affordable price, to the poor sectors of the community, and the government has targeted a total production of 210 000 mt by 2010.
According to Bui The Anh (RIA No. 1, Viet Nam, personal communication) there are currently three forms of management in operation:
government line management (managed by fishery centres of the Government of Viet Nam and/or provincial government (PG));
cooperative line management (mostly applicable to medium-sized reservoirs where a cooperative will lease the waterbody from the PG); and
private sector line management (leased and managed by individuals).
Details on the effectiveness of the different management strategies are yet to be evaluated in this new era. The reservoir/inland fishery development is being gradually transformed into a "user-pays basis", with governmental stocking subsidies withdrawn and/or curtailed. Consequently, fisheries developments are going through a phase of uncertainty. A general lack of scientific (and possibly economic) information has made it difficult for the government to develop meaningful strategies.
There have been only isolated attempts to assess and objectively analyze the effectiveness and costbenefits of stocking in Vietnamese reservoirs, resulting in the current situation of the adoption of ad hoc measures.
Viet Nam has a rich, indigenous freshwater fish fauna, dominated by cyprinids (Nguyen and Ngo 2001), a feature also reflected in most reservoirs (Ngo and Le 2001). Despite this, the reservoir fisheries, barring a few exceptions, are largely based on stocked species such as the Chinese carps, common carp and the Indian carps (rohu and mrigal) and on some larger indigenous predatory species. It is because of this dependence that when governmental subsidies were withdrawn and there was no stocking, most of the reservoir fisheries collapsed.
|
Plate 18. Some features of the reservoir fisheries in Viet Nam. (A) Landing site at ThacBa reservoir; note the predominance of involvement of women. (B) A wholesaler operating in the middle of the HaoBin reservoir. (C) Shrimp traps being transported for sale at fishing vilages. |
Nguyen (2001) observed that the proportion of stocked species in the yields in nine reservoirs ranged from 38 to 99.8 percent, but in this instance the reservoirs considered varied in size from 5 to 22 000 ha. This analysis also used data from 1966 to 1973 for some reservoirs (Table 22). Despite this, it is important to note that even in a large reservoir such as ThacBa, the stocked species accounted for nearly 38 percent of the catch. Although the return of stocked fish was very high, the maximum yield recorded from this reservoir was rather low (20.4 kg/ha) when compared to reservoirs of comparable size elsewhere in Asia (Ngo and Le 2001). Nguyen (2001) demonstrated that the yield increased linearly in relation to stocking density and that in individual reservoirs for which data were available for a number of years, the relationship was curvilinear.
Table 22. Summary results on stocking and returns in selected reservoirs in Viet Nam (modified from Nguyen 2001)
|
Reservoir |
Years of data |
Area (ha) |
SD (finger-lings/ha) |
Maximum yield (kg/ha) |
Stocked species |
Self-recruiting species |
||
|
(kg/ha) |
(%) |
(kg/ha) |
(%) |
|||||
|
SuoiHai |
(1966-73) |
960 |
667 |
63 |
54.4 |
87.1 |
8.1 |
13.0 |
|
VanTruc |
(1969-73) |
150 |
3 644 |
31 |
28.4 |
91.7 |
2.6 |
8.3 |
|
DongMo |
(1972-75) |
800 |
1 065 |
55 |
52.8 |
96.0 |
2.2 |
4.0 |
|
CamSon |
(1971-72) |
2 000 |
2 031 |
45 |
41.0 |
91.0 |
4.1 |
9.0 |
|
ThacBa |
(1971-75) |
22 000 |
217 |
20 |
7.8 |
38.2 |
12.6 |
61.8 |
|
EaKao |
(1997-99) |
210 |
3 641 |
734 |
604.0 |
82.3 |
130.0 |
17.7 |
|
EaKar |
(1997-99) |
141 |
4 884 |
454 |
453.0 |
99.8 |
0.4 |
0.1 |
|
YangRe |
(1998-99) |
56 |
4 686 |
584 |
501.0 |
85.8 |
83.0 |
14.2 |
|
Ho 31 |
(1997-98) |
5.4 |
9 117 |
1 307 |
1 301.0 |
99.5 |
6.1 |
0.5 |
In NuiCoc and SuoiHai reservoirs, the yield (Y - in kg)/stocking density (X - in millions of fingerlings) relationships were, respectively:
Y = 32.885ln (X) - 124.41 (R2 = 0.542), and
Y = 28.28ln (X) + 126.91 (R2 = 0.855).
A detailed study on the stocking strategy in EaKao Reservoir (210 ha), which is intensively fished and well managed (Phan and De Silva 2000), showed that:
the fish yield (y; kg/ha) in year n+1 was correlated to the amount stocked in year n (S D = number stocked/ha), the relationship being, y = -0.0006SD2 + 0.0969SD - 45.50 (R2 = 0.86);
the total number of stocked fish (Y) caught was also related to stocking density in a similar manner; Y = -0.06 x 10⁻⁸ + 0.13SD - 67.04 (R2 = 0.84); and
the stocking efficiency (Li 1988) in year n+1, was also similarly related to stocking density in year n.
Phan and De Silva (2000) demonstrated that the optimum stocking density (SD) for EaKao Reservoir was 2 800 fingerlings/ha and that a SD exceeding 3 200 fingerlings/ha results in a rapid decline in stocking efficiency.
Bui The Anh (RIA No. 1, Viet Nam, personal communication) found that in NuiCoc Reservoir the stocking density (SD) was significantly related to yield from year of stocking (y) to y+4 (Table 23). After the fourth year, the relationship was not statistically significant. Although the above analysis gives an approximate indication of the return from stocking, it is difficult to discern the contribution, for example to the yield in Yn+4 from the fingerlings stocked between years Yn+1 to Yn+3. This would require relatively complicated mathematical modelling and additional data on growth rates, mortality etc. These results conform to the biological expectation that beyond a certain stocking density, the yield would begin to decrease, perhaps resulting from limitations in food resources.
Table 23. The statistical relationships between stocking density (number of fingerlings x 10 000) in year 0 (Yn) to year n+4 (Yn+4) to yield (kg/ha) in NuiCoc Reservoir (2 000 ha), northern Viet Nam. The analysis is based on stocking and catch data from 1978 to 2000
|
Statistical relationship |
R2 |
|
Yn = -0.00003SD2+ 0.057SD + 14.29 |
0.654 |
|
Yn+1 = -0.00004SD2+ 0.0666SD + 12.89 |
0.756 |
|
Yn+2 = -0.00004SD2+ 0.0734SD + 11.06 |
0.804 |
|
Yn+3 = -0.00003SD2+ 0.0622SD + 11.29 |
0.691 |
|
Yn+4 = -0.00006SD2+ 0.0317SD + 13.20 |
0.571 |
Information on the growth rates of stocked fish in Vietnamese reservoirs is scarce, and the only available data are those of Nguyen (2000) for five reservoirs. The growth rates of stocked fish (Chinese carps) such as bighead carp, silver carp and grass carp, did not have any relationship to the size of the reservoir. In the bigger reservoirs, stocked fish appeared to be caught even up to five years, the biggest being bighead carp at five years of age having a mean weight of 24 kg in ThacBa Reservoir (22 000 ha) (Table 24). In general, the growth of bighead carp was the best, particularly in the second year, when they often increased their weight by over 200 percent.
Nguyen (2001) also attempted to conduct an economic analysis and determine the cost-benefit ratio of stocking. This is one of the very few such studies of relatively large lacustrine waters done in the region. This analysis included small, medium and large-sized reservoirs; however, only the latter two are considered here. In the two reservoirs under consideration, the cost-benefit ratio was 5.38 and 7.75 for DongMo and SuoiHai reservoirs, respectively. Unfortunately this analysis did not include cost for infrastructure, fishing and other associated costs and therefore, the cost-benefit ratios are probably over-estimated.
Table 24. The yearly mean weight of stocked fingerlings in selected reservoirs in Viet Nam (modified from Nguyen 2000)
| |
Species |
Mean weight (kg) |
||||
|
Reservoir |
|
Year 1 |
Year 2 |
Year 3 |
Year 4 |
Year 5 |
|
ThacBa (22 000 ha) |
|
|
|
|
|
|
|
Silver carp |
1.20 |
2.40 |
4.30 |
6.50 |
7.80 |
|
|
Bighead carp |
2.15 |
8.61 |
15.31 |
20.96 |
24.00 |
|
|
Grass carp |
1.78 |
2.96 |
4.65 |
6.75 |
7.81 |
|
|
NuiCoc (2 010 ha) |
|
|
|
|
|
|
|
Silver carp |
1.20 |
1.63 |
2.67 |
3.25 |
|
|
|
Bighead carp |
1.40 |
3.20 |
6.00 |
9.60 |
|
|
|
Grass carp |
0.10 |
1.20 |
1.70 |
2.80 |
|
|
|
CamSon (2 300 ha) |
|
|
|
|
|
|
|
Silver carp |
1.19 |
2.90 |
|
|
|
|
|
Bighead carp |
1.56 |
4.20 |
15.60 |
|
|
|
|
SuoiHai (960 ha) |
|
|
|
|
|
|
|
Silver carp |
0.77 |
1.71 |
2.73 |
3.44 |
4.20 |
|
|
Bighead carp |
0.90 |
2.10 |
3.27 |
4.98 |
9.10 |
|
|
Grass carp |
0.80 |
1.83 |
2.75 |
3.80 |
|
|
|
EaKao (240 ha) |
|
|
|
|
|
|
|
Silver carp |
0.54 |
|
|
|
|
|
|
Bighead carp |
0.70 |
|
|
|
|
|
|
[3] A "run of the river" type
dam is one that does not create a large reservoir behind it. [4] This is capture fisheries only and does not include aquaculture production. |
![]()
![]()
![]()