![]()
![]()
![]()
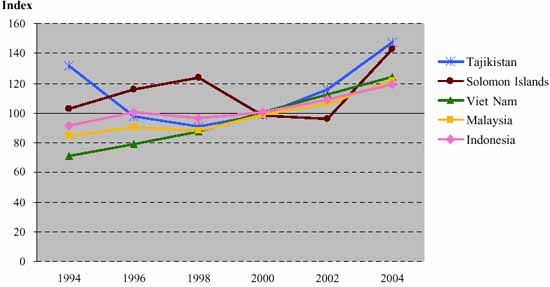
Countries in Asia-Pacific* region with largest agricultural production indices (1999-2001=100)
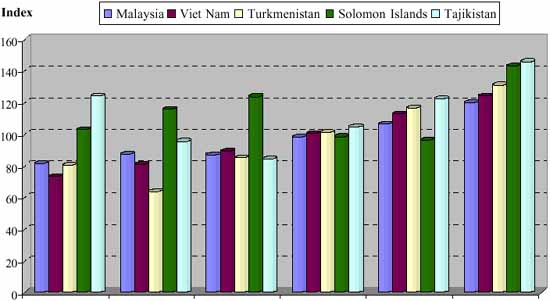
Food production indices (1999-2001=100) for countries in Asia-Pacific* region with largest indices in 2004
(1999-2001 = 100, gross production of agricultural products)*
|
Country |
1994 |
1996 |
1998 |
2000 |
2002 |
2004 |
|
DEVELOPING COUNTRIES/TRANSITION ECONOMIES |
||||||
|
SOUTHEAST ASIA |
|
|
|
|
|
|
|
1. Cambodia |
66.9 |
84.1 |
87.3 |
99.4 |
98.8 |
105.6 |
|
2. Indonesia |
91.1 |
100.2 |
96.7 |
100.7 |
109.1 |
119.0 |
|
3. Lao PDR |
69.1 |
65.7 |
75.7 |
104.8 |
115.3 |
115.3 |
|
4. Malaysia |
84.4 |
90.0 |
88.1 |
99.0 |
106.2 |
121.3 |
|
5. Myanmar |
76.6 |
81.7 |
83.3 |
99.7 |
111.2 |
115.3 |
|
6. Philippines |
85.2 |
93.4 |
87.7 |
99.7 |
109.2 |
115.2 |
|
7. Thailand |
90.0 |
93.8 |
92.9 |
100.5 |
104.2 |
106.7 |
|
8. Timor-Leste |
- |
- |
- |
- |
- |
- |
|
9. Viet Nam |
70.8 |
79.0 |
87.6 |
100.7 |
112.4 |
124.1 |
|
SOUTH AND SOUTHWEST ASIA |
|
|
|
|
|
|
|
10. Afghanistan |
- |
- |
- |
- |
- |
- |
|
11. Bangladesh |
73.7 |
80.7 |
84.1 |
102.8 |
102.9 |
104.6 |
|
12. Bhutan |
102.8 |
110.7 |
112.4 |
90.1 |
91.3 |
94.5 |
|
13. India |
84.2 |
90.3 |
94.4 |
99.0 |
97.8 |
106.0 |
|
14. Iran (Islamic Rep. of) |
84.0 |
90.9 |
103.2 |
100.3 |
110.8 |
114.5 |
|
15. Maldives |
82.4 |
81.9 |
89.1 |
103.3 |
113.7 |
115.0 |
|
16. Nepal |
79.0 |
87.5 |
91.8 |
100.3 |
106.3 |
110.7 |
|
17. Pakistan |
80.8 |
89.9 |
94.8 |
101.7 |
100.6 |
112.8 |
|
18. Sri Lanka |
98.6 |
92.5 |
96.3 |
101.8 |
101.0 |
96.8 |
|
CENTRAL ASIA |
|
|
|
|
|
|
|
19. Kazakhstan |
117.8 |
90.9 |
73.9 |
90.9 |
109.7 |
104.9 |
|
20. Kyrgyzstan |
71.5 |
75.9 |
89.2 |
100.3 |
98.8 |
97.8 |
|
21. Tajikistan |
131.5 |
97.6 |
90.6 |
98.9 |
115.5 |
147.7 |
|
22. Turkmenistan |
105.4 |
63.7 |
82.1 |
102.3 |
103.8 |
122.1 |
|
23. Uzbekistan |
102.7 |
94.8 |
100.8 |
100.9 |
105.3 |
107.3 |
|
EAST ASIA |
|
|
|
|
|
|
|
24. China |
74.3 |
83.8 |
92.6 |
100.2 |
109.0 |
118.1 |
|
25. DPR Korea |
114.5 |
80.3 |
97.6 |
96.1 |
107.6 |
109.3 |
|
26. Mongolia |
77.7 |
91.0 |
98.3 |
109.4 |
101.4 |
93.5 |
|
27. Rep. of Korea |
85.8 |
92.2 |
93.9 |
100.4 |
94.0 |
91.5 |
|
PACIFIC ISLANDS |
|
|
|
|
|
|
|
28. Cook Islands |
- |
- |
- |
- |
- |
- |
|
29. Fiji Islands |
104.9 |
105.8 |
84.8 |
101.8 |
99.1 |
95.6 |
|
30. Kiribati |
84.0 |
97.8 |
102.3 |
97.4 |
100.5 |
107.3 |
|
31. Marshall Islands |
- |
- |
- |
- |
- |
- |
|
32. Micronesia, Fed States of |
- |
100.0 |
100.0 |
100.0 |
100.1 |
100.1 |
|
33. Nauru |
- |
- |
- |
- |
- |
- |
|
34. Niue |
- |
- |
- |
- |
- |
- |
|
35. Palau |
- |
- |
- |
- |
- |
- |
|
36. Papua New Guinea |
85.4 |
90.8 |
94.6 |
101.7 |
103.3 |
106.3 |
|
37. Samoa |
83.5 |
99.1 |
102.0 |
100.7 |
101.6 |
103.3 |
|
38. Solomon Islands |
102.7 |
115.8 |
123.9 |
98.4 |
96.1 |
143.0 |
|
39. Tonga |
111.7 |
99.4 |
94.1 |
99.3 |
103.5 |
102.2 |
|
40. Tuvalu |
- |
- |
- |
- |
- |
- |
|
41. Vanuatu |
98.1 |
101.6 |
123.1 |
97.9 |
89.8 |
97.3 |
|
DEVELOPED COUNTRIES |
||||||
|
42. Australia |
71.0 |
89.5 |
94.4 |
98.0 |
82.9 |
89.6 |
|
43. Japan |
109.1 |
104.2 |
99.6 |
100.5 |
99.2 |
97.7 |
|
44. New Zealand |
90.1 |
93.3 |
99.3 |
101.1 |
106.2 |
115.0 |
|
ASIA & PACIFIC* |
79.6 |
87.5 |
93.3 |
100.0 |
104.6 |
112.7 |
|
WORLD |
85.8 |
91.4 |
95.2 |
100.2 |
103.3 |
110.1 |
* Including all crops and livestock products except fodder crops.
(1999-2001 = 100, gross production of food products)*
|
Country |
1994 |
1996 |
1998 |
2000 |
2002 |
2004 |
|
DEVELOPING COUNTRIES/TRANSITION ECONOMIES |
||||||
|
SOUTHEAST ASIA |
|
|
|
|
|
|
|
1. Cambodia |
65.4 |
83.3 |
86.4 |
99.1 |
99.3 |
105.4 |
|
2. Indonesia |
91.3 |
100.6 |
96.7 |
100.6 |
108.1 |
117.4 |
|
3. Lao PDR |
69.1 |
64.1 |
74.3 |
102.9 |
117.0 |
116.8 |
|
4. Malaysia |
81.4 |
87.3 |
86.9 |
98.3 |
106.3 |
120.0 |
|
5. Myanmar |
76.8 |
81.3 |
82.6 |
99.6 |
111.4 |
115.4 |
|
6. Philippines |
84.3 |
92.9 |
87.1 |
99.8 |
109.4 |
115.5 |
|
7. Thailand |
90.2 |
93.8 |
92.7 |
100.4 |
104.4 |
104.7 |
|
8. Timor-Leste |
- |
- |
- |
- |
- |
- |
|
9. Viet Nam |
73.2 |
81.0 |
89.3 |
100.4 |
112.8 |
124.4 |
|
SOUTH AND SOUTHWEST ASIA |
|
|
|
|
|
|
|
10. Afghanistan |
- |
- |
- |
- |
- |
- |
|
11. Bangladesh |
72.0 |
79.6 |
83.4 |
102.9 |
103.0 |
104.6 |
|
12. Bhutan |
102.8 |
110.8 |
112.5 |
90.0 |
91.3 |
94.5 |
|
13. India |
83.4 |
89.2 |
93.8 |
99.1 |
98.0 |
104.7 |
|
14. Iran (Islamic Rep. of) |
84.2 |
90.5 |
103.4 |
100.2 |
111.4 |
115.4 |
|
15. Maldives |
82.4 |
81.9 |
89.1 |
103.3 |
113.7 |
115.0 |
|
16. Nepal |
78.7 |
87.4 |
91.8 |
100.3 |
106.3 |
110.5 |
|
17. Pakistan |
80.6 |
90.4 |
96.5 |
102.0 |
101.5 |
110.6 |
|
18. Sri Lanka |
100.6 |
91.6 |
95.8 |
101.6 |
100.4 |
95.6 |
|
CENTRAL ASIA |
|
|
|
|
|
|
|
19. Kazakhstan |
117.7 |
90.6 |
73.8 |
90.2 |
110.0 |
103.1 |
|
20. Kyrgyzstan |
67.7 |
76.2 |
89.1 |
99.5 |
100.6 |
97.9 |
|
21. Tajikistan |
124.0 |
95.4 |
84.2 |
104.4 |
122.2 |
145.8 |
|
22. Turkmenistan |
80.5 |
63.7 |
85.0 |
100.8 |
116.6 |
131.0 |
|
23. Uzbekistan |
94.7 |
90.1 |
95.6 |
101.8 |
107.4 |
105.2 |
|
EAST ASIA |
|
|
|
|
|
|
|
24. China |
73.3 |
82.7 |
92.4 |
100.2 |
109.1 |
117.8 |
|
25. DPR Korea |
114.3 |
79.3 |
97.5 |
95.8 |
107.8 |
109.7 |
|
26. Mongolia |
76.8 |
90.9 |
98.6 |
109.7 |
101.9 |
93.6 |
|
27. Rep. of Korea |
84.6 |
92.2 |
94.0 |
100.3 |
94.3 |
92.1 |
|
PACIFIC ISLANDS |
|
|
|
|
|
|
|
28. Cook Islands |
- |
- |
- |
- |
- |
- |
|
29. Fiji Islands |
105.0 |
106.0 |
85.0 |
101.8 |
99.2 |
95.5 |
|
30. Kiribati |
84.0 |
97.8 |
102.3 |
97.4 |
100.5 |
107.3 |
|
31. Marshall Islands |
- |
- |
- |
- |
- |
- |
|
32. Micronesia, Fed States of |
- |
100.0 |
100.0 |
100.0 |
100.1 |
100.1 |
|
33. Nauru |
- |
- |
- |
- |
- |
- |
|
34. Niue |
- |
- |
- |
- |
- |
- |
|
35. Palau |
- |
- |
- |
- |
- |
- |
|
36. Papua New Guinea |
85.2 |
91.2 |
94.1 |
101.4 |
104.2 |
107.7 |
|
37. Samoa |
83.4 |
99.0 |
102.0 |
100.7 |
101.7 |
103.3 |
|
38. Solomon Islands |
102.7 |
115.8 |
123.9 |
98.4 |
96.1 |
143.2 |
|
39. Tonga |
111.7 |
99.4 |
94.1 |
99.3 |
103.5 |
102.2 |
|
40. Tuvalu |
- |
- |
- |
- |
- |
- |
|
41. Vanuatu |
98.1 |
101.6 |
123.0 |
97.9 |
89.8 |
97.3 |
|
DEVELOPED COUNTRIES |
||||||
|
42. Australia |
69.5 |
89.2 |
93.8 |
97.4 |
84.4 |
91.9 |
|
43. Japan |
109.0 |
104.2 |
99.5 |
100.6 |
99.2 |
97.7 |
|
44. New Zealand |
88.5 |
92.3 |
98.8 |
100.9 |
107.1 |
116.4 |
|
ASIA & PACIFIC* |
78.9 |
86.8 |
93.1 |
100.0 |
104.9 |
112.2 |
|
WORLD |
85.3 |
90.9 |
95.0 |
100.2 |
103.4 |
109.8 |
* Including all products that are considered edible and contains nutrients
![]()
![]()
![]()