G. Gunkel and H. Kausch
Limnological Institute, University of Freiburg, Konstanz Fed. Rep. Germany
ABSTRACT
The effectiveness of the artificial breeding of whitefish and cultivation of fry are discussed. New investigations of food intake and growing of fry lead to the assumption that the fry must be fed at least 5 to 7 weeks to assure a high rate of survival after stocking. This is indicated by the mortality pattern of fry and the utilization of feed for growth.
Growth of fry and fingerlings of whitefish were investigated to develop a model of growth on the basis of the daily ration and the weight of fish. The growth of fish is explained by a stratification of the isopleths of rations as well as the range of maximum food intake. The growth of whitefish under natural conditions confirms this model, based on laboratory growth experiments. Data for food demand of fry as well as stocking densities are given.
RESUME
L'efficacité de l'empoissonnement des Corègones produites par reproduction et alevinage artificielle est scrutée. Les expériences recentes sur l'alevinage ont montré qu'il faut éléver les alevins pendant 5 à 7 semaines avant de les liberer afin d'assurer un bon pourcentage de survie. Ceci est basé sur les phases successives de la mortalité et l'utilization des aliments.
Un modèle a été développé de la croissance relative à la ration journalière et le poids du corp de poisson. La croissance est délimitée par une isoplète stratifiée des rations intermédiaires et la consumption maximum. Le modèle a été comparé avec les données provenantes des circonstances naturels. Les besoins nutritif ainsi que les densités d'empoissonnement peuvent être derivées.
The whitefish is a common fish in European lakes and it has a considerable economical importance. As a result of lake eutrophication and pollution the proportion of whitefish in the total fish yield in lake Constance has diminished from year to year while the proportion of cyprinids has increased (Kriegsmann, 1955; Deufel, 1975). Therefore controlled propagation of whitefish has been a general interest and task since several decades (Ammann and Steinmann, 1948; Nümann, 1953; Elster and Kausch, 1974). Besides the stocking of natural lakes the cultivation of whitefish in ponds receives more and more attention. It is already carried out in east European countries. The cultivation of fry therefore is of general interest to inland fisheries.
It was assumed that the decrease of the proportion of whitefish catch to total catch was due to low oxygen content at the lake bottom, which lead to mortality of eggs (Nümann, 1972). Therefore fish breeding stations were established for artificial incubation of eggs. The reasoning was that in whitefish cultivation for fishery maintenance mortality that occurred during the incubation of eggs and among the hatched fry could be reduced.
Special investigations for the effectiveness of these efforts were not performed at Lake Constance. However, according to Flüchter (1979), the dissolved oxygen requirement of whitefish eggs is similar to other salmonid eggs and amounts to 8 mg O2 1-1 water in the eyed stage. This indicates that the oxygen content does not have the importance that was assumed earlier. Results of Christie (1963) concerning the effects of artificial propagation on Lake Ontario's whitefish fishery show that alternate-year stocking of hatchery fish for 10 years did not have any detectable effect on the fishery, although strong year-to-year fluctuations in the level of the catch were observed. This showed that the losses after hatching are of high importance, affecting the stocked fry as well as the wild fry (Christie, 1963).
This is confirmed by findings of Gunkel (1979 a), which showed that in holding tanks only low mortality of fry of Coregonus fera occurred during the first two weeks when the fish started to feed. The process of inborn behaviour and learning of feed taking (Braum, 1964) was no critical period in life history, and the fish seemed to be sufficiently successful in catching zooplankton at the end of the yolk sac stage. The main mortality occurred later, 2 to 3 months after hatching. We must assume that also under natural conditions the mortality of fry takes place at the age of some weeks to months. This could explain the small effect of whitefish fry planting.
Apart from this, the slower growing fish showed a higher mortality than the faster growing ones under laboratory conditions. This could be demonstrated under natural conditions for Coregonus wartmanni (Gunkel, 1979 a). If we assume that the slower growing fish are fish of low vitality which under natural conditions would die during egg development or at hatching, it follows that artificial incubation of eggs and stocking with fry that are only several days old has a limited effect for recruitment in lakes.
Up to now several new approaches were made for cultivation of whitefish fry. The cold breeding of eggs at 1° C results in retardation of the eggs development of nearly 8 weeks (Nümann, 1953). Consequently the fry are hatching during a period of higher zooplankton development in lakes.
Feeding of the fry in the fish breeding stations in holding tanks is commonly practised at Lake Constance. There they are fed for about 2 weeks with natural zooplankton (Kriegsmann, 1970). Because this is scarce during hatching period, the cultivation of zooplankton in artificial ponds is of high interest and investigations on this line are carried out (Heisig, 1979).
The feeding of fry exclusively with dry diets leads to insufficient results, i.e. small growth rates and a high mortality after longer feeding periods (Flüchter, 1975; Eckmann and Kausch, 1976; Appelbaum, 1978; Gunkel, 1979 a). Food utilization and growth of fry on dry diets is a very complex problem and up to now the commercial use of dry diets for cultivation of whitefish fry is not practiceable. Consequently we must use natural food resources for fry feeding, that means zooplankton.
Besides the cultivation of hatched fry in tanks for a longer period, the use of natural ponds (Elster, 1937; Loeffler, 1977) as well as net cages, especially illuminated cages (Uryn, 1979; Wolf 1979), is possible and seems to be successful.
The possibilities of feeding the fry of Coregonus fera for a longer period were investigated by Gunkel (1979 a, 1979 b), demonstrating that during the first 5 days after starting to feed, no growth in weight of the fry can be observed. Utilization of food for growth started only at the age of 12 days at 8° C. The reason is not clear, but it makes it necessary to feed the fry for a period longer than 2 weeks to reach a real increase in weight and stored energy. A feeding period of at least 4 weeks seems to be needed to ensure a better effect of fry stocking.
Experiments have been carried out in our laboratory for several years to determine precise relationships of food intake and growth of Cyprinus carpio (Kausch and Ballion-Cusmano, 1976; Schade and Kausch, 1978) and of Coregonus fera (Kausch and Zimmermann, 1976; Gunkel, 1978, 1979 a, 1979 b). The experiments led to a model of growth considering as parameters of growth of fish the specific growth rate per day1), the food intake as relative ration, and the weight of fish. These data allow the determination of feeding requirements and efficiency, of stocking density etc., being the basis of controlled fish production.

w = weight of fish, t= time; see Brett et al. (1969)
In fig. 1 the growth in weight of whitefish fry after hatching is shown (Gunkel, 1979 a). The fry were fed excess nauplii of Artemia Salina one day after hatching. Some fish started to feed at the sixth day, and 50% were feeding about the eighth day. Experiments with starved fry were used as a control. From the first day an increase in wet weight was observed, occurring in both starved and fed fish. At the same time a decrease in dry weight was recorded. There was apparently no difference in the body weight changes of starved and excessively fed fry until the age of 12 days. The increase in wet weight is a consequence of water uptake. This has been demonstrated for fry of several salmonid species too (Peterson and Metcalfe, 1977). About 5 days after the start of feeding, a dry weight increase was observed, the fry being 12 days old. Within 1 or 2 days from that time on the fry reach a specific growth rate on a dry weight basis of 4%/day, increasing to 6%/day till the age of 30 days.
The determination of food intake during this stage of life of the fry is difficult, but we must assume that they take up large quantities. At the first day of feeding the intestine was filled up with 25 nauplii (Flüchter, 1976; Gunkel, 1978), corresponding to 3 to 4% of dry weight of fry (Gunkel, 1979 b), giving a daily ration of about 10% when we assume that the intestine is filled 2 to 3 times a day, as Rosenthal (1969) could prove for Clupea harengus. After 20 days the whitefish were 16 mm long and took in 80 nauplii for each meal (Flüchter, 1976) which is 10% of fry dry weight, and we can calculate a daily ration of 20 to 30%. The growth rates, observed at this stage, amounted 4%/day, so that the estimated gross growth efficiency2) of 13 to 20% is very small.
2) gross growth efficiency k1 = (G / food intake) × 100 (%), see Brett et al. (1969)
These results of fry growing are summarized in fig. 2; the specific growth rates are plotted against the dry weight of fry under excess feeding conditions. During the first days after feeding negative specific growth rates occur, later growth rates of about 4%/day can be observed. Fry of 5.5 mg dry weight, that means 20 mg wet weight or a total length of 18 mm, show growth rates of 6%/day. One data, a growth rate of 10.5%/day, seems not to be realistic. These data describe the growth of fry for the first 7 weeks after hatching, within this time they reach a wet weight of about 70 mg and a total length of 26 mm.
Experiments with larger fry were also carried out to determine the specific growth rates and the gross growth efficiency (Kausch and Zimmermann, 1976; Gunkel, 1979 a, 1979 b). Some of the findings are shown in fig. 3 for fry from 1 to 1 g wet weight with a total lenght of 4 to 5 cm. The fish were fed with living zooplankton (exclusively consisting of Daphnia pulex). Both, the specific growth rate and the daily ration, are calculated and expressed as dry weight: for further experimental details see Gunkel (1979 b).
Up to rations of 25 to 30%, increasing specific growth rates were found at the two temperature ranges, 14.2° C and 8.9° C, both giving linear relationships between specific growth rate and ration up to the range of excess feeding (at 14.2° C ration about 26%/day, marked as hatched curve). During this stage of life, the influence of temperature is very small: with the same ration the specific growth rate increases at about 75% for a temperature increase from 8.9° C to 14.2° C. At 8.9° C the highest specific growth rates of 7%/day were also observed, so that with increasing temperature no higher growth rates could be demonstrated. The experiments with larger whitefish show quite different results (Gunkel, 1979a; 1979b).
These linear relationships between specific growth rate and ration up to the range of excess feeding are very interesting and were also found by Kausch and Zimmermann (1976) for the whitefish. These relationships are often described by plateau curves as Brett and Shelbourn (1975) could demonstrate for Oncorhynchus nerka, Kausch and Bailion-Cusmano (1976) for Cyprinus carpio and Huisman (1976) for Salmo gainlneri and Cyprinus carpio.
The data of all experiments for fish of 1 mg (fry just hatched) to 10 g dry weight are presented in fig. 4. The specific growth rates are plotted against the dry weight of fish, the ration is given for each point as well as the free hand fitted isopleths of relative rations. The data in brackets indicate excess feeding rations. At the same ration with the increasing weight of fish, the growth rate increases due to increasing gross growth efficiency as well as to decreasing maintenance (Gunkel, 1979 a; 1979 b).
The range of excess feeding is reached without transition of the isopleths of ration to lower growth rates. This is a consequence of the linear relationship between specific growth rate and the ration (see above). The isopleths of low rations (2.5 to 10%/day) show a characteristic bending: the isopleths have a strong positive slope for fish of small dry weight beginning with the maintenance level; the slopes of the isopleths become smaller with increasing fish weight, being nearly zero for fish of high weight. The isopleths of high rations (15 to 30%/day) can only be determined for a small range of fish weight, because these high rations present excess feeding rations for larger fish. With increasing fish weight, the maximum daily ration decreases which was also verified for Onorhynchus nerka (Brett and Shelbourn, 1975) and Cyprinus carpio (Kausch and Ballion-Cusmano, 1976). This range of excess feeding seems to be controlled by the physiological capacity of food uptake, as Brett (1971) suggested for Oncorhynchus nerka and new investigations confirm for Cyprinus carpio (Schade and Kausch, 1978) and Coregonus fera (Rösch, 1978).
Kausch and Zimmermann (1976) described the growth of whitefish with a function deduced in the same manner as for Cyprinus carpio (Kausch and Ballion-Cusmano, 1976); the specific growth rate is written as a function of the effects of daily ration and the weight of fish. The relationship of the absolute growth per day and the absolute ration per day can be described with a plateau curve as:
| g= a (1 - e-br) - c | (1) |
(g = absolute growth; r = absolute ration; a, b, c = constants).
This equation can be transformed to a function of G (specific growth rate) in relation to R (relative ration) and weight of fish (W):
 | (2) |
calculated on the basis of dry weight, according to Kausch and Zimmermann (1976), who presented this relationship on the basis of caloric content for fish of .2 to 3.3 g dry weight (further details see Kausch and Ballion-Cusmano, 1976, and Kausch and Zimmermann, 1976). This equation was used to calculate the isopleths of ration as given in fig. 4.
The calculated isopleths as well as the experimentally determined range of maximum food intake are presented in fig. 5. The tendency of the calculated isopleths is similar to the free hand fitted isopleths though the slopes of the curves seem to be somewhat steeper as compared to fig. 4. In the range of small weight of fish, all isopleths show a characteristic increase and reach a maximum which is shifted to larger weights with decreasing rations. After that the isopleths show a negative slope. This complete course of the function, however, is only demonstrable for rations up to nearly 10%. For larger rations the theoretical maximum of growth is in the range of excess feeding. Therefore the line of maximum food intake cuts the isopleths, and on the right hand side of this line there are no experimental growth rates existent. This gives the characteristic increase of the isopleths of rations of 15 to 30%/day under experimental conditions without having a smooth transition to lower growth rates in the range of excess feeding. This approach also gives an explication why linear relationships were observed between the growth rate and the ration. The theoretically expected and often proved maximum in this relationship is not demonstrable because this maximum would only occur in a range of fish weight, where the fish no longer take in large rations like this.
It is remarkable that the growth of fish can be described with a maximum function, based on the data of the fry feeding experiments (fig. 4). The growth of fry increases from negative growth rates (for fry having started to feed) up to the maximum growth occurring in fry of 10 to 100 mg dry weight (53 to 255 mg wet weight, 24 to 37 mm total length). For larger fry, growth rates strongly decrease up to fish of 1 g dry weight (4.4 g wet weight, 9 cm total length). Fingerlings larger than 1 g dry weight show growth rates up to 2%/day and the range of maximum food intake is nearly constant.
It is possible that even higher growth rates than 7%/day can occur in fish of 10 to 100 mg dry weight because the range of maximum food intake could not be exactly determined for these fish. It is very interesting that these free hand fitted isopleths of ration lead to a high daily food intake of fry after hatching, as it was already supposed. Rations of more than 30%/day may be eaten by fry some weeks after hatching.
The weight decrease of starved fish is plotted as the negative specific growth rate demonstrating that the maintenance level decreases with increasing weight of fish.
The transformation of these data to joule is simply possible using a factor of .79 (as % joule of food × joule of fish-1 × day-1). The specific growth rates need not to be corrected (see Gunkel, 1979 b).
These findings indicate that the specific growth pattern of fish with increasing body weight is the result of two functions, i.e. the stratification of the isopleths which is approximately described by the plateau function and on the other hand the range of maximum food intake which must be additionally determined.
The effect of temperature on the growth of fish is described elsewhere (Gunkel, 1979 a; 1979 b). The effect on the growth rate is very small (fig. 3). This is similar for larger fry. But there is a strong effect of temperature on the maximum food intake of larger fish: with decreasing temperature the daily food intake also decreases.
This model of growth determined in laboratory experiments was compared with some data of the growth of whitefish under natural conditions. In fig. 6 the maximum weight of whitefish is calculated from the growth model in the course of the year. The day of hatching was assumed to be the first of March. About 14 days after hatching a weight increase occurs, the data of the excess feeding experiments of fry are plotted as solid curve. The calculated maximum weight increase on the basis of the growth model is presented as hatched curve. A dotted curve shows an extrapolated range from the middle of October to the middle of December, when low temperatures occur and no growth of fish is expected. Some present data of weight increase of whitefish under natural conditions are given, showing a similar weight increase as calculated. The weight increase of whitefish fry was studied during cultivation experiments in fish ponds and artificial ponds. For these experiments we must assume a sufficient zooplankton development in the ponds, so that these data should present the maximum growth of fry. The cultivation of fry in a fish breeding station in holding tanks led to a smaller weight increase during a five week period with fry being excessively fed, however at a high fish density. Only a few 1 year old fish from Lake Constance had a weight little less than the calculated maximum weight. This confirms that the curve calculated on the basis of the growth model describes the maximum weight increase of whitefish and can be applied to natural conditions.
In fig. 7 the relationships between wet weight of fish and daily food intake are presented. They were calculated from the growth model. At the age of 20 days the fry of whitefish take in large quantities of food, and daily rations of more than 100% on the basis of wet weight can be observed. For fish larger than .6 g wet weight the relative rations decrease with increasing fish weight.
Using these data, we can calculate the daily food intake of 100 000 fry in kg wet weight of zooplankton as is given in fig. 7. Fry at the age of 25 days (16 mg, 1.7 cm) need 1.6 kg zooplankton each day, those being 50 days old (65 mg, 2.5 cm) need about 8 kg/day. For larger fish at the age of 75 days (.4 g, 4 cm) 40 kg zooplankton is necessary and after 100 days even 115 kg is needed (fish having 1.6 g and 6.5 cm). These data demonstrate that the cultivation of whitefish in holding tanks in fish breeding stations is quite difficult because a lot of zooplankton is needed each day. A cultivation of a few hundred thousand fry for 50 days seems to be possible, but longer cultivation periods must fail because of high food demand.
In fig. 7 the maximum stocking densities of fry in natural ponds are also given, calculated on the basis of a zooplankton production of 22 kg ha-1 day-1 which is normally reached in ponds. With an increasing cultivation period, the maximum stocking density decreases from 1 400 000 ha-1 for a 25 day period to 275 000 for a 50 day period, 56 000 for a 75 day period and only 19 000 for a 100 day period. More fish can be cultivated in the case of higher zooplankton production in ponds.
Consequently cultivation of whitefish fry is ponds seems to be more practiceable than in holding tanks. This would allow to cultivate a large number of fry for a longer period and the stocked fingerlings have a great chance to survive. The removal of the fingerlings from the ponds and the transport to the lake are problems which can be solved.
The effectiveness of stripping of whitefish, incubation of the eggs, and stocking of the fry in lakes has not been proved yet. Several approaches for cultivation of whitefish fry are developed i.e. cold breeding, feeding of fry in holding tanks, cultivation in fish ponds, and net cage culture. The feeding of fry with dry diets has not been succesful up to now. New investigations indicate that the feeding of fry for a longer period under controlled conditions is necessary to insure a high rate of survival of stocked fry. For a five day period after the fry had started to feed no food utilization for growth was observed, so that cultivation periods of 1 or 2 weeks are of no use. Besides that, the main mortality of fry occurs 1 or 2 months after hatching.
The growth of fry was investigated and showed a weight decrease after the beginning of feeding. Twelve days after hatching a weight increase occurs and the fry reach the specific growth rate on dry weight basis of 4%/day; the maximum growth of 30 days old fry amounted to 6%/day. During this period the fry take in large quantities of food.
Experiments for food intake and growth of larger fry showed linear relationships between the specific growth rate and the daily ration up to the range of excess feeding. These data led to a model of growth that comprises the specific growth rate, the weight of fish, and the relative rations. The isopleths of ration can be approximately described with plateau curves. The growth of fish is explained by a stratification of the isopleths of rations as well as the range of maximum food intake. The maximum growth of whitefish calculated from the growth model was confirmed by some data of whitefish which had grown under natural conditions. This growth model enables the calculation of food demand of fry and of stocking densities.
Ammann, E. and P. Steinmann, 1948 Die Verbesserungen der Methoden der Felchenzucht. Kommission f.d. Erforschung fischereiwirtschaftlicher Fragen, Sonderber. 1, Zürich, W. Kunz, 1–44
Appelbaum, S., 1978 Verhaltensstudie zur Futterungsaufnahme von Larven der Kleinen Maräne (Coregonus albula (L)). Arch.FischWiss., 29: 85–91
Braum, E., 1964 Experimentelle Untersuchunger zur erster Nahrungsaufnahme und Biologie an Jungfischen von Blaufelchen (Coregonus fera Jurine) und Hechten (Esox lucius L.). Arch. Hydrobiol./Suppl. (Falkau-Arbeiten), 28, V(2/3): 183–244
Brett, J.R., 1971 Satiation time, appetite, and maximum food intake of sockeye salmon, (Oncorhynchus nerka). J. Fish. Res. Bd. Can., 28(3): 409–415
Brett, J.R. and J.E. Shelbourn, 1975 Growth rate of young sockeye salmon, Oncorhynchus nerka, in relation to fish size and ration level. J. Fish. Res. Bd. Can., 32(11): 2103–2110
Brett, J.R., J.E. Shelbourn and C.T. Shoop, 1969 Growth rate and body composition of fingerling sockeye salmon, Oncorhynchus nerka, in relation to temperature and ration size. J. Fish. Res. Bd. Can., 26(9): 2363–2394
Christie, W.J., 1963 Effects of artificial propagation and the weather on recruitment in the Lake Ontario Whitefish fishery. J. Fish. Res. Bd. Can., 20(3): 597–646
Deufel, J., 1975 Gegenwärtige Fischereigrundlagen der Binnenfischerei und Möglichkeiten einer gesteuerten Nutzung - Beispiel Bodensee. Arbeiten des Deutschen Fischerei - Verbandes, 18: 66–83
Eckmann, R. and H. Kausch, 1976 Fütterung von Felchenbrut mit künstlichen Futtermitteln. Der Fischwirt, 26: 9–11
Elster, H.J., 1937 Versuch zur Hebung der Coregonenfischerei im Bodensee. Fisch.-Ztg., 40: 1–15
Elster, H.J. and H. Kausch, 1974 Die “biologische Resistenz” der Fischbestände und das Problem der optimalen Befischung - kückblick und Ausblick. Arch. FischWiss., 25(1/2): 1–11
Flüchter, J., 1975 Vorstrecken von Renkenbrut mit Magermilchpulver. Fischer und Teichwirt, 1
Flüchter, J., 1976 Nahrungsmenge von Renkenbrut. In: Bayerische Landesanstalt für Fischerei, Jahresbericht 1976, Starnberg, 26–28
Flüchter, J., 1979 Bericht über den derzeitigen Kenntnisstand bei der Aufzucht von Felchenbrut (in publ.)
Gunkel, G., 1978 Wachstum, Nahrungsausnutzung und Körperzusammensetzung von Brütlingen und jungen Sandfelchen (Coregonus fera J.) bei Fütterung mit Teichplankton und im Hunger. - Experimentelle Untersuchungen zur Akkumulation eines Herbizids (Atrazin, S-Triazin) an Sandfelchen (Coregonus fera J.): Aufnahme, Anreicherung und Verteilung im Fisch. Dissertation Universität Freiburg, FRG
Gunkel, G., 1979 a Laboratory experiments on the cultivation of young whitefish (Coregonus fera J.): food intake, gross growth efficiency and growth of the fry. European Mariculture Society, Spec. Publ., 4 (in press).
Gunkel, G., 1979 b Growth rate, gross growth efficiency, and body composition of fry and young whitefish (Coregonus fera J.) fed on pond zooplankton and being starved (in publ.).
Heisig, G., 1979 Mass cultivation of Daphnia pulex in ponds: the effect of fertilization, aeration, and removal on the population development. European Mariculture Society, Spec. Publ., 4 (in press)
Huisman, E.A., 1976 Food conversion efficiencies at maintenance and production levels for carp, Cyprinus carpio L., and rainbow trout, Salmo gairdneri Richardson. Aquaculture, 9 (3): 259–273
Kausch, H. and M.F. Ballion-Cusmano, 1976 Körperzusammensetzung, Wachstum und Nahrungsausnutzung bei jungen Karpfen (Cyprinus carpio L.) unter Intensivhaltungsbedingungen. Arch. Hydrobiol./Suppl. (Falkau-Arbeiten), 48(2): 141–180
Kausch, H. and C. Zimmermann, 1976 Nahrungsnutzung und Wachstum junger Sandfelchen (Coregonus fera Jurine 1825) bei Fütterung mit Teichplankton. Arch. Hydrobiol./Suppl. (Falkau-Arbeiten), 48(2): 181–206
Kriegsmann, F., 1955 Der Wechsel in der Vergesellschaftung der Fischarten des Ober- und Untersees und die Veränderungen des Seereagierens. Arch. Hydrobiol./Suppl., 22: 397–408
Kriegsmann, F., 1970 Jungfischaufzucht mit Zooplankton. Der Fischwirt, 20(8): 184–188
Loeffler, H., 1977 Vorstrecken von Felchen (Coregonus lavaretus) in planktonreichen Karpfenteichen. Der Fischwirt, 27(4): 22–23
Nümann, W., 1953 Felchenerbrüting mit künstlich abgekühltem Wasser im Umwälzverfahren. Z. Fischerei NF, 1/2: 83–92
Nümann, W., 1972 The Bodensee: Effects of exploitation and eutrophication on the salmonid community. J. Fish. Res. Bd. Can., 29: 833–847
Peterson, R.H. and J.L. Metcalfe, 1977 Changes in specific gravity of atlantic salmon (Salmo salar) alevins. J. Fish.Res. Bd. Can., 34(12): 2388–2395
Rosenthal, H., 1969 Verdauungsgeschwindigkeit, Nahrungswahl und Nahrungsbedarf bei den Larven des Herings, Clupea harengus L. Ber. dt. wiss. Komm. Meeresforsch., 20(1): 60–69
Rösch, R., 1978 Untersuchungen zur Nahrungsausnahme und Nahrungsausnutzung bei Sandfelchen (Coregonus fera Jurine). Diplomarbeit, Limnologisches Institut Konstanz, FRG
Schade, R. and H. Kausch, 1978 Untersuchungen zur Exzessfütterung von jungen Karpfen (Cyprinus carpio L.) unter Intensivhaltungsbedingungen. Arch. Hydrobiol., 82(1/4): 522–550
Uryn, B., 1979 Rearing of whitefish in illuminated cages. European Mariculture Society, Spec. Publ., 4 (in press)
Wolf, V., 1979 Versuche des Vorstreckens von Fischbrut in Gazekäfigen mit Hilfe von Licht im VEB Binnenfischerei Frankfurt (Oder). Z. Binnenfischerei DDR, 26(1): 12–14
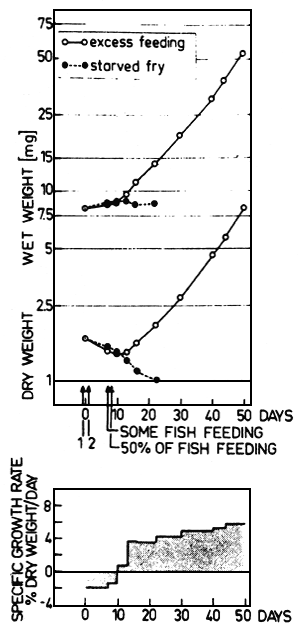
Fig. 1. Above: Relationship between dry and wet weight (mg) and time (days) after hatching for starved fry and fry fed in excess with nauplii of Artemia salina; 6.5°C; 1 = time of hatching; 2 = start of feeding with nauplii of Artemia salina.
Below: Relationship between the specific growth rate (% dry weight/day) and time (days) after hatching. The weight decrease of fry is expressed as a negative growth rate.
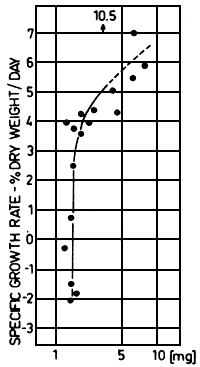
Fig. 2. Relationship between specific growth rate (% dry weight/day) and dry weight of fry (mg). The fry were excessively fed with nauplii of Artemia salina. These experimental data describe growth of fry for a 70 days period after hatching (6.5°C to 8.0°C).
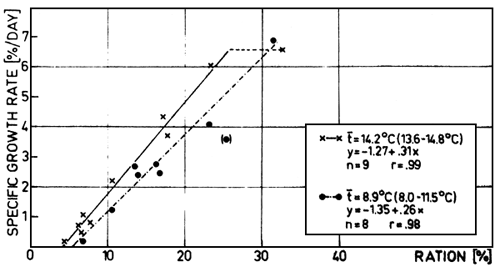
Fig. 3. Relationship between specific growth rate (% dry weight/day) and ration (% dry weight) for fish from .1 to 1.0 grams wet weight. The data for two temperature ranges are given (t = 14.2°C and 8.9°C). The range of excess feeding is marked as a hatched curve (14.2 °C).
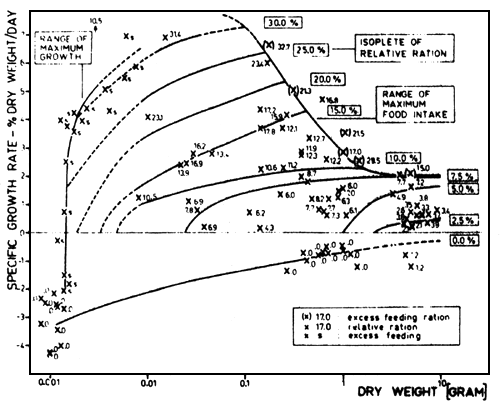
Fig. 4. Relationship between specific growth rate (% dry weight/day) and dry weight of fish (g). The relative ration is given for each point; the isopleths of relative ration (in % dry weight) are free hand plotted as well as the range of maximum growth and maximum food intake. The rations of excess feeding are inserted in brackets. The temperatures range from 6.5°C to 15.6°C, see text (Gunkel, 1979a).

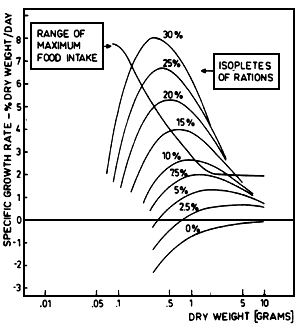
Fig. 5. The isopleths of rations (in % dry weight) are given calculated with a function (above) developed by Kausch and Zimmermann (1976) in relationship to the specific growth rate (% dry weight/day) and the weight of fish (dry weight in grammes). The range of maximum food intake as presented in fig. 4 is plotted, too. The growth equation is based on experimental data of fish from .2 to 3.3 grams dry weight.
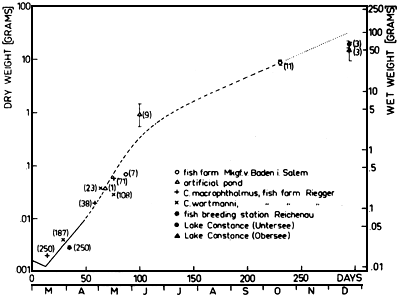
Fig. 6. Maximum growth of fish calculated from the growth model is plotted in relationship to the time course; (solid curve = excess feeding of fry; hatched curve = growth calculated from the growth model; dotted curve = extrapolated range during low temperatures). Several data for growth of whitefish under natural conditions are given, as well as the number of fish of each sample, and the standard deviation for individual samples.
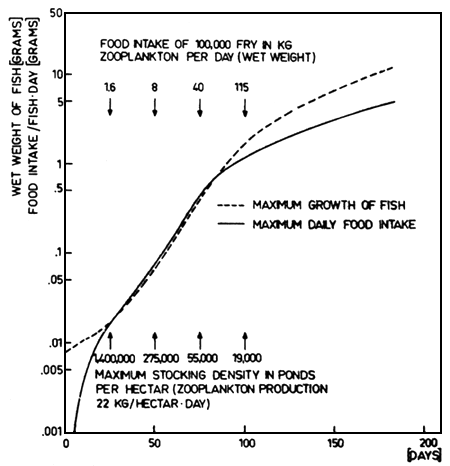
Fig. 7. Maximum growth of fish in wet weight is plotted in relationship to the time course as well as the calculated maximum daily food intake on the basis of wet weight calculated from the growth model. The food intake of 100 000 fry in kg zooplankton per day is also given in relation to the cultivation period as well as the maximum stocking densities per ha calculated on the basis of a zooplankton production in pond of 22 kg ha-1 day-1.