M. Sipponen and L. Hakkari
Hydrobiological Research Centre, University of Jyvaskyla
Jyvaskyla, Finland
ABSTRACT
Brown trout parr were incubated in nylon netting cages in an area polluted by pulp and paper mill effluents. Tagged brown trout smolts (average length 18–20 cm) were also stocked in order to examine the suitability of brown trout for compensation stocking.
The catch per 1 000 smolts was 6.2–145.3 kg in spring stockings and 0–37.8 kg in autumn stockings. The percentage of tags returned was 1.6–14.2 and 0.2–6.4, respectively. Fish were found to migrate down the watercourse. About 50 percent of the fish were caught at a distance of 40 km or more from the stocking sites.
Thus, the results show that damages to local fisheries could not be entirely compensated for by stockings with brown trout.
RESUME
On a étudié une partie du cours du Kymijoki dans la province centrale de la Finlande. Le nord de cette zone est pollué par des usines de pâte à papier et par les effluents ménagers.
En 1977–79 on a déversé des truites (Salmo trutta) marquées de deux étés/ans dans trois zones différentes du point de vue de la pollution ou de l'eutrophisation. Fin 1981, on avait recapturé au total 4 pour cent des 4 500 poissons marqués. La plupart de ces captures ont été faites par des pêcheurs de subsistance ou par des amateurs.
La valeur commerciale des captures ne représentait que la moitié environ du coût des alevins. Le repeuplement de printemps a donné de meilleurs résultats que celui d'automne.
Les opérations de repeuplement effectuées en automne dans la zone la plus polluée ont échoué. Dans la zone moins polluée, 20 pour cent seulement des recaptures ont été faites sur les lieux mêmes du repeuplement et certains poissons ont été recapturés jusqu'à 100 km plus en aval. Enfin, dans la zone non polluée, 63 pour cent des recaptures ont été effectuées près du site de repeuplement.
La truite s'est déplacée vers l'aval même lorsqu'il n'y avait pas de pollution. Aussi n'est-il pas recommandé de repeupler avec ce poisson des lacs ouverts si l'objectif est d'améliorer les pêcheries locales.
Fish stockings have been the most common method for minimizing damage to fisheries caused by the pulp industry and by domestic sewages in Finland. Brown trout has been one of the most frequently used species. However, it demands good water quality and many strains have the tendency to migrate down the watercourse.
This paper discusses the suitability of brown trout for compensative stocking in a polluted area.
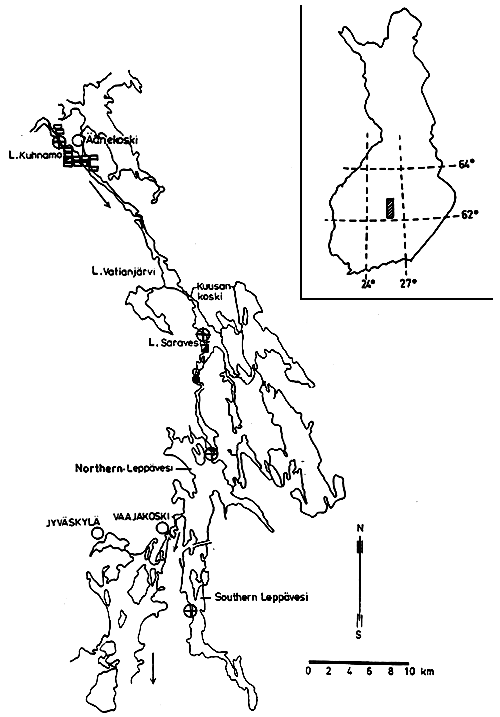
The study area is part of the Kymijoki watercourse, which is the second largest watercourse in Finland and flows into the Gulf of Finland. There is a pulp and paper mill situated in the northern part of the study area, at Aanekoski, whose effluents are discharges into Lake Kuhnamo (Figs. 1 and 2). Lake Vatianjarvi, Saravesi and Northern Leppavesi are situated further downstream. Southern Leppavesi discharges into Northern Leppavesi but remains uncontaminated by the effluents. N. Leppavesi flows into Lake Paijanne through Vaajakoski, where the mean flow (1961–79) was 155 m3/sec.
Lake Paijanne is the central lake in the Kymijoki watercourse. Its maximum length is 120 km, maximum depth 104 m, mean depth 17 m (Fig. 3) and its level is regulated by hydroelectric plants. Its northern and central parts are contaminated with pulp and paper mill effluents and domestic wastewaters. Diverse dilution gradients can be found within the lake.
BOD7 and NaLS analyses indicate the effect of pulp mill effluents on the different water bodies (Granberg, 1977). The effluent load is highest in Lake Kuhnamo and Saravesi (Table 1). A rising trend was observed in the effluent load of the pulp mill in Aanekoski in 1977–79.
The oxygen concentration was usually less than 5 mg/l in the hypolimnion of Lakes Kuhnamo, Vatianjarvi and Saravesi during periods of stagnation as well as in N. Leppavesi during the summers of 1978 and 1979. In S. Leppavesi the oxygen concentration was ca. 8 mg/l.
The degree of damage to the fishery is estimated to be 100 percent above the Kuusankoski rapids (Fig. 1) and between 40 and 70 percent in Lakes Saravesi and N. Leppavesi. Furthermore, the effluents affect the flavour of the fish from this watercourse.
Brown trout parr of between 11.6 and 16.2 cm length were brought from fish-breeding establishments near the study area and were placed in nylon netting cages. In N. and S. Leppavesi the fish were tested at the depths of 2 and 15 m; in Lake Vatianjarvi at the depth of 2 m only, because of the poor water quality. A test time of seven days was used. The test was carried out in October 1977, and in March and June 1978. Altogether 225 fish were tested (Nyronen and Hakkari, unpubl.).
In 1977–79 4 493 brown trout smolts of average length 18–20 cm were marked with Carlin tags and stocked in different places in the Aanekoski watercourse. Fish were marked and stocked in groups of about 500 fish. Spring and autumn stockings were made into N. Leppavesi during three successive years but into S. Leppavesi, Lake Kuhnamo and Lake Saravesi only one autumn stocking was made in 1977 (cf. Fig. 1). Thus 1 500 marked fish were stocked in spring and 2 993 in autumn.
The results of the stockings have been calculated from recaptures that were made up to the end of the year 1981.
The seven day tests of brown trout parr gave the following results expressed in percentages:
| L. Vatianjarvi | N. Leppavesi | S. Leppavesi | ||||||
| Alive | Dead | Alive | Dead | Alive | Dead | |||
| Autumn 1977 | 100 | 0 | 100 | 0 | 90 | 10 | ||
| Winter 1978 | 80 | 20 | 100 | 0 | 100 | 0 | ||
| Summer 1978 | 73 | 27 | 100 | 0 | 100 | 0 | ||
The results were examined with the Fisher's exact test (Siegel, 1956). The parr survived slightly significantly better in Lake Leppavesi than in Lake Vatianjarvi. No statistical difference was found between the results of epilimnion and hypolimnion in Lake Leppavesi. It can be stated that the water quality of Lake Vatianjarvi was too poor for young brown trout, but in Lake Leppavesi it was good enough for the survival of these fish.
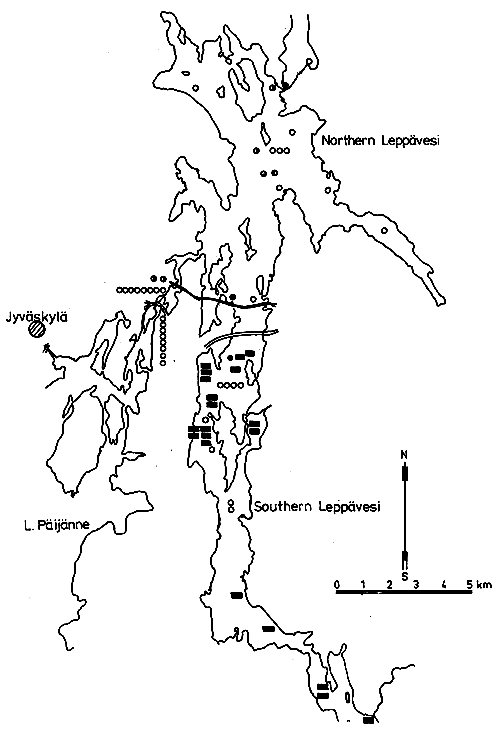
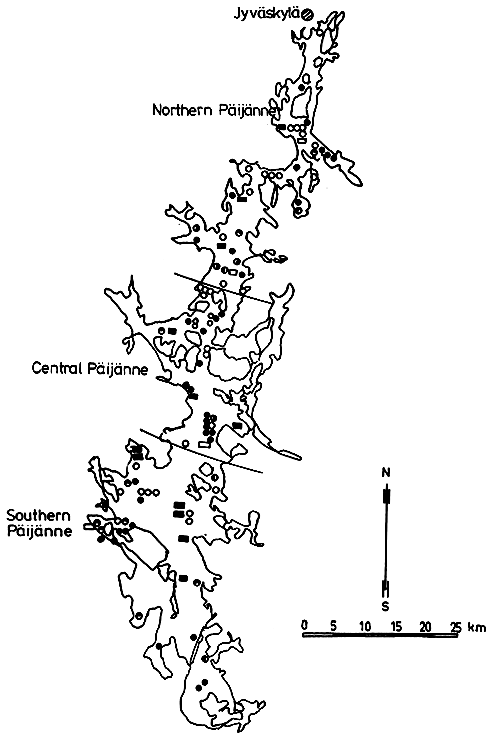
Fish were found to migrate down the watercourse (Figs. 2 and 3) and the most distant recaptures were made 120 km from the stocking area. These migrations seemed to be much longer than those undertaken by brown trout in Lake Saimaa, eastern Finland or Baltic trout (Salmo trutta m. trutta (L.)) (Toivonen, 1977; Toivonen and Ikonen, 1978; Bertmar, 1979).
Only 28 percent by weight of the recaptured fish were fished in the stocking area between Aanekoski and Vaajakoski, 26 percent in northern Paijanne, 25 percent in central Paijanne and 21 percent in southern Paijanne. Thus, about 50 percent of the catch was captured at a distance of 40 km or more from the stocking sites.
Only 19 percent of the recaptures of fish stocked into polluted areas were made at the stocking sites. By contrast, 63 percent of fish stocked in the autumn into unpolluted areas of S. Leppavesi were recaptured at the stocking site. However, autumn stockings into Lakes Kuhnamo and Saravesi failed. Many fish were either dead or in poor condition when they were found and some marked fish were found dead on the shores of this polluted area.
The catch per 1 000 smolts was 6.2–145.3 kg from spring stockings and 0–37.8 kg from autumn stockings (Table 2). Most recaptures were made during the first three years after tagging. The percentage return by number of marked fish was 1.6–14.2 for spring stockings and 0.2–6.4 percent for autumn stockings.
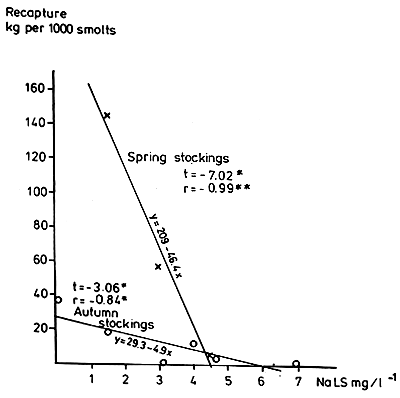
Regardless of the small sample, correlations between the NaLS concentration (mg/l) at the stocking site during stocking (x) and the recaptures of each marking group (kg/1 000 smolts; y) were as follows:
Spring stockings:
| y | = | 209-46.4 x |
| n | = | 3 |
| t | = | -7.02x |
| r | = | -0.99xx |
Autumn stockings:
| y | = | 29.3-4.90 x |
| n | = | 6 |
| t | = | -3.06x |
| r | = | -0.84x |
The recapture rate increased when the NaLS concentration decreased. The regression lines for spring and autumn stockings were, however, quite different.
No statistically significant differences in growth rate were found between sites or times of stocking, mainly because most of the growth takes place in Lake Paijanne. Growth in this system was similar to that of brown trout in Lake Saimaa (Seppovaara, 1962).
Pollution and the concentration of dissolved oxygen (DO) were considered to be important factors affecting the success of stocking. Because the annual 50- and 5-percent DO values should be 9 mg/l and 5 mg/l respectively for resident populations of salmonids (EIFAC, 1973), the failure of stockings in Lakes Saravesi and Kuhnamo was probably due to the low oxygen concentration. In these areas only, DO remained below 5 mg/l for longer than the required 5 percent. However, no correlation was found between the DO of the hypolimnion during the winter stagnation and the catch of each marked group.
The toxicity of pulp mill effluents is known to increase as DO decreases. Thus organic and inorganic sulphur and chlorine compounds, resinous acids and slime toxicants connected with the effluents may have affected the environmental conditions of those lakes. For example, Sprague and Drury (1969) noted a moderate avoidance by trout of bleach kraft mill effluent throughout the sublethal range of 10–100 000 ppm. Bleach effluents are also released by Aanekoski pulp and paper mills and the load from the pulp mill was particularly high at the end of 1978 and in 1979. At that time stockings were not successful in N. Leppavesi. It is obvious that if the cage tests had been carried out in 1979, the mortality in N. Leppavesi would have been higher than it was in 1977–78.
Although brown trout do migrate downstream in the watercourse even under natural situations, the avoidance of polluted conditions and movement to areas providing better water quality may partly explain such migrations (Hoglund, 1961). In fact, stocked fish stayed longer near the area of stocking in S. Leppavesi than in N. Leppavesi. The winter oxygen concentration of the former was 2 mg/l higher than that of the latter.
According to studies carried out by the Finnish Game and Fisheries Institute, brown trout stockings give better results in spring than in autumn in Finland - an observation also made in this study. The average catch during the experiment was lower than that usually made from brown trout stockings in central Finland, about 146–263 kg/1 000 smolts (Sumari, 1982, unpublished information), although some further recaptures from the latest stockings can be expected.
The purchase value of the stocked smolts was 16 251 Fmk in 1981. The value of the catch from spring stockings was 3 141 Fmk and from autumn stockings 1 110 Fmk, a total of 4 251 Fmk, at commercial prices. This is only 26 percent of the purchase value of the smolts.
Bias connected with recaptures have been estimated in Finland by Sormunen (1975) and Toivonen (1977), who concluded that the catch of trout has to be multiplied by 1.5–1.7 in order to get the real catch. Thus the real value of the catch may be as much as 40 percent of the purchase value.
These results indicate that damage to local fisheries through pollution cannot be entirely compensated for by stocking with brown trout.
Bertmar, G., 1979 Home range, migrations and orientation mechanisms of the River Indalsalven trout, Salmo trutta L. Rep.Inst.Freshwat.Res., Drottningholm, (58):5–26
EIFAC, 1973 Water quality criteria for European freshwater fish. Report on dissolved oxygen and inland fisheries. EIFAC Tech.Pap., (19):11 p. Issued also in French
Granberg, K., 1977 Limnological studies of the watercourse of Aanekoski, central Finland, in 1977. Rep.Hydrobiol.Res.Cent.Univ.Jyvaskyla, (96):20 p. (in Finnish, English summary)
Hoglund, L.B., 1961 The reactions of fish in concentration gradients. A comparative study based on fluviarum experiments with special reference to oxygen, acidity, carbon dioxide and sulphite waste liquor (SWL). Rep.Inst.Freshwat.Res., Drottningholm, (43):1–147
Seppovaara, O., 1962 Zur Systematik und Okologie des Lachses und der Forellen in den Binnengewassern Finnlands. Ann.Zool.Soc.Vanamo, 24(1):1–86
Siegel, S., 1956 Nonparametric statistics for the behavioral sciences. New York, McGraw Hill, 312 p.
Sormunen, T., 1975 Kalataloussaation Suomenlahdella suorittamien meritaimenmerkintojen tuloksia. Kalamies, 1975(4):4–5 (in Finnish)
Sprague, J.B. and D.E. Drury, 1969 Avoidance reactions of salmonid fish to representative pollutants. Adv.Water Pollut.Res., (4):169–79
Toivonen, J., 1977 Jarvilohi ja jarvitaimen Saimaan alueen hoitokaloina. Kalamies, 1977(9):1–3 (in Finnish)
Toivonen, J. and E. Ikonen, 1978 Havsoring i Finland. Fiskeritidsk.Finl., (22):104–9
Table 1 Biological oxygen demand (BOD) and lignin (NaLS) values (mg/l) in Lakes Kuhnamo, Saravesi and N. and S. Leppavesi in spring and autumn 1977–79
| Kuhnamo | Saravesi | N.Leppavesi | S.Leppavesi | |||||
| BOD7 | NaLS | BOD7 | NaLS | BOD7 | NaLS | BOD7 | NaLS | |
| 1977 | ||||||||
| Spring | 3.6 | 2.3 | 2.8 | 0.7 | 2.5 | 1.5 | - | - |
| Autumn | 3.9 | 4.0 | 3.5 | 3.2 | 1.3 | 1.5 | - | 0.1 |
| 1978 | ||||||||
| Spring | 4.5 | 6.5 | 2.3 | 5.0 | 1.7 | 3.0 | - | 0.1 |
| Autumn | 7.3 | 9.0 | 5.7 | 9.5 | 3.1 | 7.0 | - | - |
| 1979 | ||||||||
| Spring | 2.4 | 4.2 | 2.3 | 3.8 | 2.7 | 4.5 | - | - |
| Autumn | 7.8 | 10.0 | 3.8 | 8.1 | 2.4 | 4.7 | - | - |
Table 2 Yearly recaptures in Finnish lakes
| Stocking date | Year of recapture | Total catch | Average weight × ± SD (kg) | Average increase of weight (kg) | Kg/1000 smolts | % of recapture | ||
| No. | kg | |||||||
| Northern Leppavesi | ||||||||
| 6/6/77 | 1977 | 11 | 1.47 | ** | 0.16 ± 0.12 | |||
| 1978 | 42 | 28.94 | 0.69 ± 0.29 | 0.56 | ||||
| 1979 | 14 | 25.81 | 1.84 ± 0.81 | 1.15 | ||||
| 1980 | 2 | 7.60 | 3.80 | 1.96 | ||||
| 1981 | 2 | 8.85 | 4.43 | 0.63 | ||||
| Total | 71 | 72.67 | 145.3 | 14.2 | ||||
| 7/9/77 | 1978 | 5 | 2.36 | 0.47 ± 0.12 | ||||
| 1979 | 2 | 1.68 | 0.84 | 0.37 | ||||
| 1980 | 2 | 5.45 | 2.73 | 1.89 | ||||
| Total | 9 | 9.49 | 19.0 | 1.8 | ||||
| 10/5/78 | 1978 | 12 | 2.62 | ** | 0.26 ± 0.15 | |||
| 1979 | 22 | 15.46 | ** | 0.77 ± 0.48 | 0.51 | |||
| 1980 | 6 | 11.24 | 1.87 ± 0.79 | 1.10 | ||||
| Total | 40 | 29.32 | 58.6 | 8.0 | ||||
| 20/10/78 | 1979 | 1 | 0.75 | 0.75 | ||||
| Total | 1 | 0.75 | 1.5 | 0.2 | ||||
| 6/6/79 | 1979 | 4 | 0.86 | 0.22 ± 0.18 | ||||
| 1980 | 4 | 2.25 | 0.56 ± 0.13 | 0.34 | ||||
| Total | 8 | 3.11 | 6.2 | 1.6 | ||||
| 17/10/79 | 1980 | 3 | 0.93 | 0.31 ± 0.22 | ||||
| 1981 | 2 | 0.93 | 0.47 | 0.16 | ||||
| Total | 5 | 1.86 | 3.8 | 1.0 | ||||
| 134 | 117.20 | |||||||
| Southern Leppavesi | ||||||||
| 6/9/77 | 1977 | 5 | 0.43 | 0.09 ± 0.01 | ||||
| 1978 | 18 | 4.05 | *** | 0.31 ± 0.24 | 0.22 | |||
| 1979 | 6 | 4.43 | 0.74 ± 0.42 | 0.43 | ||||
| 1980 | 2 | 6.00 | 3.00 | 2.26 | ||||
| 1981 | 1 | 4.00 | 4.00 | 1.00 | ||||
| Total | 32 | 18.91 | 37.8 | 6.4 | ||||
| Lake Kuhnamo | ||||||||
| 7/9/77 | 1977 | 10 | 0.76 | 0.08 | ||||
| 1978 | 3 | 0.71 | 0.24 ± 0.23 | 0.16 | ||||
| 1979 | 2 | 0.50 | * | 0.50 | 0.26 | |||
| 1981 | 1 | 4.10 | 4.10 | |||||
| Total | 16 | 6.07 | 12.1 | 3.2 | ||||
| Lake Saravesi | ||||||||
| 7/9/77 | 1978 | 1 | 0.2 | |||||
* The weight of one fish unknown
** The weight of two fishes unknown
*** The weight of five fishes unknown

Fig. 1 The study area and stocking sites ( ) (See Fig. 3)

Fig. 2 Sites of recaptures (See Fig. 3)
 | Stocking date | Site of recapture |
| Northern Leppävesi | ||
| 6. 6.1977 |  | |
| 7. 9.1977 |  | |
| 10. 5.1978 |  | |
| 20. 10.1978 |  | |
| 6. 6.1979 |  | |
| 17. 10.1979 |  | |
| Lake Kuhnamo | ||
| 7. 9.1977 |  | |
| Southern Leppävesi | ||
| 6. 9.1977 |  | |
| Lake Saravesi | ||
| 7. 9.1977 |  | |
Fig. 3 Sites of recaptures

Fig. 4 Correlation between the NaLS concentration of the stocking place during stocking (x) and the recapture of each marking group (y)