![]()
![]()
![]()
| SUMMARY |
Crucial to the success of any coconut based farming system such as the integration of pastures, forages, cattle and coconuts is an understanding of the various environmental factors involved. Factors include: tree spacing and planting layout, competition for soil moisture and nutrients, shade and shade tolerance of forage species, the quality and quantity of light passing through the tree canopy, the nitrogen economy and nutritive value of shaded pastures, the reduction in pasture area and yield, fallen fronds, trampling and soil compaction, pests and cattle damage to young trees. The influence of rainfall and soil moisture levels on coconut yields and the effects of the coconut canopy on light penetration are emphasized. The level of shade is shown to be the most significant factor determining the output from pastures grown in plantations and the various factors affecting degree of light transmission are reviewed. Pasture species are ranked according to their degree of shade tolerance and herbage production is shown to be inversely proportional to tree density (and light transmission percentage) i.e. pasture production is reduced under coconuts compared to open areas. The effect of shade on the nutritive value of forage species, the effects of fallen fronds and soil compaction on pasture yields, cases of some species exhibiting higher yields under shade than in full sunlight and the problem of cattle damage to young trees are examined. Tree spacing and optimal densities for monocrop and intercropped coconuts are mentioned. |
Certain environmental factors play an important role in the pasture-cattle-coconut system, as discussed below.
When plants are grown together in a community they will affect each other and there will be ‘interference’ or ‘competition’ (Harper, 1961). According to Beets (1982) competition results from the reaction of one plant upon the environmental physical factors as well as the effect of the modified factors upon its competitors. The growing plants, no matter how close, will not compete as long as the soil water content, nutrient level and the amount of light are in excess of their needs. When the availability of a single factor falls below the plants combined demands competition begins (Clements et al., 1929; Connor, 1983; Donald, 1963). Vandermeer (1989) defines competition or interference as the process in which two individual plants or two populations of plants interact such that at least one exerts a negative effect on the other (Facilitation is where the effect is positive rather than negative). Competition within a plant community depends upon:
resources level supply (soil nutrients, moisture and solar radiation);
nature of the plant environment with specific reference to: needs of individual plants, plant population, spacing methods applied, etc.
Competition is likely to occur above ground as a shelter effect (reduction in wind speed) and as a shading effect (reduction in radiation flux, see Section 2.3) and below ground as a root system overlap (Beets, 1982; Ong et al., 1991). In general, the degree of overlap between different root systems and their spacing distribution will determine the competition intensity (Cable, 1969; Trenbath, 1975). However, Gillespie (1989) in his paper on the modelling of nutrient flux and interspecies root competition in agroforestry interplantings, suggests that root competition is a complex combination of soil supply and plant uptake mechanisms. Snaydon and Harris (1981) indicate that plant interactions below ground are normally more intense than those above ground. In Kenya, Torquebiau and Akyeampong (1994) in assessing the effects of different degrees of shading on beans, maize and bananas, were able to separate the effects of shade and below-ground root competition.
According to Huxley (1985), a key to understanding the biological potentials and restraints of combining tree crops and pasture species, and the environmental responses of the various components, is the tree/crop interface (see Figures 15a, b and c). Connor (1991) suggests that once the performance of the component species is defined across the tree/crop interface then various simulation models can be developed to evaluate various options and the cost-benefit analysis of alternatives. Samra et al. (1993) modelled the competition of paired columns of Eucalyptus on interplanted grass.
Successful integration of the pasture-cattle-coconut production system includes both the main crop (coconut) and the intercrop (pasture) as important components. The effects on coconut palm productivity must be considered when choosing the pasture species (local or exotic). As under most young and mature coconut stands there is sufficient light, moisture and nutrients encouraging weeds; intercropping aims to substitute a second crop which has economic value. The available growth factors determine the highest production level, while the intercrop choice and the management system determines their relative contribution to the total production per unit area.
If the intercrop competes too strongly with the main crop, its yields will be at the expense of the latter. The aim must be to achieve a moderately high and well balanced nutrient-cycle level, thus facilitating a rapid return of nutrients from herbage (augmented possibly by occasional small inputs of fertilizer) into soil organic matter (Javier, 1974b).
Figure 15. - The tree/crop interface (after Huxley, 1985).
a. A tree/crop interface - at its simplest.
b. Section through an extended tree/crop interface in which the tree species dominates the crop.
c. As for b. except the growth of the tree species is inhibited by a deep-rooted perennial grass.
Mohd. Najib (1991) stresses the more dynamic nutrient cycling process in the integrated system whereby forages are eaten by livestock and recycled in the form of excreta (see Figure 16). Even though only about 40% of the forages are excreted the faster turnover of nutrients can result in an improvement in main crop yield. Chemical analysis of soil under durian orchard, coconut and oil palm, where sheep were integrated (8 heads ha-1 grazing for approximately 5 hours daily) demonstrated that the organic matter content increased under grazing (see Table 12). Mohd. Najib (1990) noted that durian trees seemed to benefit from the presence of grazing sheep in the orchard and leaf nutrient status was improved. Biddappa et al. (1993) reported on the effect of a long term coconut-grass system on soil nutrients.
Figure 16. - Model of nutrient relationship in livestock - tree cropping system (Mohd. Najib, 1991).
Table 12. - Chemical analysis of soil under mature coconuts sampled every 24 weeks (Mohd Najib, 1991)
| Sampling Time | Organic C (%) | pH (1:2.5 H2O) | Total N (%) | Soluble P (ugkg-1) | K | Exchangeable Ca (meq/100g) | Mg | |
| 1st | Grazed | 1.25 | 4.1 | 0.14 | 7.6 | 0.47 | 0.28 | 0.10 |
| Ungrazed | 0.71 | 3.7 | 0.08 | 4.1 | 0.32 | 0.23 | 0.12 | |
| 2nd | Grazed | 1.25 | 4.5 | 0.12 | 9.2 | 0.49 | 0.31 | 0.27 |
| Ungrazed | 0.74 | 3.8 | 0.07 | 4.6 | 0.35 | 0.27 | 0.17 | |
| 3rd | Grazed | 1.44 | 4.7 | 0.12 | 7.2 | 0.44 | 0.30 | 0.18 |
| Ungrazed | 0.75 | 3.8 | 0.08 | 4.0 | 0.35 | 0.24 | 0.16 | |
The farmer, when attempting to successfully integrate cattle and coconuts, must be aware of the importance of the level of soil nutrients and moisture. When soil fertility is low, attempts to produce large quantities of fodder may reduce copra yields (Payne, 1985). Whiteman (1980) suggests that, unless soil is extremely fertile and all nutrients are in excess of the demands of the tree crop, higher yields are usually obtained with clean weeding (generally impractical because it leads to erosion; Whiteman et al., 1974). In most cases any understorey vegetation such as weeds, crops and natural or sown pasture, compete with the coconut palms for nutrients and water. Even though grazing animals recycle nutrients in a grazed pasture, a certain proportion of them will be immobilized in the standing pasture biomass, while others will be removed in animal products. Vicente Chandler et al. (1974) estimated that although a mature cow produces about 25 kg of faeces and 9 kg of urine day-1 (containing approximately 71.3 kg of nitrogen, 18 kg of phosphoric acid and 58 kg of potash year-1) only about 80% of the nutrients consumed are excreted (Chen, 1984). Berges et al. (1993) quote different figures from a study undertaken in a Philippine plantation where one animal returns in one year: 4,200 kg manure and 1,000 kg urine which corresponds to 21 kg nitrogen, 17 kg phosphorus and 17 kg potash). Droppings are unevenly distributed and some nutrients are lost through volatilization and surface runoff. Nutrients available from animal excretion are unlikely to be sufficient for pasture maintenance. Therefore sufficient fertilizer must be applied to meet the needs of a productive pasture if nut yield is to be maintained (Payne and Smith, 1975; Whiteman, 1980). However, the economics of fertilizer application must be carefully assessed (Payne, 1985; Rodrigo, 1945).
Humphreys (1991) stresses that the yield of plantation crops may be positively or negatively affected by the pasture system, depending on the nature of the interference which develops and the net effect on the crop environment. Interference may occur through modifications to the availability of nutrients and moisture to tree roots, or through allelopathy (Ong, 1993; Wong, 1964) defined by Rice (1974) as the direct or indirect effect of one plant on another through the production of chemical compounds that escape into the environment. Smith (1990) suggests that allelopathy occurs widely in plant communities and is postulated to be one mechanism by which weeds interfere with crop growth. Coelho (1993) recently reported on the allelopathic effects of extract solutions of Eragrostis plana plants on the germination of white clover, birdsfoot trefoil and annual ryegrass. The root extract inhibited completely germination of the three species! Although a number of studies have been made on allelopathic effects (e.g. Bhatt and Todaria, 1990; Gressel and Holm, 1964; Guenzi et al., 1967; Hollis et al., 1982; Horsley, 1991; Igboanugo, 1988; Muller, 1969; Putnam and Duke, 1978; Melkania, 1986; Stowe, 1979) this subject is not dealt with further in this book.
Positive gains from the N fixation of leguminous cover crops are reflected in increased growth of rubber (Broughton, 1977) and oil palm (Agamuthu et al., 1981). Ochs et al. (1993) noted the effects on the coconuts of interplanting tree legumes with coconuts on poor soils in the lvory Coast (see Table 13). Reynolds (1981) and Rika et al. (1981) have reported on the positive effects on coconut yields of fertilized grass-legume pastures and Escalada and Gerona (1986) stressed the importance of fertilizer applications in maintaining para grass and centro pasture productivity under coconuts in the Philippines, suggesting that fertilizer application is essential for integrated cattle/coconut operations. The gains from N fixation are also associated with the accumulation of a pool of nutrients in the pasture which are slowly released to the roots of the plantation crop. The content of legume in the pasture and its mineral nutrition will condition the extent of the N increment. On the other hand monospecific grass swards may cause a reduction in coconut yield, especially under conditions where the fertilizer needs of the pasture are not met. These effects are associated with particular species, thus in Sri Lanka the yield of nuts with Brachiaria brizantha or B. miliiformis showed a positive trend after 10 years and was twice that of the coconut yield where P. maximum was grown (Ferdinandez, 1972). The difference has been attributed to the greater yield of P. maximum, however, interference is not simply related to grass yield; in another Sri Lankan study higher yielding grasses gave less reduction in the girth of rubber than lower yielding grasses (Waidyanatha et al., 1984). The effects of pastures on coconut yields are covered in more detail in Chapter 7.
Table 13. - Effect of intercropped legumes on the N contents (Frond 14) of PB 121 coconuts (Ochs et al., 1993)
| Treatments | Nitrogen % |
| Grown alone | 1.79 |
| Casuarina | 2.11 |
| A. mangium | 2.17 |
| A. auriculiformis | 2.24 |
A study of management strategies (such as fertilizer application and different grazing and cutting regimes designed to alter the competitive balance between grasses and trees) in a temperate area silvopastoral system (sheep grazing pastures under Prunus avium) indicated that the same number of grazing days could be achieved with 50 percent less fertilizer if it were applied more frequently. Lower N rates could be less detrimental to tree growth and final timber quality, while reducing the competition between the grass and trees for N and water at critical times of the year (Campbell, 1989)
If soil moisture levels become critical during even a part of the year then coconut growth and yields can be influenced by competitive intercrops. According to Humphreys (1981) associations between trees and pastures are dominated by competition for water in subhumid areas, especially if the trees have roots in the upper soil layers, as does the coconut palm.
Scanlon and McKeon (1993) described a pasture production model modified to take account of the effect of tree water use on pasture production in the woodlands of northern Australia. Scanlon et al. (1992) noted that the effects of trees on the herbaceous understorey are related closely to differences in the amount and distribution of rainfall. Dijkman (1951) demonstrated the difference between dry season soil moisture content under clean weeded rubber and rubber with a cover crop (see Table 14).
Table 14. - Effect of covers on soil moisture content under rubber during dry season, east Java (Dijkman 1951 quoted by Williams and Joseph 1976)
| Soil Depth (cm) | % moisture | |
| with cover crop | clean weeded | |
| 0–5 | 2.2 | 3.2 |
| 15–20 | 3.4 | 9.7 |
| 25–30 | 4.3 | 3.6 |
Wilson and Ludlow (1991) indicated that air relative humidity under a tree canopy is likely to be increased compared with that in the open or above a tree canopy; under artificial shade the maximum increase was about 6 percent over that in the open. Decreased radiation load under the shade of tree canopies should benefit the water relations of the pasture species. Leaf water potentials are higher in plants under shade than in full sun (Wong and Wilson, 1980). Evaporative demand will be greatly reduced in the shaded environment, e.g. under acacia trees (see Figure 17a) and soil water availability for the pasture will be maintained at a higher level than in the open (see Figure 17b) through the combined effects of less evaporation from the soil and lower transpiration rates of the pasture (Wilson and Wild, 1991). These effects may lessen the periods when growth of pasture is restricted by soil water deficits during the dry season. Eastham (1988) showed that the evapotranspiration losses from pasture were highest where tree spacing was widest and decreased as the pasture was more shaded by the tree canopy.
The effects of trees on pasture growth can range from strong competition to stimulation (Scanlon et al., 1992). Thus, according to Atta-Krah (1990) and Torres (1983) leguminous fodder trees in rangeland areas of Africa have been shown to have effects on both soil fertility (see section 2.4) and soil moisture. Singh and Lal (1969) demonstrated that the nutrient content of soils under Prosopis cineraria trees was higher than in open sites in arid regions of India. Poschen (1980) reported crop yields under Acacia albida to be 56 percent higher than in areas without trees, and Le Houerou (1978) in Botswana, where potential evapotranspiration was reduced by 50 – 70 percent under shade, indicated that Panicum maximum remains green 6 weeks longer at the beginning of the dry season. A higher herbage production under trees when compared with open grassland during drought years was observed in California by Frost and McDougald (1989). Beneficial effects of trees on pasture growth have also been reported for humid zones. Jagoe (cited by Masefield, 1957) showed that in Malaysia Axonopus compressus gave higher yields and contained higher protein when grown under Samanea saman (raintree) and two other leguminous trees, than when grown under non-leguminous trees or in the open. Similar results were found by Daccarett and Blydenstein (1968) in Turrialba, when analyzing the relationship between Erythrina poeppegiana, Pithecellobium (or Samanea) saman, Gliricidia sepium and Cordia alliodora and the Panicum maximum - Paspalum fasciculatum - Homolepis aturensis - Digitaria decumbens pasture growing underneath. None of the trees reduced dry matter production significantly, in relation to the unshaded control plot. Protein percentage of the herbage under Erythrina was significantly higher than under any other species. Belsky (1992) reporting on the effects of isolated savanna trees on forage yield and quality in Kenya, indicated that the concentration of nutrients in the herbaceous forage increased from open grassland to the tree base (with a slight decrease in digestibility). Similar increases have been found under tree canopies in California (Kay and Leonard, 1980), Mexico (Farrell, 1984) and Australia (Wilson et al., 1990) and probably result from higher nutrient concentrations in the soil solution. Soil moisture levels were highest under the tree canopies. Differences in soil compaction and shade were also given as factors influencing plant nutrient concentrations. However, Belsky et al. (1993) noted that the beneficial effects of savanna trees on their understory environments appear to diminish with increasing livestock utilization. This subject is considered in more detail in following sections.
The close relationship between rainfall and coconut yield has been demonstrated in Trinidad by Smith (1966). There is an important correlation between coconut yields and dry season rainfall (and integrated soil water deficit) in the 1–2 year period preceding harvest (see Figure 18). Shepherd (1926) also showed in Trinidad that there is a positive correlation between rainfall over a six month period and the amount of copra one year later. In Malaya, rainfall in the first three months when nuts were developing determined the size of the crop a year later (Cooke, 1953). In Sri Lanka Peiris (1993) noted that rainfall during January/February is most influential on total coconut yield.
Murray (1977) suggests that when rainfed palms undergo a prolonged drought, the effect can persist for up to 2.5 years as shown in Figure 19a. In addition to the reduction in numbers of nuts by drought, the amount of copra per nut is also reduced (Figure 19b), so that these two factors combined seriously reduce the total crop ha-1. As Patel and Anandan (1936) pointed out, the inflorescence is initiated some 16 months before the spathe opens. Severe drought at this period may kill the growing point, causing the inflorescence to abort which will affect production of nuts up to 28 – 30 months later. Although the amount of copra nut-1 is reduced during the drought period it increases sooner (than the number of nuts) as shown in Figure 19b.
As illustrated in Figure 20 the problem of moisture deficit and competition between coconut and pasture will be biggest in low rainfall areas and areas with long dry seasons, but cases have been reported where improved infiltration due to improved soil structure with intercropped pastures have led to better water relations for the tree crop after a few years (de Silva, 1961). Mathew and Hemachandra (1990) suggest that ploughing just before the onset of the monsoon increases soil moisture conservation; ploughing to a depth of 20 cm increases moisture penetration to as deep as 60 to 90 cm. Also, as shown by Kasturibai et al. (1988) some palms (West Coast Tall) have a better ability to conserve water under conditions of stress than others (hybrid dwarf × tall) and thus may be more tolerant to drought. Studies in Kerala by Jayakumar et al. (1988), where West Coast Tall coconuts depend mainly on stored soil moisture for meeting their water requirements during the dry season (which can last for 17 to 21 weeks), demonstrated that the mean consumptive use of water by 6 year old coconut palms, with a leaf area index of 2.4 during the dry period from November 1986 to May 1987, was of the order of 3.3 mm day-1 and ranged from 2.7 mm day-1 to 4.1 mm day-1. Even in high rainfall areas such as Kerala (where annual precipitation is above 3000 mm), the frequent occurrence of drought due to erratic distribution of rainfall, long dry spells and poor moisture retention in the sandy soils, can result in poor nut yields. This emphasizes the significance of effective rainfall not simply the total rainfall (Ramadasan et al., 1991; Nambiar and Ayer, 1991). Various agrometeorological factors and their relationship to coconut production were reviewed by Prasada Rao (1991).
Figure 17. - Evaporation and available water content of the soil under the canopy of a plantation of Acacia caven (80% ground cover) and in the full sun (adapted from Ovalle and Avendano, 1988 by Wilson and Ludlow, 1991).
Figure 18. - The relationship between previous soil water status and copra yield (Smith, 1966).
Figure 19. - The effect of drought on (a) number of nuts produced per picking, and (b) weight of copra per nut in grams (Murray, 1977).
Figure 20. - Evapotranspiration and rainfall data in low, medium and high rainfall areas in Barbados (Williams and Joseph, 1976).
Rajagopal et al. (1986) reported the response of two genotypes (West Coast Tall <WCT> and Chowghat Orange Dwarf <COD> × WCT) to low and high drought intensities and the effects on leaf characters and yield attributes. The impact of moisture stress on yield related processes like stomatal regulation of dry matter partitioning also has been investigated (Rajagopal et al., 1989). A soil water deficit of 110 mm was found to be the critical level at which coconut suffered most due to moisture stress in sandy loam soil, as indicated by stomatal closure, a sensitive indicator of plant stress. Exposure of palms to field stress for 16 or 24 days during summer led to a reduction in the vegetative dry matter by 15% and 18% respectively whereas the reproductive dry matter was reduced by 20% and 22% respectively, as compared to non-stressed i.e irrigated palms. The number of days taken for unfolding of the spindle leaf and spathe was more during ‘dry’ than during ‘wet’ season both in WCT and COD × WCT palms, which reflects on the role of soil moisture availability on these important processes.
When three genotypes namely WCT, WCT × COD and COD × WCT were compared under irrigated and rainfed conditions, the partitioning of dry matter into husk, shell and copra was affected due to stress (rainfed) more in COD × WCT than in the other two genotypes, thereby revealing the drought susceptible nature of COD × WCT and the relative drought tolerance of WCT × COD (Ramadasan et al., 1991). Rajagopal et al. (1991) described the physiological and biochemical criteria for breeding for drought tolerance in coconut while Bhaskara Rao et al. (1991) evaluated the drought tolerance and productivity of 87 released coconut hybrids. From a comparison of the data for 10 cultivars at the CPCRI, differences in drought tolerance are apparent, as indicated by leaf character (drooping/drying), bunch condition and shedding of buttons/immature nuts (Table 15). When exposed to very severe moisture stress coconut palms exhibit adverse effects such as dry and broken leaves, poor spathe development and almost empty spikes caused by heavy shedding of buttons (Ramadasan et al., 1991). Pomier and de Taffin (1982) developed a drought index (or index of tolerance to drought: No. of dry leaves/No. of living leaves × 100% ) to assess degree of sensitivity of different coconut varieties to drought, demonstrating that the hybrid PB-121 was very drought tolerant in Ivory Coast. Prasada Rao (1985) suggested that the effect of drought on coconut palms was seen when the aridity index exceeded 65 percent.
The water requirement of coconut palms has been studied by a number of workers (Nair, 1989). The rate of ET depends to a large extent on the amount of water available in the growth medium. Studies conducted at the CPCRI, Kasaragod (Joshy et al., 1986) showed an initial ET of 4 mm day-1 after rainfall, dropping to 2.4 mm day-1 (mean of 7 days) and 2.2 mm day-1 (mean of 15 days) later. Joshy et al. (1986) suggest that the ET demand of coconut is largely met by the 0–70 cm soil layer and the 90–130 cm layer (and lower layers) make little contribution unless drought conditions prevail. It was suggested that water applied at the rate of 5 mm day-1 is adequate for coconuts grown on these sandy loam soils. In Brazil, Cintra et al. (1992) noted that Yellow Dwarf coconut varieties were considered to be the most promising for regions subjected to a water deficit, because of their deeper rooting abilities.
The favourable effect of dry season irrigation on coconut production is well documented - Nair, 1989; Nelliat and Padmaja, 1978; Padmanabhan, 1973; Venkitesan, 1973; Rajagopal et al., 1987. Bhaskaran and Leela (1977) demonstrated, over an 11 year period, a 74 percent increase in nut yield, through an increased production of female flowers and higher setting percentage (see Table 16). Nagaraj et al. (1988) demonstrated the economic viability of drip irrigation for coconut gardens.
In Sri Lanka, in the Intermediate Zone with annual rainfall ranging from 1270 mm to 2540 mm, coconut is known to be very sensitive to moisture stress, with crops in a given locality fluctuating within a wide range of as much as +/- 40% of the mean yield purely as a result of fluctuations in the incidence of rainfall (Abeywardena, 1979). Even in healthy palms Abeywardena and Mathes (1971) estimated that nearly two thirds of the potential crop is lost due to poor setting of nuts and/or immature nutfall largely resulting from moisture stress. Abeywardena (1979), reporting on an experiment started in 1973 to ascertain to what extent yield can be improved by providing water to palms during dry periods, showed that watering had a significant influence on total copra yield (see Table 17). Even though the annual rainfall in the area of the experiment ranged from 1,354 – 2,146 mm and was fairly well distributed (and the area was not considered a rainfall deficient area), Abeywardena concluded by suggesting that with an increase in the watering dosage he would expect a very substantial increase in copra yields. Liyanage and Mathes (1989) demonstrated the effect of irrigation on the establishment and early growth of coconut in the Dry Zone of Sri Lanka.
Table 15. - Effect of drought on leaves, bunches and nuts (after Nair, 1989)
| Cultivars | Leaves | Bunches | Nuts | ||||||
| Dry/Broken | Total | Drought Index* | Affected | Total | % | Fallen | Total | % | |
| WCT × COD | 6.4 | 29 | 22.1 | 7.6 | 14.3 | 53.1 | 39 | 135 | 28.9 |
| COD × WCT | 10.2 | 20 | 51.0 | 9.2 | 14.6 | 63.0 | 40 | 103 | 38.8 |
| LO × COD | 5.5 | 23 | 23.9 | 6.0 | 12.5 | 48.0 | 21 | 66 | 31.8 |
| WCT × GB | 2.5 | 21 | 11.9 | 9.0 | 13.5 | 66.7 | 33 | 105 | 31.4 |
| WCT × Fiji | 5.0 | 29 | 17.2 | 2.0 | 15.0 | 13.3 | 39 | 142 | 27.5 |
| WCT × SSG | 8.0 | 24 | 33.3 | 11.0 | 14.0 | 78.6 | 43 | 127 | 33.8 |
| WCT × Phil.Ord. | 0 | 24 | 0 | 12.0 | 17.0 | 70.6 | 40 | 134 | 29.8 |
| WCT × Kappadam | 7.0 | 23 | 30.4 | 10.0 | 15.0 | 66.7 | 12 | 77 | 15.7 |
| WCT × MOD | 11.0 | 17 | 64.7 | 10.0 | 11.0 | 90.9 | 18 | 50 | 36.0 |
| WCT | 6.8 | 23 | 29.5 | 6.0 | 13.0 | 46.1 | 23 | 101 | 22.8 |
| WCT (irrigated) | 0 | 28 | 0 | 0 | 13.5 | -- | 5 | 108 | 4.6 |
* Method of Pomier and de Taffin (1982).
Table 16. - Effect of irrigation1 on female flower production, setting percent and nut yield (after Nair, 1989)
| No. of female flowers produced palm-1 | Setting % | Nut yield palm-1 | ||||||
| Pre-irrigation | Post-irrigation | % Increase | Pre-irrigation | Post-irrigation | % Increase | Pre-irrigation | Post-irrigation | % Increase |
| 130.4 | 167.9 | 28.8 | 87.7 | 122.6 | 39.8 | 42.2 | 73.5 | 74.2 |
1 Basin irrigation once per seven days.
Salgado (1937) reported that in Ceylon a cover crop of Centrosema pubescens under mature coconuts rapidly produced a sharp decline in yield, which was alleviated by turning the cover into the soil in the dry season. Kennegieter (1970) suggested that the greatest scope for pasture development in Ceylon was in the 363,000 ha. of coconut palm lands receiving 2125 mm yr-1 of rainfall, for there would be no competition for moisture between coconut palms and pastures. Payne and Smith (1975) indicated that livestock should not be kept in coconut plantations in regions where the total rainfall is less than 1,500–1,700 mm and/or there is a long dry season, while Santhirasegaram (1964a) indicated that when total rainfall is more than 2000 mm and well distributed there is no problem in cattle/coconut systems, but when it is below 1625 mm (1750 mm according to Liyanage, 1985) there can be direct and detrimental competition between the coconut and forage crops for soil moisture. In areas where the total rainfall is marginal for cattle/coconut systems, young palms may be affected by the forage crop while mature palms remain unaffected (Ohler, 1969). Grazed forage has a less depressive effect on coconut yield than ungrazed forage (Ferdinandez, 1970a).
Table 17. - Influence of watering on total copra yield (Abeywardena, 1979).
| Treatment | Mean copra yield lb hectare-1 | % increase due to watering | ||||
| Favourable Conditions | Unfavourable Conditions | Favourable Conditions | Unfavourable Conditions | |||
| Control | .. | .. | 5,011 | 3,488 | -- | -- |
| Single dose weekly | .. | .. | 6,311 | 5,377 | 25.9% | 54.2% |
| Single dose fortnightly | .. | .. | 5,252 | 4,371 | 4.8% | 25.3% |
| Double dose fortnightly | .. | .. | 5,958 | 5,096 | 18.9% | 46.1% |
| Variance (F3, 15) ratio | .. | .. | 5.24* | 22.97*** | ||
| L.S.D (mean of smallest-and largest) | .. | 777 | 515 | |||
| Under relatively drier conditions, there was a considerable increase in copra yield due to watering. The highest response (54.2%) was for watering with the “single dose weekly”, the second highest (46.1%) for the “double dose fortnightly” and the lowest (25.3%) for the “single dose fortnightly”. Even under favourable weather conditions, there were appreciable responses, being 25.9% for the “single dose weekly”, 18.9% for the “double dose fortnightly” and 4.8 for the “single dose fortnightly”. | ||||||
Evans et al. (1992) note that where rainfall falls below 2,000 mm in the humid tropics there have been instances where competition for soil moisture by understorey pastures has reduced copra yield when compared with a bare fallow situation. In Vanuatu, where buffalo grass is fairly intolerant of dry conditions this is less of a problem; however other grasses, like Sabi grass or Koronivia grass, are more likely to compete for scarce moisture.
In an experiment where Pinus radiata was grown in association with pasture, Connor et al. (1989) noted the effects of trees on pasture productivity and pastures on tree growth, and in particular demonstrated that pasture removal (using herbicide) around the tree bole resulted in improvements in tree water status and increased wood production.
In India where the yield of coconuts was affected by a long dry season of up to five months (Krishna Marar, 1953) the elimination of weeds by regular cultivation resulted in yield increases from 10–47 nuts palm-1 year-1. In the seasonally dry coastal area of Tanzania on sandy soils receiving an average rainfall of 1100 mm Romney (1988) showed that the growth and early yield of coconut hybrid PB 121 was closely related to the size of the weed free circle and suggested that complete weeding should be carried out for palms older than 4 years. Figure 21 shows the weed free circle around a young oil palm in Malaysia (some of the lower fronds have been damaged by grazing sheep).
A feasibility study of coconut irrigation in Sri Lanka (Smith et al., FAO, 1984) indicated that coconut performs well in regions where annual rainfall exceeds 1,300–1,500 mm year-1 and is uniformly distributed. The monthly rainfall requirement is estimated to be 125–150 mm, although production is only adversely affected when rainfall drops below 50 mm month-1. Since this rainfall amount per month is considered the threshold below which damaging water stress occurs, it was recommended that supplementary irrigation be initiated when total rainfall for the preceding week is less than 15 mm. Conversely irrigation will cease when rainfall for the preceding week exceeds 15 mm.
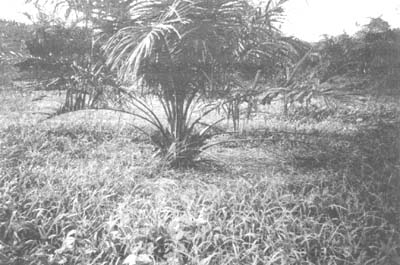
Figure 21. - Weed free circle around young oil palm, Malaysia.
A number of intercropping studies with tree crops such as eucalyptus (Eucalyptus tereticornis) and silk cotton (Ceiba petandra (L) Gaertn.) in India have demonstrated significant reductions in intercrop yields adjacent to the trees (and effects on tree growth) due to moisture competition (Malik and Sharma, 1990; Suresh and Vinaya Rai, 1991), but experiences vary. Suresh and Vinaya Rai (1991) showed that although fodder grass suppressed silk cotton tree growth during the period 7 – 11 months after planting, intercrops suffered no yield impairment during 6 rotations. This contrasts with the severe effects of eucalyptus on soil moisture extraction and crop yields. Table 18 shows the percentage yield reduction of mustard and wheat with distance from the eucalyptus tree line, confirming that this is not an appropriate tree species to grow close to crops. Khybri et al. (1992) demonstrated that trees influenced crop yields up to a distance of 5 m from the tree line. Chen (1991) suggests that additional research on soil moisture - forage - main tree crop relationships is urgently required.
Foale (1993) noted that the maximum functional leaf area in a plantation is strongly influenced by the intensity and duration of seasonal soil water-deficit. According to Foale (1993) and Coomans (1974) the optimum density of palms is primarily a function of available soil water!
Table 18. - Grain yield reduction (YR) with distance from eucalyptus tree line
| Distance (m) | YR (%) | ||
| Mustard | Wheat |  | |
| 0–2 | 98 | 77 | 88 |
| 2–4 | 89 | 57 | 73 |
| 4–6 | 38 | 24 | 31 |
| 6–8 | 9 | 12 | 11 |
| 8–10 | 1 | 2 | 2 |
| (0–10) | 47 | 34 | 41 |
When the canopy of one component of an association is set higher than others, the taller canopy is likely to utilize the greatest part of the light (Beets, 1982) and light penetrating the plant stand will be diminished through interception and absorption (Trenbath, 1981). It is also likely that the advantage is greater if leaves are horizontal rather than erect, since horizontal leaves intercept more of the total downward light flux per unit area of leaf than do erect leaves (Stern and Donald, 1982; Beets, 1982). If the shaded species is not extremely shade loving reduction in yield may occur. Shelton et al. (1987a) stress that the level of shade is THE most significant factor determining the output from pastures grown in plantations. Decreasing irradiance reduces the growth of pasture species (Ludlow, 1978; Smith and Whiteman, 1983a) and influences the outcome of competitive relations.
There is a considerable literature on the subject of the distribution of radiation in plant communities, and the influence of trees on light interception and the light environment in plantations (Anderson, 1964, 1966; Baldocchi et al., 1984; Begg and Cunningham, 1974; Carroll et al., 1990; Chen, 1989; Gay et al., 1971; Gilchrist et al., 1993; Granberg, 1988; Hale and Orcutt, 1987; Holmes, 1981; Horn, 1971; Jackson, 1983, 1989; Jackson and Palmer, 1972, 1979, 1989; Jahnke and Lawrence, 1965; Jones, 1985; Kuuluvainen and Pukkala, 1987; Lang et al., 1985; Ludlow, 1978; Matthews and Saffell, 1987; Newman, 1985, 1986; Norman and Welles, 1983; Palmer, 1977, 1993; Pech, 1986; Pukkala et al., 1991; Quesada et al., 1987; Reifsnyder, 1989; Reifsnyder and Darnhofer, 1989; Reifsnyder et al., 1971/2; Robinson, 1983; Thomas et al. 1991; Trenbath, 1981; Usher, 1970; Vandermeer and Meyrat, 1988; Varlet-Graucher et al., 1993; Whitfield, 1986; Wilson, 1991; Wilson and Ludlow, 1991). Dry matter production is closely linked to light interception and differences in yield between systems have been highly correlated with differences in light interception (Palmer, 1993, Robinson and Lakso, 1991). Vandermeer (1989) concludes that there are three variables which dictate the effective radiation intensity experienced by an understorey plant in a plantation:
The tree canopy influences both the quality and quantity of light reaching the understorey (Wilson and Ludlow, 1991).
As sunlight passes through the tree canopy in plantations its quality is altered because the leaves preferentially absorb the light in the 400 – 700 mm waveband. Blue and red light are reduced compared with green and far-red (Holmes, 1981). Because of the differential absorption of red and far-red light, the ratio of red to far-red (R/FR) falls (see Table 19). These spectral changes, perceived by plants through the phytochrome system, may induce marked morphogenetic changes in plants (Smith, 1982). Stem elongation can be promoted (Child et al., 1981) and tillering and branching inhibited (Deregibus et al., 1985; Casal, 1988; Thompson and Harper, 1988). Work with tree seedlings in a controlled environment (Warrington et al., 1988) indicated that the effect on stem elongation can be over and above that due to reduced light alone. It also appears that shade-intolerant species may show a greater stem elongation response to reduced red/far-red ratios than shade tolerant species (Smith, 1982). Wood (1969) described various techniques for evaluating turf grasses for shade tolerance.
Table 19. - Red/Far-Red ratios in full sun and under several plantation types (Wilson and Ludlow, 1991)
| Full Sun | Rubber | Old Coconut | Mature Rain Forest | |
| Immature | Mature | |||
| 1.20 | 1.07 | 0.62 | 1.03 | 0.43 |
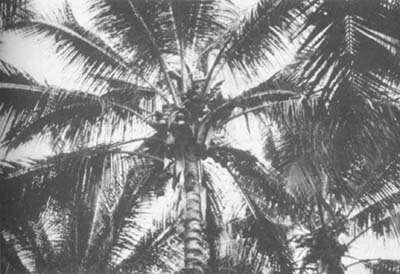
Studies on the pattern of utilization of solar energy in coconut plantations indicate there is a considerable variation in the interception of sunlight by palm canopies of different age groups (Nelliat et al., 1974). The degree of shading will vary with age and height, spacing, soil fertility and canopy characteristics of the coconut variety, being highest in closely spaced plantations and lowest in young or old, widely spaced plantations (Chen, 1989; Payne, 1985; Santhirasegaram, 1966d). Nair and Thomas Varghese (1976), Nair et al. (1974), and Nelliat et al. (1974) demonstrated that because of the heavy canopy produced from about the fifth to twentieth year of growth, low light levels reach the understorey for intercrop growth (see Figure 22). The range of light conditions can be summarized as follows:
| - | pre-bearing trees | (up to 5 years) | good light transmission |
| - | young trees | (5 – 20 years) | poor light transmission |
| - | mature trees | (over 20 years) | light transmission improving with age |
However, Sefania et al. (1982) suggest that from the point of view of intensive cropping and the interception of solar energy by the coconut tree canopy, the three phases are from 0–8 years, 8–25 years and over 25 years. The difference in light transmission through a 20 year old and 60 + year old coconut canopy is illustrated in Figure 23.
Figure 22. - Apparent shading of ground and light transmission in a coconut stand (Nelliat et al., 1974).
 |  |
| (a) 20 year old coconuts | (b) 60 + year old coconuts |
Figure 23. - Relative light transmission through 20 and 60 + year old coconut canopies.
Vandermeer (1989) suggests that these three stages of light transmission correspond to three stages of underplanting potential:
very young plantations in which ample space between trees permits understorey cultivation;
intermediate stage of plantation in which the canopies are well-developed but the trees are not very high, creating less than ideal conditions for underplanting;
mature plantations in which sufficient light enters the understorey to make conditions again suitable for underplanting.
These have been illustrated by Nair (1983) - See Figure 24.
Foale (1993) notes that the coconut palm undergoes a marked reduction in canopy size with age. “Light interception can be improved by increasing density, but only within the constraint of water supply on leaf area. Even so high density is effective for only a limited part of the life of a plantation as the individual crown size becomes smaller with advancing age beyond 20 to 30 years”. Foale et al. (1994) indicate that the shape of the coconut crown, and its ability to intercept light, goes through a distinct series of changes with age of the palm - five phases were identified.
Litscher and Whiteman (1982) using a stepwise multiple linear regression analysis of light transmission against age of stand, density and palm height showed significant relations with only two of the variables, namely density and height; the inclusion of stand age (X3 = age 9 – 19 years) did not significantly change the relationship because of the correlation between age and height (Y = 102.6 - 0.195X1 - 1.47X2 : R2 = 0:558 significant at P <0.01 where X1 = palm density 80 – 240 palms ha-1; X2 = palm height 4.0 – 14.5 m; Y = light transmission 46–70%). For light transmission values in coconut plantations in Malaita, Solomon Islands see Table 20.
Figure 24. - Illustration of the underplanting potential of a palm plantation at different stages of development: (a) very young plantation in which ample space between trees permits understorey cultivation; (b) intermediate stage of plantation in which the canopies are well-developed but the trees are not very high, creating less than ideal conditions for underplanting; (c) a mature plantation in which sufficient light enters the understorey to make conditions again suitable for underplanting (redrawn from Nair, 1983).
Arganosa (1991) indicated that a study was conducted in nine different coconut plantations in seven provinces in Visayas to determine the light regime and other microclimatological data under coconuts (Posas and Gerona, 1986). In another study in the Philippines, light intensities under the canopy of eight coconut cultivars and one hybrid were measured to determine the amount of sunlight reduction due to their canopies and the influence of palm characters on the degree of reduction (Barile and Sangalang, 1990). Sunlight reduction varied significantly among the different cultivars/hybrid especially in the period 11.30 – 12.30 with the cultivar Laguna having the biggest reduction at all periods of the day. The number of leaflets had positive and significant correlations with sunlight reduction at all times, with the lengths of fronds and petioles having significant correlations in late afternoon periods.
Table 20. - Number of coconut plantations in various light transmission classes in Malaita, Solomon Islands (Litscher and Whiteman, 1982)
| Transmission class (%) | ||||||
| 40–45 | 45–50 | 50–55 | 55–60 | 60–65 | 65–70 | 70 |
| 3 | 4 | 9 | 3 | 3 | 2 | 1 |
Note: Planting densities ranged from 80–240 palms ha-1, palm height 4–14.5 m, age 9–19 years.
Also the time of the day (and thus the angle of the sun rays) influences the amount of light passing through the coconut canopy. With the movement of the sun, and the movement of coconut fronds in the wind, light and shade patterns under the coconut trees are constantly changing. Using light meters and detailed sampling patterns it is possible to obtain typical values showing the effects of age, density and time of day on light transmission in coconuts (see Figure 25 and Table 21 and Chen, 1984). An experiment in the Solomon Islands where coconuts were thinned demonstrated the close relationships between palm density and light transmission percentage (see Table 22).
 | Note: Coconuts spaced at 7.5 m × 7.5 m and aged 16 years; light trasmission 56 percent in period, 1000 – 1400 hours. |
Figure 25. - Diurnal variations in the amount of light reaching the ground under coconuts in Kasaragod, India (Nair and Balakrishnan 1976).
Table 21. - Mean value of percentage of light transmission in coconut stands as affected by density, variety, age, height and time of day (Whiteman, 1980)
| Location | Density no. palms ha-1 | Age of stand (yrs) | Approximate height (m) | Time | Transmission % | Reference | |
| 1. | Bali | 100 | 60 | - | 1200 | 79 | Rika et al. (1981) |
| Indonesia | 120 | 30 | 10 | 0900 | 77 | Steel and Humphreys (1974) | |
| 1200 | 80 | ||||||
| 1500 | 61 | ||||||
| 2. | Fiji | 130 | (mature) | (tall) | -- | 90 (estm.) | Ranacou (1972) |
| 3. | India | 178 | 16 | -- | 1000–1400 | 56 | Nair and Balakrishnan (1975) |
| 4. | Jamaica | 560 | 5,10 | -- | -- | 14,- | Smith (1972) |
| Malayan Dwarf | 440 | 5,10 | -- | -- | 29,29 | ||
| 348 | 5,10 | -- | -- | 59,33 | |||
| 282 | 5,10 | -- | -- | 60,39 | |||
| 230 | 5,10 | -- | -- | 82,46 | |||
| 188 | 5,10 | -- | -- | -- | |||
| Dwarf x Tall | 560 | 5,10 | -- | -- | 5,- | Smith (1972) | |
| 440 | 5,10 | -- | -- | 6,24 | |||
| 340 | 5,10 | -- | -- | 9,26 | |||
| 202 | 5,10 | -- | -- | 10,32 | |||
| 230 | 5,10 | -- | -- | 43,42 | |||
| 180 | 5,10 | -- | -- | -- | |||
| 5. | Philippines | 218 | -- | 8–9 | 0800 | 17 | Saijise (1973) |
| 1200 | 50 | ||||||
| 6. | Solomon Islands | 180 | 7 | 4–5 | 0900 | 38 | Gutteridge et al. (1976) |
| 1200 | 50 | ||||||
| 1500 | 47 | Watson (1977) | |||||
| 170 | 70 | 15 | 0900 | 31 | Watson and Whiteman (1981a) | ||
| 1200 | 97 | ||||||
| 1500 | 74 | ||||||
| Mean over full day | 60 | ||||||
| 343 | 14 | -- | 1000–1400 | 20 | Smith and Whiteman (1983a) | ||
| 275 | 12 | -- | 0900 | 22 | |||
| 1030 | 28 | Steel and Whiteman (1980) | |||||
| 1200 | 38 | ||||||
| 1330 | 31 | ||||||
| Mean over | 31 | ||||||
| 7. | Sri Lanka | 156 | (mature) | -- | -- | 50 (estm.) | FAO (1967a) |
| 8. | Tanzania | 100 | (mature) | -- | -- | 70 | MacFarlane and Stevens (1972) |
| 9. | Western Samoa | 120 | 20–23 | 7 | 1200 | 50 | Reynolds (1979j) |
| 120 | 50–70 | 15 | 1200 | 70–84 | Reynolds (1981) | ||
| 10. | Zanzibar | 120 | 60–70 | 10–15 | 1200 | 67–90 | Reynolds (unp.data) |
| 278 | 50–60 | -- | 1030 | 71 | Kayastha (unp.data) | ||
| 1130 | 78 | ||||||
| 1230 | 76 | ||||||
| 1330 | 81 | ||||||
| 11. | Thailand | ||||||
| Dwarf × Tall | 156 | 8 | -- | Mean over full day | 40 | Moss (1992) | |
| Tall | 205 | 13 | -- | 27 | |||
| 142 | 13 | -- | 45 | ||||
Note: Modified from Whiteman (1980) with additions.
Table 22. - The effect of palm density on light transmission (Smith et al., 1983)
| palm density (no. ha-1) | |||||
| 257 | 216 | 193 | 172 | 128 | |
| LT (%) | 17 | 25 | 37 | 40 | 64 |
It is clear from Table 21, and as indicated by Wilson and Ludlow (1991), that the curve for light transmission in coconuts proposed by Nelliat et al. (1974) and shown in Figure 22 significantly overestimates the minimum light levels achieved, at least for the commonly used tall varieties of coconut. Except where dwarf or hybrid varieties are used (Stur and Shelton, 1991) or palm density is high, in most plantations the mean light transmission values rarely fall below about 40 percent (see Figure 26) in contrast to oil palm and rubber where following a rapid decline over the first five years values of less than 40 and even 20 percent are usual once the canopy has closed (Chen, 1989; Chen et al., 1991; Wilson and Ludlow, 1991). Figure 27 shows percent light penetration with age under rubber and oil palm canopies. It is interesting that in a study of smallholder coconuts in the Solomon Islands light transmission ranged from 40 – 70 percent in coconuts with an age range from 9 – 19 years (Litscher and Whiteman, 1982), thus well above the low values suggested by Nelliat et al., 1974.
Steel and Whiteman (1980) state that a mean light transmission value does not indicate the nature of the shade under coconuts. “Measurements at 12 noon showed that 43 percent of the area received less than 10 percent of the outside intensity, and accounted for only 6 percent of the total incoming radiation. At the other end of the scale, 15 percent of the area received over 90 percent of outside intensity which accounted for 37 percent of the total incoming radiation… the very variable nature of the shading and the large proportion of the ground receiving very low light intensity at any particular time”. Figures 28, 29 and 30 show typical light-shade patterns. Figure 31 shows the spatial variation in light transmission in 5.5 year old oil palm, with transmission values of 73 percent in the middle of the inter-row falling to 2.5 percent at the base of the stem. The area under this curve has been integrated to give an average relative light transmission to the pasture area over the whole inter-row area under the trees (of 47 percent).
Figure 26. - Relative light transmission (%) profile of photon irradiance for coconut (Wilson and Ludlow, 1991).
Figure 27. - Percent light penetration under different age groups of rubber and oil palm canopy (Chen, 1989).
(Note: A Lamda Quantum Sensor was used to measure photosynthetically active radiation at open sites and under coconuts, calculating light transmission percentage on clear sunny day).
Figure 28. - Shade patterns and light transmission values under coconuts, Zanzibar, February 1983 (data provided by Kayastha).
Figure 29. - Shade patterns under coconuts in Western Samoa.
a) 60 years old coconuts spaced at 9.1 × 9.1 m.
Figure 30. - Shade patterns under coconuts in Western Samoa
b) 20 years old coconuts spaced at 9.1–9.1 m.
Figure 31. - Spatial variation in relative light transmission (%) in oil palm measured near midday (Wilson and Ludlow, 1991, after Chen and Bong, 1983). The area under the curve has been integrated to give an average light transmission of 47 percent.
Wilson and Ludlow (1991) stress the importance of taking account of the temporal and spatial variations of light distribution under plantation canopies so that an integrated average total daily photon irradiance (PI) input to the pasture area can be calculated. The commonly used procedure of taking “a reading on a clear day at a single time (usually near noon) and at a single position (usually in the centre of a row) … may provide a useful general description … are not very useful when actual light input is needed to enable a calculation of the potential for pasture production under the tree canopy”.
“Light transmission of a canopy varies with the proportion of direct to diffuse light. Diffuse light penetrates better than direct light because it emanates from the whole hemisphere of the sky rather than from the point source of the sun. Therefore measurements taken on a clear day will underestimate transmission of light under the trees.” The most precise measurements are obtained by integrating PI continuously over a period consisting of clear and cloudy days. If only instantaneous measures are possible, values should be obtained for both uniformly overcast and clear days (Wilson and Ludlow, 1991). They also suggest that “the recent availability of small, inexpensive, hand-held integrating PI meters now enables the problem of spatial variability to be resolved more quickly and accurately. These instruments based on gallium arsenide phosphide photocells (Hamamatsu, Japan) are sensitive to the 300 – 680 nm range and can be constructed of materials costing less than US$ 75. They can be programmed to integrate average PI over set time intervals, e.g. the operator can walk around within the plantation on a pattern to sample the spatial variation in light for, say, five minutes. Relative transmission can be obtained using a second instrument operating outside the plantation at the same time”. Pech (1986) proposed a mobile sampling system for measuring solar radiation under conifers and Moss (1992) used a mobile sampling method to measure the amount of photosynthetically active radiation transmitted through the canopies of coconut palms.
It is clear that light transmission is reduced in the morning and afternoon (and is highest from about 1000 to 1400 hours). The reduction is lower in older and less dense coconut stands, therefore would not seriously limit pasture growth. Conversely, light reductions could significantly affect pasture growth where stands are young and dense.
Moss (1992) measured the seasonal changes in light interception by coconut palms in Thailand. Table 23 shows the changing amount of photosynthetically active radiation (PAR) intercepted over the period May 1986 to April 1987. It was suggested that the seasonal changes in light interception were related to water stress: the effect of a soil water deficit was to cause increased frond shedding, a slowing down in frond production resulting in a net reduction in frond numbers and a consequent reduction in light interception.
The light relations of pasture plants have been discussed in some detail by Humphreys (1981) and Ludlow (1978, 1980). Humphreys suggests that almost all cultivated tropical pasture plants originate from forest margins or from open grasslands, and are ‘sun’ species using Blackman's (1961) definition. Since light affects crop growth and production through photosynthesis, reduced amounts of photosynthetic radiation reaching the ground through the coconut canopy results in reduced yields. Therefore in selecting pasture species it is important to use those which can maximize the reduced light. The problem is not simply selecting species for the coconut environment, but selecting species for particular coconut environments because of the various factors which determine either the degree of shading or the percentage of light transmission.
Table 23. - Mean percentage PAR interception at different sampling times for plots planted with 205 and 142 Thai Tall palms ha-1 (Moss, 1992)
| PAR Interception (%) | |||
| 205 palms ha-1 | 142 palms ha-1 | | |
| 20 May 1986 | 61.8 | 47.2 | 54.5 |
| 26 June 1986 | 69.1 | 52.7 | 60.9 |
| 29 July 1986 | 62.2 | 44.6 | 53.4 |
| 2 Sept. 1986 | 67.2 | 48.2 | 57.7 |
| 7 Oct. 1986 | 70.9 | 57.0 | 64.0 |
| 10 Nov. 1986 | 78.6 | 63.5 | 71.1 |
| 16 Dec. 1986 | 78.1 | 60.5 | 69.3 |
| 13 Jan. 1987 | 79.1 | 64.6 | 71.8 |
| 23 Feb. 1987 | 81.9 | 65.5 | 73.7 |
| 26 March 1987 | 82.7 | 55.9 | 69.3 |
| 22 April 1987 | 73.7 | 50.9 | 62.3 |
| 73.2 | 55.5 | 64.3 |
S.E. of differences between monthly means = 4.27, between density means = 6.54 and between table means = 3.59 (14 degrees of freedom).
Shading affects the growth rates of tropical grasses with their C4 photosynthetic pathway more than C3 legumes (Ludlow et al., 1974; 1978). Ludlow (1980) also indicated that when nitrogen is at low or moderate levels some tropical grasses seem less susceptible to shading than legumes. This is because moderate shading stimulates nitrogen uptake and growth in the grass whereas legume growth is depressed (Eriksen, 1977; Wong and Wilson, 1980). See Section 2.4. Chen (1989) refers to studies on changes in botanical composition and dry matter under rubber and oil palm where leguminous cover crops decline rapidly whereas grasses and broadleaved weeds built up in population with advancing age of the crops (up to year 6). Due to diminishing light penetration, DM yield drops from about 5,500–9,500 kg ha-1 yr-1 to below 1,000 kg ha-1 yr-1 when canopies close.
Plants grown is shaded conditions try to adjust to low light levels by various mechanisms such as reduced rate of respiration, lowered root-shoot ratio and greater leaf area-leaf weight ratio. These changes improve the competitive ability of the intercrop by increasing interception of light and reducing respiratory load (Trenbath, 1976). Smith and Whiteman (1983) found that shaded plants had thinner leaves and larger nitrogen concentrations than did unshaded ones. Ludlow et al. (1974) and Wilson (1991) noted that as the intensity of shading increased, the dry weight and leaf area decreased, the proportion of leaf increased at the expense of root, the shoot/root ratio increased, and the leaf area ratio increased because the leaves became larger and thinner.
Evans et al. (1992) note that generally in legumes and grasses high levels of shade will encourage plants to become more etiolated where they grow taller in an effort to gain better access to available light. Also leaves become larger and thinner. This has the effect of decreasing the density of the pasture sward as well as the readily digestible fraction in the leaf. This is one reason why cattle, when given a choice of open and heavily shaded pastures of the same grass or legume species, will usually graze the open sites first. In addition, heavily shaded pastures (i.e. less than 30–40 percent light transmission) have lower dry matter contents or higher water contents. This means that an animal has to make more bites to achieve a certain level of daily intake to achieve a certain level of performance. It has been shown that once dry matter percentages of intake drop below 18 percent then the potential for ruminant growth drops off markedly. In Vanuatu, the dry matter percentage of shaded T-grass is often below 18 percent, especially under heavy shade. On the other hand pasture quality for commonly available tropical species at moderate levels of shade (70 percent light transmission) appears to be similar to that grown in full sunlight and in some cases moderate shade will actually improve quality (protein content and digestibility) of grasses.
The formation of seed, which may be required for plant replacement, is especially sensitive to shade (Oliveira and Humphreys, 1986) and in forage grasses heading may either be hastened or delayed (Inosaka et al., 1977).
It is claimed that the competitive advantage of C4 grasses over C3 legumes in mixed swards is reduced by shading (Ludlow, 1978), but Shelton et al. (1987a) suggest that the outcome is uncertain and may be modified by soil nitrogen supply. Although there are field accounts of the loss of planted grasses and an increase in legume content under coconuts (Watson and Whiteman, 1981a; Smith and Whiteman, 1985), selective grazing of grasses may partly explain this phenomenon.
The capacity of plants to accumulate soluble carbohydrate reserves is greatly diminished under shade (Wilson, 1982), hence those species with a large reserve of biomass in roots and/or rhizomes and stolons which escape grazing may be more persistent under heavy shade than erect species which maximize leaf production (Wilson, 1991). Though they may have a more conservative growth performance, stoloniferous species such as Axonopus compressus, Brachiaria miliiformis, Paspalum conjugatum and Stenotaphrum secundatum are reported to perform well in grazed pastures under strong shade (e.g. Rika et al., 1981; Watson and Whiteman, 1981a; MacFarlane and Shelton, 1986; Chen and Othman, 1984).
Some grasses and legumes are more shade tolerant than others (see Table 24). Wong (1991) in his recent review of the shade tolerance of tropical forages defined shade tolerance (agronomically) as “the relative growth performance of plants in shade compared to that in full sunlight as influenced by regular defoliation. It embodies the attributes of both dry matter productivity and persistence”. Wong describes the morphological adaptations which take place:
“Shade affects the growth and morphological development of plants. Tiller production and leaf, stem, stubble, and root production are often reduced at low light with formation of thinner leaves with higher water content and a higher specific leaf area (Wong et al. 1985a, b). The increased partitioning of DM to the leaf component at the expense of root often results in higher shoot/root, leaf/stem, leaf weight and leaf area ratios, especially in grasses (Table 25). The same trend was to a lesser extent observed with legumes (Table 26).”
Morphological acclimatization of forages to light attenuation is an adaptive strategy to compensate, at least partially, for the lower photosynthetic rate per unit leaf area. In addition, chemical changes may also occur under low light to enhance photosynthetic efficiency. Foliar nitrogen has been shown to increase in shaded grasses but not in shaded legumes (Wong and Wilson, 1980: Samarakoon 1987). Higher nitrogen concentration in grass leaves was associated with enhanced efficiency of conversion of radiant energy (Sophanodora, 1989). On the other hand, nodulation in shaded legumes was adversely affected and nodule numbers declined with increasing shade intensity, and this may explain the contrasting response in legumes.
![]()
![]()
![]()