![]()
![]()
![]()
Table 197. - Liveweight gain of carabaos at different pasture treatments (17 September 1986 - 23 September 1988). After Deocareza and Diesta, 1991.
| Parameter | Treatment | ||
| Native Pasture 1.0 AU ha-1 | Native/Centro 1.0 AU ha-1 | Native/Centro 2.0 AU ha-1 | |
| Number of animals | 6 | 6 | 6 |
| Observation period (day) | 737 | 737 | 737 |
| Initial weight | 188.3 | 187.67 | 188.15 |
| Final weight (kg) | 294.39 | 372.67 | 339.15 |
| Average daily gain (kg) | 0.14c | 0.25a | 0.20ab |
| Total liveweight gain hd-1 (kg) | 106.09b | 185.25a | 151ab |
| Total LWG ha-1 (kg) | 106.09c | 185.25b | 302a |
a, b - means in same row with common superscript are not statistically different (P.05).
Once again the P. conjugatum declined under grazing and on the native pasture at 1.0 AU ha-1 disappeared after 51 months of grazing. Other economical grasses increased from 6 to 31 % and weeds from 21 to 69% over the same period. Similar decreases were observed on the native/Centro pastures although the increase in the weed component was lower (see Table 198). Following the trial the Centro regenerated on the 1.0 AU treatment but not on the 2.0 AU ha-1 treatment.
Table 198. - Botanical composition and herbage yield on offer at different stages of grazing (after Deocareza and Diesta, 1991)
| Pasture Treatment | Pasture Component | Before grazing | Grazing Period | ||||
| 17th Mo. 2-3-88 | 22nd Mo. July 1988 | 45th Mo. June 90 | 48th Mo. Sept. 90 | 51st Mo. Dec. 90 | |||
| A. Native Pasture 1.0. AU ha-1 | Cogon (%) | 39.55 | 5.45 | 15.18 | 2.43 | 7.75 | - |
| OEG (%) | 6.32 | 22.48 | 36.57 | 27.47 | 35.01 | 30.57 | |
| OEL (%) | 33.84 | 0.11 | 2.97 | - | 11.38 | - | |
| Weeds (%) | 20.29 | 71.96 | 45.28 | 70.12 | 45.88 | 69.03 | |
| Herbage Yield on Offer (kg ha-1) | 7,293.90 | 9,360.0 | 12,774.0 | 6,560.0 | 8,000.0 | 6,360.0 | |
| B. Native + Centro 1.0 AU ha-1 | Cogon (%) | 12.92 | 1.96 | 16.11 | 0.91 | 8.27 | 0.44 |
| Centrosema (%) | 41.14 | 6.21 | 15.72 | 40.91 | 26.03 | 3.92 | |
| OEG (%) | 5.21 | 11.39 | 24.78 | 34.32 | 23.91 | 26.33 | |
| OEL (%) | 20.66 | 16.10 | 16.27 | 3.41 | 3.41 | 2.4 | |
| Weeds (%) | 22.05 | 64.35 | 27.04 | 20.46 | 20.46 | 66.92 | |
| Herbage Yield On Offer (kg ha-1) | 6,313.20 | 6,365.0 | 13,151.0 | 8,800.0 | 8,950.0 | 9,190.0 | |
| C. Native + Centro 2.0 AU ha-1 | Cogon (%) | 14.42 | 1.33 | 2.02 | 2.26 | 8.41 | 0.36 |
| Centrosema (%) | 41.24 | 5.32 | 8.98 | 16.52 | 26.94 | 0.90 | |
| OEG (%) | 6.82 | 16.23 | 35.91 | 28.18 | 29.17 | 35.26 | |
| OEL (%) | 17.54 | 13.63 | 6.22 | 1.74 | 15.64 | - | |
| Weeds (%) | 19.98 | 63.50 | 46.86 | 51.31 | 19.84 | 63.47 | |
| Herbage Yield On Offer (kg ha-1) | 7,699.10 | 7,520.0 | 16,712.6 | 11,500.0 | 7,610.0 | 5,530.0 | |
OEL - Other Economical Legumes = Tropical Kudzu and Crotolaria sp.
OEG - Other Economical Grasses = Digitaria sp. and Paspalum sp.
Weeds - Dominant species = Elephantopus sp. and Mimosa pudica
Of greatest significance was the effect of livestock integration (and the introduction of Centro on native pasture) on farmers' income (see Table 199). Following a typhoon the majority of the coconuts were damaged (see Figure 207) so that no production was obtained in 1988. With livestock integration, farmers still obtained income with the highest amount contributed by animals on native/centro at 2.0 AU ha-1.
A number of options for pasture improvement and livestock production under coconuts in Philippines (reported by Deocareza and Diesta, 1993) were noted in Chapter 5 (Section 5.4.1). The establishment and maintenance costs and gross return ha-1 at optimum stocking rates for the different pasture types are shown in Table 200. Raising animals under coconuts resulted in higher income ha-1 compared with coconut alone.
Income from fertilized native Paspalum conjugatum pastures proved to be the
highest at  22,293 yr-1. Signal grass at 2.0 AU ha-1 gave 20,221 and income from the
sale of coconuts on both was high (however, this may be due to the number of nut yielding
trees rather than the treatment according to Deocareza and Diesta, 1993). In terms of
income derived from animals, the highest returns were from Signal-Centrosema pastures
at 3.0 AU ha-1 with a value of 8,410, followed by fertilized P. conjugatum with 5,373
and Signal grass with 4,621. However, the P. conjugatum system was not sustainable
as after four rounds of continuous grazing the pasture became dominated by broadleaved
weeds. All treatments increased income over the coconut monocrop system which had a
total income of only 12,750.
22,293 yr-1. Signal grass at 2.0 AU ha-1 gave 20,221 and income from the
sale of coconuts on both was high (however, this may be due to the number of nut yielding
trees rather than the treatment according to Deocareza and Diesta, 1993). In terms of
income derived from animals, the highest returns were from Signal-Centrosema pastures
at 3.0 AU ha-1 with a value of 8,410, followed by fertilized P. conjugatum with 5,373
and Signal grass with 4,621. However, the P. conjugatum system was not sustainable
as after four rounds of continuous grazing the pasture became dominated by broadleaved
weeds. All treatments increased income over the coconut monocrop system which had a
total income of only 12,750.
Table 199. - Average income of farmer ha-1 year-1 (after Deocareza and Diesta, 1991)
| Treatment | 1986 | 1987 | 1988 | ||||||
| Income from Coconut1 | Income from Animal | Total | Income from Coconut2 | Income from Animal3 | Total | Income from Coconut | Income from Animal4 | Total | |
| Coconut without animal | 4,347 | - | 4,347 | P8,280 | - | P8,280 | 0 | 0 | 0 |
| A-Native pasture 1.0 AU ha-1 | 4,271 | - | 4,271 | 9,315 | 336 | 9,651 | 0 | P1,748 | P1,748 |
| B-Native + Centro 1.0 AU ha-1 | 4,678 | - | 4,678 | 10,945 | 1,080 | 12,025 | 0 | 2,505 | 2,505 |
| C-Native + Centro 2.0 AU ha-1 | 4,857 | - | 4,857 | 10,168 | 1,476 | 11,644 | 0 | 4,400 | 4,400 |
1 Price nut-1 = P 0.60
2 Price nut-1 = P 2.25
3 Assumed LW kg-1 = P 18.00
4 Assumed LW kg-1 = P 20.00
1 US$ = P 28.00

Figure 207. - Coconuts recovering after suffering damage in typhoon strength winds
(note almost complete loss of nuts).
A report on integrated and mixed farming systems (FAO, 1983c) describes a
number of case studies from the Philippines. On a 63 ha. coconut-rice-livestock farm the
income from milk was over one half of that from coconuts. On a 45 ha. sugar cane-beef
cattle-coconut farm with sugar prices suffering a recession, the farmer considerably
increased his returns by feeding chopped/ground cane, ipil-ipil, grass and minerals to
penned cattle. Daily liveweight gains of 0.8 to 1.0 kg were obtained for a feed cost of
1.25 and manure was recycled to crop lands.
Table 200. - Establishment and maintenance costs and gross returns per hectare of Imperata-Centrosema, Signal grass and Signal-Centrosema pastures under coconuts (after Deocareza and Diesta, 1993)
| Pasture Type and Stocking Rate | Establishment * Cost (P ha-1) | Maintenance cost (P ha-1 yr-1) | Output Total Cost (P) | Livestock per hectare** | Livestock gross return (P ha-1) | Income from Coconuts (P ha-1 yr-1) | Total Income (P ha-1 yr-1) | |
| kg | P | |||||||
| Paspalum conjugatum + fertilizer | n.a. | n.a. | n.a. | n.a. | n.a. | 5,373 | 16,920 | 22,293 |
| Imperata + Centrosema (2.0 AU ha-1) | 1,960 | 1,195 | 3,155 | 146.00 | 5,840 | 2,685 | 12,520 | 15,205 |
| Signal grass (2.0 AU ha-1) | 2,150 | 1,930 | 4,080 | 217.54 | 8,701 | 4,621 | 15,600 | 20,221 |
| Signal grass + Centrosema (3.0 AU ha-1) | 2,170 | 1,640 | 3,810 | 305.50 | 12,220 | 8,410 | 11,496 | 19,906 |
| Coconut alone | - | - | - | - | - | - | 12,750 | 12,750 |
* Cost of land preparation, planting materials and fertilizers, spread over 10 years
** At P 40 kg-1 liveweight
n.a. - not available
Parawan (1991) suggests that in the larger tree crop plantations in the Philippines,
the advantage of integrating livestock would depend on the savings on weeding costs and
the use of chemical herbicides. Manual weeding and clearing in Southern Philippines could
cost about 400.00 (US$ 19) ha-1 yr-1. This amount could double if clearing is done with
chemical herbicides. The introduction of livestock would greatly reduce the cost of
weeding and clearing while at the same time providing an additional income from livestock.
The main economic advantages of introducing cattle into coconut plantations are: reduced weeding costs, increased copra production (from higher recovery rate of fallen nuts), and income from beef sales (Walton, 1972).
Carrad (1977) indicated that the main objective in running cattle on Lever Brothers copra estates in the Russell Islands Group, was to control undergrowth (the practice known as ‘brushing’) and improve nut harvesting conditions.
“Planning an optimal brushing pattern and intensity requires an appreciation of the amount and type of vegetation produced under different conditions relative to soil fertility, shading due to tree density and age, topography, rainfall and season. Overstocking may cause compacted soils, tree and pasture damage, whereas understocking results in insufficient control of undergrowth and harvesting/collecting nuts and palm growth may be affected”. (Carrad, 1977)
The main benefits of using cattle to control undergrowth have been an increase in nut pick-up, a decrease in the number of man days and thus reduced labour costs. Lever Brothers estimate that cattle brushing generally increases nut pick-up (thus reducing losses) from 75 to 90 percent. A stocking rate of about 1–1.5 livestock equivalents ensures reasonable brushing success while over the years there has been a marked decline in the numbers of workers employed on most estates due to an increase in productivity and use of cattle (with some chemical control) for most weeding. For effect of cattle introduction on both labour requirement and its main tasks see Tables 201-202-203. Before introducing cattle, weeding occupied 69 percent of total man-days worked (see Table 203). From 1964 there was a rapid change and after two years the division of labour was approximately equal. By 1974, 70 percent of labour time was spent on copra pick-up and only 30 percent on weeding. Substantial cost savings, releasing sufficient labour to replant 169 ha (which came into bearing in 1971) and efficiency improvement were the subsequent results (see Table 204).
Table 201. - The effect on copra yield and labour of different methods of undergrowth control (Carrad, 1977)
| Method of weeding | Copra Yield (wet kg) | Weeding (man days) | Labour Copra (man days) | Total (man days) |
| Hand | 111778 | 824 | 680 | 1503 |
| Cattle | 142251 | 200 | 854 | 1054 |
In addition the presence of cattle reduced difficulties in locating nuts in thick undergrowth. Considering the financial and economic aspects of this multiple purpose land use system, Carrad compared coconuts alone with cattle under coconuts. He concluded that cattle and coconuts with high copra yields was clearly the best enterprise in terms of length of replacement cycle. In terms of profitability the maximum potential gain from cattle and coconuts, as opposed to coconuts only, was from 23 percent to more than 200 percent depending upon the yields of copra and beef, price of copra, discount rate etc.
Table 202. - The effect of cattle introduction on total labour in man-days ha-1 (Carrad, 1977)
| Year | Estates | |
| Pepesala | Banika | |
| 1961 | 14.59+ | 31.99 |
| 1962 | 10.00 | 37.07 |
| 1963 | 11.86 | 51.77 |
| 1964 | 11.29 | 33.34+ |
| 1965 | 11.75 | 30.79 |
| 1966 | 10.63 | 27.40 |
| 1967 | 11.46 | 25.49 |
| 1968 | 13.35 | 30.63 |
| 1969 | 11.62 | 26.43 |
| 1970 | 10.62 | 20.97 |
| 1971 | 10.70 | 16.06 |
| 1972 | 8.42 | 13.99 |
| 1973 | 8.92 | 12.98 |
| 1974 | 8.88 | 13.32 |
Table 203. - The influence of cattle on changing composition of labour's main tasks, Banika Estate (Carrad, 1977)
| Year | Production (man days) | Weeding (man days) | Total (man days) | Cattle numbers |
| 1961 | 7,385 | 16,192 | 23,577 | - |
| 1962 | 8,457 | 18,865 | 27,322 | - |
| 1963 | 10,162 | 27,991 | 38,153 | - |
| 1964 | 9,840 | 14,728 | 24,568 | 209 |
| 1965 | 8,421 | 10,115 | 18,536 | 403 |
| 1966 | 8,365 | 8,132 | 16,497 | 234 |
| 1967 | 7,295 | 8,038 | 15,333 | 431 |
| 1968 | 7,409 | 11,031 | 18,440 | 337 |
| 1969 | 8,201 | 7,711 | 15,912 | 374 |
| 1970 | 5,753 | 6,873 | 12,626 | 1,037 |
| 1971 | 6,546 | 5,837 | 12,383 | 1,320 |
| 1972 | 7,027 | 3,761 | 10,788 | 1,030 |
| 1973 | 6,518 | 3,489 | 10,007 | 945 |
| 1974 | 7,233 | 3,040 | 10,273 | 1,079 |
Santhirasegaram (1975) indicated that, economically the growing of grasses such as Brachiaria species in areas with adequate rainfall, with a partitioning of fertilizer, would result in increase of coconut yields in the long term (up to 35% above control weeds after 16 years) and pastures could be stocked at about 2.5 adult cows ha-1 bringing about extra returns from meat or milk sales. Liyanage et al. (1989) noted that over a 3-year period the integration of pasture, fodder and cattle into a model coconut small holding reduced the cost of inorganic fertilizer for coconut by 69 percent, thus reducing the cost of production of coconut. The economic of integrating cattle into a number of smallholder units are described in detail in Chapter 9.
Table 204. - Changes over time in type of weeding and weeding man days ha-1 Lever Brothers Estate (Carrad, 1977)
| Year | Weeding (man days ha-1) | Type of Weeding |
| 1961 | 5.4 | Manual slashing only |
| 1966 | 3.2 | Decreased manual slashing, mechanical weeding, low cattle input |
| 1974 | 2.7 | Low manual weeding, some mechanical/spray weeding, high cattle input |
The effects of clearing the undergrowth under coconuts and stocking with local milk cows in the coastal belt of Tanga region in Tanzania have been described by Childs and Groom (1964). Within eighteen months, better quality grasses had become established leading to an increase in milk yields. Coconut yield had increased from 15 to 28 nuts per palm representing an 87 percent increase. A similar scheme started with the local farmers had resulted, within two years, in average nut yields increasing by 60 percent (to 25 nuts per palm) while milk yields doubled and various other benefits were noticed.
In Thailand several studies illustrate the economics of livestock integration with other tree crops. Tongmit and Jindarat (1988) reported an additional annual income from sheep under rubber of 2,500 baht ha-1 (US$ 100) and, in addition, a yearly reduction in weeding costs of some 250 baht ha-1 (US$ 10) and a fertilizer saving of 625 baht ha-1 (US$ 25). In Changmai province a farmer planted Napier under longan (Dimocarpus longan) to integrate dairying and fruit production on his 3.2 ha holding. The heavily manured napier produced so well that in 1976, 18 cows were being milked producing an average of 150 kg of milk per day, or a gross annual income of US$ 2,692 from milk compared with only US$ 1,154 from longan fruit (Manidool and Chantkam, 1986).
Manidool (1983) indicates that with an initial investment of US$ 116.8 to establish one hectare of pasture under coconuts, at stocking rates of 1.5 head ha-1 and a selling and farm-gate buying price of US$ 0.7 kg-1 liveweight, a farmer would get US$ 9.0 gross profit. Although he indicates that this would leave little margin to cover costs such as maintenance of the pasture, management of cattle and depreciation, it is clear that in the second and subsequent years the economics of coco-beef are much more attractive.
The economic benefits of improving pastures under coconuts were examined in a series of studies in the New Hebrides at the Saraoutou Experimental Station. A comparison of liveweight gains on natural pastures (Stenotaphrum secundatum, without maintenance, without fertilizers, traditional management) and improved pasture (Panicum maximum plus fodder sorghum, with improved management and fertilizer) indicated that in spite of the higher investment involved in improving pastures, the profits (Table 205) made on the improved pasture were nine times higher than those on a natural pasture (Anon., 1976e).
Table 205. - Returns from cattle on natural and improved pastures under coconuts in the New Hebrides (Anon., 1976e)
| Pasture species | Natural pastures Stenotaphrum secundatum (1 ha) | Improved pastures Panicum maximum (0.7 ha) Fodder sorghum (0.3 ha) | |
| Stocking rate (head ha-1) | 1.7 | 7 | |
| Investments | |||
| Land Preparation/sowing (0.7 ha) | - | 2,740 | |
| Seed purchase (0.7 ha) | - | 2,240 | |
| - | 4,980 | ||
| Amortization over five years | 996 | ||
| Operation | |||
| Land preparation/sowing (0.3 ha) | - | 1,174 | |
| Seed purchase (0.3 ha) | - | 440 | |
| Pasture maintenance | 2,500 | 4,500 | |
| Fertilizer | - | 7,380 | |
| Annual production cost | 2,500 FNH | 14,490 FNH | |
| Meat production/steer sales | |||
| Total weight of meat ha-1 (kg) | 340 | 1,750 | |
| Revenue (at 50 FNH kg-1) | 17,000 (in 3 yrs) | 87,500 (in 2 yrs) | |
| Annual Revenue | 5,667 FNH | 43,750 FNH | |
| Profit | 3,167 FNH | 29,260 FNH | |
Skea et al. (1993) mention the example of a demonstration farm (Vanuatu Pasture Improvement Project) where planting of the legume hetero into 4 ha. of buffalo grass under coconuts and into 3 ha of open Koronivia and Signal/legume pastures over the last five years has doubled farm income. This was achieved by turning off steers at 260 kg carcass at 3.7 years at 34,000 VT head-1 as opposed to turning off 230 kg carcasses from native pastures at 4–5 years at 23,000 VT head-1.
MacFarlane et al. (1992) stress that if the costs of pasture improvement in any area are greater than 50,000 VT ha-1***, it will be very difficult to make a reasonable profit from a farm.
Evans et al. (1992) reviewed various aspects of financial and development planning for commercial beef production and noted that the Animal Health and Production Division of the Vanuatu Department of Agriculture, Livestock and Horticulture had developed a computer herd and pasture projection model to assist in financial cash flow and development planning by changing one variable at a time (see Section 10.5.8).
*** US$ 416.7 (120 VT or Vatu º 1 US$, April 1993).
MacFarlane et al. (1992) reported on the economics of various cattle production systems (and the Vanuatu Pasture Improvement Project (VPIP) has produced several videos illustrating various technology packages and benefits gained by smallholders in particular. Copies have been made available in the South Pacific Region under the FAO project TCP/RAS/4451):
Ni-Vanuatu plantation, Tisman, S.E. Malekula
Present
Company with trained manager. 180 ha buffalo/carpet/native legumes under 70 year old coconuts. 100 cows, 4 bulls, 60% weaning, local feast and butchery sales of about 500,000 VT yr-1. 1987 barge load of cull cows, steers to Port Vila.
Vanuatu Pasture Improvement Project (VPIP) demonstration-3 ha improved pasture compared with unimproved, weedy situation typical of remainder of property. First year data - an extra 200 kg liveweight gain ha-1 yr-1 with pasture improvement and wild tobacco control for a cost of:
| Cultivated disc strips - machine hire | 2,000 VT ha-1 |
- seed | 6,000 VT ha-1 |
- Koronivia cuttings | 5,000 VT ha-1 |
| Total | 13,000 VT ha-1 |
Future
Given reliable machinery hire, reliable local and regional markets, Tisman aim to establish 10–20 ha improved pasture per annum. With complete rehabilitation over the next 10–20 years, Tisman will be able to run 150 cows, weaning 70%, selling 50 steers, 25 surplus heifers @ 350 kg live and 110 VT kg-1 carcass and 25 cull cows @ 350 kg live and 70 VT kg-1 carcass, grossing 1.74 million Vatu per annum. For a total expenditure on pasture improvement of 2.34 million Vatu or say 234,000 VT averaged over 10 years, coupled with improved animal husbandry, annual incomes will increase by 1.2 million Vatu.
Ni-Vanuatu Family Farm, Fanefo, Santo
Present
Labour Force - widow, brother, 2 sons, 3 sons weekend work.
Income Producing Activities:
| Garden | - 0.3 ha market garden |
| - sell to Santo market 30 times per year | |
| Coconuts | - 2.0 ha weed infested with pico |
| - copra yield recovered approx. 500 kg ha-1 yr-1 | |
| - hot air dried | |
| Cattle | - 14 ha weed infested land with 30% shade trees over carpet grass |
| - turns off 4 cattle yr-1 producing 250 kg carcass | |
| Off-farm Income | - 3 sons working in Luganville |
Collection of coconuts is incomplete because of weed density. It is impossible to fatten steers to desired stocking rates because of insufficient and low quality pastures. The farm does not generate enough income to allow all the family to work on the farm.
Annual Gross Income
| Garden | 90,000 av 3,000 VT × 30 markets |
| Coconuts | 5,000 0.5 t ha-1 @ 15,00 VT t-1 |
| Cattle | 57,600 4 cattle annually @ 180 kg carcass |
| Total | 162,600 VT |
Future
If weeds cleared and improved pastures established:
Labour Force - widow, brother, 2 sons, 3 sons weekend work.
Income Producing Activities:
| Garden | - 0.3 ha market garden |
| - sell to Santo market 30 times per year | |
| Coconuts | - 2.0 ha weed free with carpet grass/legume |
| - copra yield recovered approx. 1,000 kg ha-1 yr-1 | |
| - hot air dried | |
| Cattle | - 14 ha weed free signal grass/legume pasture. |
| - buy 12 weaner steers yr-1 at 9,000 VT and grow on for 2.5 yr to produce 250 kg carcass | |
| Off-farm Income | - 3 sons working in Luganville |
| Annual Gross Income | |
| Garden | 90,000 av 3,000 VT × 30 markets |
| Coconuts | 24,000 0.8 t ha-1 @ 15,000 VT t-1 |
| Cattle | 224,000 sell 12 steers 250 kg carcass weight at 3 years age |
| Total | 338,000 VT |
| Pasture Development Cost (over 3 years). | ||
| 8 ha sown to improved pastures | 10,000 VT ha-1 | 80,000 VT |
| 4 ha hand planted to impr. pasture follow-up weeding | labour only 2,000 VT ha-1 | 24,000 |
| Total | 104,000 VT | |
| Increased income year-1 | 175,400 VT | |
MacFarlane et al. (1992) also emphasize that there are several different ways of running a cattle (under coconut) business. Choice may depend on where the farm is located relative to markets. For a farmer with 15 ha running cattle on buffalo pasture with M. pudica under good coconuts 20 years old:
Method 1 - Breed and feed the calves until they grow big
With 5 cows and one bull on 15 hectares, the steers are fed until they reach 250 kg carcass weight. If the calving percentage is 80%, 4 calves (2 heifers and 2 bulls) will be born each year.
The farmer sells the two heifers at weaning, when they are 8 months old. In order for a steer to reach a carcass weight of 250 kg, it takes 4 years on buffalo grass/M. pudica, so 6 steers over one year old will also be in the paddock.
Every two years the farmer has to keep one of the heifers to replace a cow which should be sold. The price for an old cow is about the same as the price for the heifer.
Every year the farmer sells:
2 steers, each with a carcass weight of 250 kg. If the price is 120 VT kg-1 carcass weight, the farmer will get: 120 VT × 250 × 2 = 60,000 VT
2 weaned heifers 8 months old, with a liveweight of about 140 kg. At 60 VT kg-1 liveweight, the farmer will get: 60 VT × 140 × 2 = 16,400 VT.
Total earning every year will be 76,400 VT. (This method needs good management of the stocking rate and the market-abattoir or butchery should be close at hand).
Method 2 - Breed and sell all the weaners
With 12 cows and one bull on 15 hectares, the calves are sold at weaning time, or at about 8 months old. If the calving rate is 80% than 10 calves will be obtained each year.
The farmer must hold on to one heifer every year to replace an old cow. When the heifers are ready to bear calves, an old cow can be sold. The price for an old culled cow of about 160 kg carcass weight is about the same as for a weaner heifer.
If the price is 60 VT kg-1 liveweight, and the heifers weight 140 kg at 8 months, or weaning, the farmer will get: 60 VT × 140 × 10 + 84,000 VT. So, total earnings every year will be 84,000 VT.
(This method is suited to difficult areas where the market may be at a distance. The farmer must be able to sell his weaners to a plantation or another farmer for fattening on improved pastures).
Method 3 - Buy young steers and fatten them
The farmer buys 15 young steers (8 months to one year old) every three years, or he may buy 5 young ones and sell 5 old ones every year, as they reach 250 kg carcass weight.
In one year, the farmer must spend: 60 VT × 160 × 5 = 48,000 VT.
These must be fed for another three years until they have reached 250 kg carcass weight.
In the same year, the farmer will sell to the abattoir 5 large steers which have been fattening, each one 250 kg carcass weight. This will yield: 120 VT × 250 × 5 = 150,000 VT.
In any one year, therefore, the farmer will receive:
150,000 VT - 48,000 VT = 102,000 VT. Total earnings.
(This method, is more suited to open improved pastures where the animals put on weight more quickly and the farm should be near a road for quick and easy access to an abattoir or butchery).
Figure 208 shows part of the cattle herd of the late Jean-Baptiste, a smallholder farmer-cooperator who worked with VPIP, introducing buffalo grass and hetero under coconuts and Signal and Koronivia and appropriate legumes on open pastures. His income from cattle was subsequently increased two to three times through the adoption of these new technology packages.
Berges et al. (1993) differentiated five types of farming systems in a survey in Vanuatu with 3 types combining copra and cattle production. Copra production averaged from 729– 805 kg ha-1 whereas the amount of meat produced varied from 24 kg ha-1 (smallholders) to approximately 100 kg ha-1 on the larger commercial plantations. Estimates of income from copra and beef are given (as well as cocoa) and development of improved pastures in open areas is encouraged to finish the animals raised under coconuts. In fact, according to Berges et al. (1993) “I'introduction de bétail sous la cocoteraie n'est pas la conséquence d'une volonté de produire de la viande mais résulte de la nécessité, rapidement ressentie par les planteurs, de réaliser un écosystème très particulier pour une production plus efficiente de coprah.” Also, the hurricane which hit Vanuatu in 1987 resulted in a temporary loss of copra production in some areas for several years and a permanent loss in others. A number of farmers turned to cattle raising.
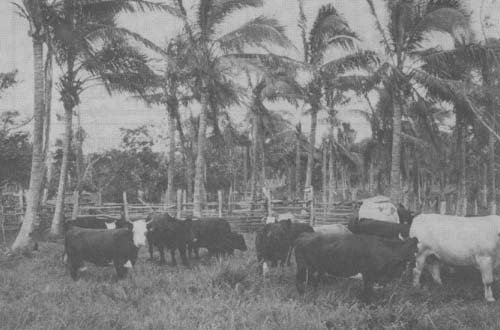
Figure 208. - Part of the cattle herd of the late Jean-Baptiste, a smallholder on Efate, Vanuatu.
Improved Pastures
Reports related to Western Samoa demonstrate the likely costs of establishment and returns from improved pastures under coconuts (Reynolds, 1980). Although evaluation of establishment costs is complicated by the wide range of initial ground and vegetation conditions, the cost of hiring equipment, clearing, cultivating, planting, fertilizing and weed control in the first year was approximately US$ 128 ha-1 (in 1978), with weed control and fertilizer costs in succeeding years at about US$ 35 ha-1 (see Table 206). These compare favourably with the estimate for establishment costs of US$ 90 in the Philippines (see Table 207) and US$ 116.8 in Thailand (Manidool, 1983).
Table 206. - Costs in US$ ha-1 of pasture establishment and maintenance under coconuts, Western Samoa (Reynolds, 1980)
| Materials | Labour | Total | ||
| Pasture establishment1) | Mean | 30 | 98 | 128 |
| Range | 26–33 | 74–124 | 105–151 | |
| Pasture maintenance2) | 15 | 20 | 35 | |
1) First year cost.
2) Costs in second and succeeding years.
Table 207. - Estimated cost of pasture establishment, Philippines (McEvoy, 1974)
| Activity | Cost ha-1 |
| Ploughing | 60 |
| Harrowings (two) | 70 |
| Legume seed (4 kg at 5 kg-1) | 20 |
| Fertilizer | 108 |
| Labour | 62 |
| Haulage of cuttings | 30 |
| Total | 350 |
Calculated for a property lacking its own equipment which would have to
be rented.
1 US$ = 3.90
While these costs may seem high, when compared with local pastures, the yields from improved pastures are also high. The value of extra beef production can be calculated by using data from Table 104. In 1978 Hereford steers grazing Batiki grass produced an extra 73 kg ha-1 year-1 of meat compared with local pastures, with steers on Cori and Palisade grass producing over 130 kg ha-1 of extra meat (see Table 208). At US$ 1.05 kg-1 this represents an extra income ranging from US$ 77 to US$ 141 ha-1 year-1. These data were derived from areas of improved and local pastures where fencing, watering facilities and costs were similar. Of course the return from copra would be in addition to these figures. Data from other trials would in general demonstrate similar returns from improved pastures. Thus in Robinson's second trial (see Table 105), Cori grass pastures grazed at a stocking rate of 4 steers ha-1 produced beef to a value of an extra US$ 180 ha-1 year-1 (at the 1978 beef price).
Not only does the introduction of improved pastures result in higher daily liveweight gains, but the higher nutritive value of the pasture can lead to a higher calf crop. Hedley and Gloyn (1977) reported that the average calving percentage for native pastures on WSTEC plantations was 55 percent. On improved pastures calving percentage was reported to be 75 percent (Stunzner, personal communication).
Local pastures
While local pastures can be extremely variable and in times of drought may support only very poor liveweight gains, where there is a high percentage of legumes such as Mimosa pudica and Desmodium heterophyllum the production of beef in addition to coconuts is a worthwhile enterprise. Data in Table 208 show that the value of beef produced on local pastures was US$ 67 ha-1 year-1 compared with US$ 208 ha-1 year-1 on Cori pastures. In Robinson's second trial the value of beef produced on local pastures was US$ 211 ha-1 year-1 compared with US$ 391 ha-1 year-1 on Cori grass pastures. With no establishment costs (as shown in Table 206) and only moderate maintenance costs (especially woody weed control), the income derived from cattle, grazed on good local pastures, is obviously a considerable supplement to that derived from copra sales.
Table 208. - Value of extra beef produced on improved pastures Western Samoa
| Species | Liveweight Gain (kg ha-1 yr-1) | Beef Production1) kg ha-1 yr-1 | Beef production increment over local (kg ha-1 yr-1) | Value2) (US$ ha-1 yr-1 |
| Local | 127 | 63.5 | -- | -- |
| Batiki | 273 | 126.5 | 73.0 | 77 |
| Palisade | 389 | 194.5 | 131.0 | 138 |
| Cori | 396 | 198.0 | 134.5 | 141 |
| Para | 358 | 179.0 | 115.5 | 121 |
| Tall Guinea | 336 | 169.0 | 104.5 | 110 |
1) Dressing percentage 50%.
2) Meat value at US$ 1.05 kg-1 wholesale price.
A grazing trial under coconuts at Vailele (August 1974-February 1975), demonstrated the importance of beef as a secondary source of income in view of fluctuating copra prices (Reynolds and Schleicher, 1975). From a price equivalent to US$ 13.60 per 45.4 kg early in 1975 the local copra price dropped sharply to US$ 4.08 per 45.4 kg by the second half of the year. Based on figures for liveweight gains and copra production, gross income for a coconut farmer running cattle on local pastures as well as for a coconut farmer running cattle on improved Guinea-Centro pastures (under coconuts) are calculated in Table 209. The effect of the drop in copra price was to reduce the gross income of a coconut farmer by 70 percent, whereas the farmer with cattle on improved pastures saw his income reduced by only 40.7 percent. In Western Samoa as in many countries the demand for beef is steadily increasing and prices are likewise steady or increasing, whereas the price of copra fluctuates widely according to international demand and market forces. The data illustrate the importance of intercropping coconuts and the likely effect on farmer gross income.
This chapter has provided important support for the three factors mentioned by Walton (1972) justifying the introduction of cattle into coconut plantations:
reduced weeding costs (by reducing labour requirements);
increased copra production from a better rate of recovery of fallen nuts;
new income from beef sales;
Table 209. - The effect of fluctuations in copra price on farmer gross income
| Farmer Category | Gross returns ha-1 year-1 in US$ | |||||||||
| copra | beef | Total | % reduction | % contribution of beef/copra | ||||||
| price high | price low1) | copra price high | copra price low | high price copra | beef | low price copra | beef | |||
| A. Coconuts only2) | 406.5 | 122.0 | -- | 406.5 | 122.0 | 70.0 | 100 | -- | 100 | -- |
| B. Cattle on local pastures under coconuts | 406.5 | 122.0 | 104.9 | 511.4 | 226.9 | 55.6 | 79.5 | 20.5 | 53.8 | 46.2 |
| C. Cattle on improved Guinea-Centro pastures under coconuts | 345.63) | 103.6 | 248.9 | 594.5 | 352.5 | 40.7 | 58.1 | 41.9 | 29.4 | 70.6 |
1) High price equivalent to US$ 13.60 per 45.4 kg; low price equivalent to US$ 4.08 per 45.4 kg.
2) Assuming copra production similar to farm where cattle raised on local pastures. In practice it is likely to be lower.
3) In absence of fertilizer, copra production was initially depressed where improved pastures of Guinea-Centro were established.
To these can be added:
labour released for other tasks such as replanting coconuts, pasture establishment and stock control;
increased farm gross income;
reduced dependence on one crop;
better and more complete utilization of available feeds by cattle (crop by-products and crop residues utilized).
Perhaps the increasing importance in economic terms of integrating livestock, pastures and tree crops can be seen from the data in Table 210. In the past it has often been argued that livestock enterprises interfere with the productivity of the main crop, but with recent trends in costs and returns in rubber, oil palm and coconuts, the situation appears to be changing. A working group at the Workshop on Research Methodologies Inherent to Integrated Tree Cropping and Small Ruminant Production Systems (Iniguez and Sanchez, 1991) held in Medan, North Sumatra, Indonesia in 1990, estimated the relative net returns in various tree cropping and livestock production systems:
Table 210. - Estimates of the relative net return in various tree cropping and livestock production systems (Iniguez and Sanchez, 1991)
| Systems | % Contribution of animal to tree/animal system |
| Oil palm : Sheep | 5–10 |
| Rubber : Sheep | 15–20 |
| Coconut : Cattle (Bali) | 75 |
| Coconut : Sheep (Philippines) | 50 |
NB: Weed control function has been taken account of, but animal impact on nutrient cycling has not been ascribed a value.
Investing in improved pastures usually results in increased returns from beef (except where high quality local pastures have already a high legume content) and fertilizer may increase copra production. However, the important factor is the level of management. Rika (1991) concluded that the coconut (pasture)-cattle system is viable but warns that poor management will result in invasion by unpalatable weeds such as Cassia tora, Stachytarpheta indica, Mimosa pudica, Lantana camara, and Chromolaena odorata, which will reduce the availability of forage for cattle and hinder nut collection. Therefore, unless farmers understand and practice the fundamental principles of both coconut and stock management, the expected benefits may not result. A well run coconut enterprise may become a profitable cattle-coconut enterprise if the farmer practices both good coconut and stock management. A poorly managed coconut enterprise is unlikely to show a profit simply because cattle are introduced, unless there is satisfactory stock management.
![]()
![]()
![]()