![]()
![]()
![]()
Zanzibar (consisting of the two islands of Unguja and Pemba) with a total land area of only 2630 Km2 had a population in 1978 of 479,235 people and 61,140 cattle. Large areas of the best soils are covered with tree crops, with cloves (Eugenia aromatica) estimated to cover 40,500 ha, coconuts (Cocos nucifera) 20,700 ha and citrus (Citrus sp.) a much smaller area. Interplanting of tree crops is common. It is on these lands and particularly the coconut areas, (or on areas adjacent to present and potential irrigated rice growing areas) that the greatest potential lies for increasing production of meat and milk. With land and resource limitations it is clear that at the smallholder level an integrated approach to agricultural development is more appropriate than traditional approaches along crop or animal lines. Thus a farming systems approach was advocated as the most appropriate to increase meat and milk production, and at the same time, increase productivity and the standard of living of the rural population.
A paper presented at the Arusha Farming Systems Conference describes the development of integrated farming systems for the smallholder in Zanzibar in terms of a number of programme steps (Reynolds and Lund, 1981). Applied research was initiated late in 1979. The design of systems was constrained by two factors:
The amount of land available to each farmer generally varies from about 1 to 2 ha, restricting the developed models within this size range.
Number of new concepts and new crops should be kept to a minimum, so that the farmer would identify with a system intended to basically reorganize existing crops rather than attempting to impose a completely alien system.
Two units were identified as being possibly relevant to the Zanzibar situation:
0.5 ha unit
The layout of the unit is shown in Figures 219–220. The stall is a very simple design capable of holding two cows and followers.
The fodder area comprises plots of Leucaena (L. leucocephala cv. Peru or Cunningham), Napier grass (P. purpureum cv. Gold Coast), Guinea grass (P. maximum) and Centro (C. pubescens). A hedge of gliricidia (G. sepium) surrounds the unit. Other combinations of fodder crops would be equally appropriate. Manure from the stall is recycled to the land. The local practice is to leave land fallow, allowing cattle to graze the weeds for two or three years after cropping with cassava for several seasons. The smallholder could restore the soil fertility and at the same time achieve higher productivity by using this fodder production unit.
2.0 ha unit
The layout of the integrated crop-livestock unit is shown in Figure 219. Cash, food and fodder crops have been combined and the area subdivided into eight plots:
3 × 0.25 ha bananas (Musa sp) plus sweet potato (Ipomea batatas);
1 × 0.25 ha Napier grass, 1 × 0.25 ha sugar cane (Saccharum officinarum);
2 × 0.25 ha cassava (Manihot esculenta) and 1 × 0.125 ha leucaena, Stylo (S. guinensis cv. Schofield) and a grazing paddock of Signal grass (B. decumbens), house, compound, stalls, vegetable garden and chicken house. Cuttings of gliricidia are planted to form boundary and plot hedges and to provide a source of high protein feed.
The unit would have 5 cows plus followers with appropriate stall accommodation and exercise paddock. There also would be a chicken house, a silage pit, vegetable plots and possibly some goats. The feed would be a mixture of Napier grass, banana stems and leaves, sweet potato vines, sugar cane and cassava tops and, depending on their availability, leucaena and gliricidia as protein supplements. Manure is recycled to the land. Crops should provide food plus cash income, and techniques like improved jaggery production could be introduced. Off farm feed materials may comprise coconut cake, molasses plus urea, rice mill meal, bran, rice straw, poultry, dairy and calf meals. The 2.0 ha unit should be able to support a family plus one hired worker.
Figure 219. - Layout of 0.5 and 2.0 ha units.
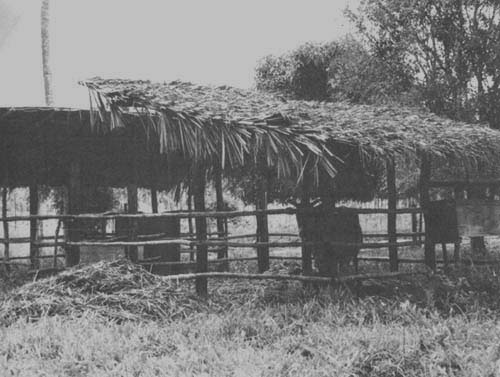
Figure 220. - The stall on the 0.5 ha unit.
On both units cutting and chopping/preparation of the feed should be done by hand using pangas. Weeding and cultivation of land should be done mainly by manual labour although on the 2.0 ha unit oxen can be trained as draught animals.
Both units were established in the second half of 1981 under existing coconut and clove trees where light transmission was in excess of 80 percent due to spacing and age of the tree crops. Input and output data were monitored. Although general systems theory is more a philosophy of approach or paradigm rather than an operational formula (Van Dyne and Abramsky, 1975), it was possible to identify the main components of the two units and to construct diagrammatic and flow models so that movements of inputs and outputs could be studied. In order to have an idea of the likely returns to the farmer from each unit, Reynolds (1982d) attempted to quantify inputs and outputs and constructed simple mathematical models so that cash flows for particular periods could be calculated. Obviously results are only as good as the assumptions made about levels of input and output, but as actual values become available, these can be used to make future projections on returns.
Following identification of inputs, intermediary outputs and final outputs, Reynolds (1982d) constructed flow models of both units (see Figures 221–222). Once cash values were introduced into the models, then construction of cashflow tables was possible. Cashflow estimates for both units are shown in Tables 234–235. These estimates exclude any income from copra and cloves because they were owned by Government. While there were costs which probably were not included and various assumptions made were subsequently found to be either too pessimistic or too optimistic, the main value of the exercise was to indicate the likely magnitude of returns over a ten year period and to provide a framework for estimating returns based on different combinations of inputs.
Figure 221. - A flow model showing inputs and outputs in the 0.5 ha unit.
Figure 222. - A flow model showing inputs and outputs in the 2.0 ha unit.
Table 234. - The 0.5 ha unit: Cashflow years 1 to 10 in T. Shillings (Reynolds, 1982d)
| Year | 1 | 2 | 3 | 4 | 5 | 6 | 7 | 8 | 9 | 10 |
| INPUTS (COSTS) | ||||||||||
| Loan Charge | - | - | 2240 | 2240 | 2240 | 2240 | 2240 | 2240 | 2240 | 2240 |
| Livestock | - | 6000 | - | - | - | - | - | - | - | - |
| Water | - | - | - | - | - | - | - | - | - | - |
| Fertilizer | 300 | 300 | 300 | 300 | 150 | 150 | 150 | 150 | 150 | 150 |
| Building Material | 2000 | 200 | 200 | 200 | 200 | 200 | 200 | 200 | 200 | 200 |
| Seeds & Pl.Mtl. | - | - | - | - | - | - | - | - | - | - |
| Cultivation | 250 | - | - | - | - | - | - | - | - | - |
| Feeds | - | 666.25 | 666.25 | 666.25 | 666.25 | 666.25 | 666.25 | 666.25 | 666.25 | 666.25 |
| Drugs | - | - | - | - | - | - | - | - | - | - |
| Others | - | - | - | - | - | - | - | - | - | - |
| Sub-Total | 2550 | 7166.25 | 3406.25 | 3406.25 | 3256.25 | 3256.25 | 3256.25 | 3256.25 | 3256.25 | 3256.25 |
| RETURNS (SALES) | ||||||||||
| Milk | - | 1458 | 5490 | 5490 | 5490 | 5490 | 5490 | 5490 | 5490 | 5490 |
| Heifers | - | - | - | 3000 | - | - | - | - | - | 3000 |
| Bull Calves | - | - | - | - | 2500 | - | 2500 | - | 2500 | - |
| Cull cows | - | - | - | - | - | 3500 | - | 3500 | - | - |
| Sub-Total | - | 1458 | 5490 | 8490 | 7990 | 8990 | 7990 | 8990 | 7990 | 8490 |
| Yearly balance | - 2550 | - 5708.25 | + 2083.75 | + 5083.75 | + 4733.75 | + 5733.75 | + 4733.75 | + 5733.75 | + 4733.75 | + 5233.75 |
| Cumulative balance | - 2550 | - 8258.25 | - 6174.50 | - 1090.75 | + 3643.00 | + 9376.75 | + 14110.50 | + 19844.25 | + 24578.00 | + 29811.75 |
In 1982 1 US$ = 8.90 T.Sh.
Table 235. - The 2.0 ha unit: Cashflow years 1 to 10 in T.Sh. (Reynolds, 1982d)
| Year | 1 | 2 | 3 | 4 | 5 | 6 | 7 | 8 | 9 | 10 | |
| INPUTS (COSTS) | |||||||||||
| Loan Charge | - | - | 4477 | 4477 | 4477 | 4477 | 4477 | 4477 | 4477 | 4477 | |
| Livestock | Cattle | - | 15000 | - | - | - | - | - | - | - | - |
| Poultry | 500 | 500 | 500 | - | 500 | 500 | 500 | - | 500 | 500 | |
| Water | - | - | - | - | - | - | - | - | - | - | |
| Fertilizer | 1200 | 1200 | 1200 | 1200 | 1200 | 1200 | 1200 | 1200 | 1200 | 1200 | |
| Building Material | 3500 | 300 | 300 | 300 | 300 | 300 | 300 | 300 | 300 | 300 | |
| Seeds & Pl.Mtl. | - | - | - | - | - | - | - | - | - | - | |
| Cultivation | 2100 | 1500 | 1500 | 1500 | 1500 | 1500 | 1500 | 1500 | 1500 | 1500 | |
| Feeds | 7358 | 8640 | 8664 | 8664 | 8664 | 8664 | 8664 | 8664 | 8664 | 8664 | |
| Labour | 6000 | 6000 | 6000 | 6000 | 6000 | 6000 | 6000 | 6000 | 6000 | 6000 | |
| Drugs | - | - | - | - | - | - | - | - | - | - | |
| Others | - | - | - | - | - | - | - | - | - | - | |
| Sub-Total | 20658 | 33140 | 22641 | 22117 | 22641 | 22617 | 22641 | 22117 | 22641 | 22617 | |
| RETURNS (SALES) | |||||||||||
| Banana | - | 24000 | 30000 | 30000 | 30000 | 30000 | 30000 | 30000 | 30000 | 30000 | |
| Sweet potatoes | 2500 | 2500 | 2500 | 2500 | 2500 | 2500 | 2500 | 2500 | 2500 | 2500 | |
| Sugar cane | - | 3281 | 6563 | 3938 | 3938 | - | 3281 | 6563 | 3938 | 3938 | |
| Cassava | ) )All eaten on farm ) | ||||||||||
| Maize | |||||||||||
| Cowpea | |||||||||||
| Milk | - | 3645 | 13725 | 13725 | 13725 | 13725 | 13725 | 13725 | 13725 | 13725 | |
| Heifers | - | - | - | 3000 | 6000 | - | - | - | 3000 | 3000 | |
| Bull calves | - | - | - | 5000 | 2500 | 5000 | 2500 | 5000 | 2500 | 5000 | |
| Cull cows | - | - | - | - | - | 3500 | 7000 | 3500 | 3500 | - | |
| Eggs | 16800 | 15750 | 19950 | 23100 | 15750 | 15750 | 24150 | 18900 | 15750 | 17850 | |
| Hens | - | 1400 | 1400 | - | 1400 | 1400 | 1400 | - | 1400 | 1400 | |
| Sub-Total | 19300 | 50576 | 74138 | 81263 | 75813 | 71875 | 84556 | 80188 | 76313 | 77413 | |
| Yearly balance | - 1358 | + 17436 | + 51497 | + 59148 | + 53172 | + 49258 | + 61915 | + 58071 | + 53672 | + 54796 | |
| + 179893 | + 229151 | + 291066 | + 349137 | + 402809 | + 457605 | ||||||
Although analysis of records of inputs and outputs for the first two full years of operation of the two units for the period March 1982 to February 1984 (see Tables 236–237) and estimation of ten year returns (see Tables 238–239) have been made by Pedersen et al. (1983, 1984), no strict comparison with Tables 234–235 is possible. The reasons are that the initial investment figure used by Pedersen et al. was higher, poultry were not established on the 2 ha unit, initial crop and milk yields used in year 1 of the 10 year calculation are those for established units corresponding to year 2 or 3 in Reynolds' estimates and various price and yield assumptions made by him, differ significantly from those recorded or used by Pedersen et al. However, estimates of 10 year cumulative balances for the 0.5 and 2.0 ha units by both Pedersen et al. and Reynolds indicate that in a society where many are unemployed or underemployed and where the annual income of a labourer was approximately T.sh. 6,000 in 1982–83 and T.sh. 7,200 in 1983–84:
The 0.5 ha unit represents a very reasonable part-time undertaking for a family with other sources of income and employment.
The 2.0 ha unit which requires the full involvement of the farmer, his family and one hired worker provides a very stable and attractive income generating system.
Later, further units were being established and operated by the farmers themselves under village level conditions (see Section 9.6). Wider adoption of the systems will depend upon the initial experience of these farmers. Certainly a wide range of potential crop residues and by-products were identified by Reynolds and Lund (FAO, 1983b), so that lack of animal feeds should not be a problem in the tree crop areas.
Whether some of the systems described in Section 9.5 are successfully adopted at farmer level will depend upon a number of factors, and past experience has been that many research findings are not reflected in farmer practice. Agricultural development implies the shift from traditional methods of production to new, science based methods that include new technological components, new crops and new farming systems. For farmers to adopt these new production technologies successfully, they must first learn about them (see Figure 223) and then learn how to use them correctly in their farming systems (Swanson, 1984).
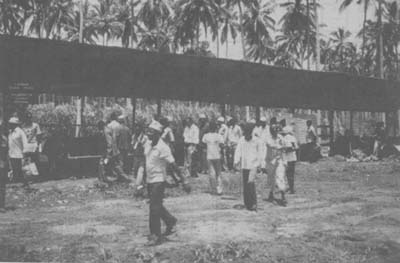
Figure 223. - Farmers' Day at the Kizimbani Research Centre, Zanzibar, Tanzania.
Table 236. - Farm income and expenses for 2.0 ha unit, March 1982–February 1984
(Pederson et al., 1983, 1984)
| Items | Cash 1982–83 | Cash 1983–84 |
| Crops | 25,361.20 | 54,535.75 |
| Cattle | 2,509.80 | 57,244.60 |
| Gross income total | 27,871.00 | 111,780.35 |
| Less variable expenses | 3,881.35 | 9,350.00 |
| Total gross margin | 23,989.65 | 102,430.35 |
| Less overhead expenses: permanent labour | 5,104.00 | 4,656.00 |
| Total overhead expenses | 5,104.00 | 4,656.00 |
| Net farm income | 13,885.65 | 97,774.35 |
| Less interest 12% | 2,400.00 | 2,160.00 |
| Net farm earnings | 16,485.65 | 95,614.35 |
Among fundamental questions which must be asked are the following:
Table 237. - Farm income and expenses 0.5 ha unit, March 1982–February 1984
(Pedersen et al., 1983, 1984)
| Item | Cash 1982–83 | Cash 1983–84 |
| Cattle | 9,484.00 | 13,585.00 |
| Gross income total | 9,484.00 | 13,585.00 |
| Less variable expenses | 1,213.00 | 516.50 |
| Total gross margin | 8,271.00 | 13,068.50 |
| Overhead expenses: | ||
Labour | -- | -- |
Depreciation of building | -- | -- |
| Net farm income | 8,271.00 | 13,068.50 |
| Less interest | 1,200.00 | 960.00 |
| Net farm earnings | 7,071.00 | 12,108.50 |
| Plus off-farm earnings | ? | ? |
| Family earnings | 7,071.00 | 12,108.50 |
| + ? | + ? |
Table 238. - 0.5 ha unit: estimated net returns in Tanzanian shillings over a ten year period (Pedersen et al., 1983)
| Year | Gross costs | Gross benefit | Net Benefit | |||
| Investment | Operation maintenance | Interest | Total | |||
| 1 | 16,800 | 1,213 | 2,016 | 20,029 | 9,484 | -10,545 |
| 2 | 1,425 | 1,814 | 3,239 | 7,560 | 4,321 | |
| 3 | 1,775 | 1,613 | 3,388 | 14,400 | 11,052 | |
| 4 | 1,900 | 1,411 | 3,311 | 12,980 | 9,669 | |
| 5 | 1,875 | 1,210 | 3,085 | 14,220 | 11,135 | |
| 6 | 1,725 | 1,008 | 2,733 | 10,860 | 8,127 | |
| 7 | 1,800 | 806 | 2,606 | 11,920 | 9,314 | |
| 8 | 1,925 | 117 | 2,042 | 12,760 | 10,718 | |
| 9 | 1,720 | 403 | 2,123 | 9,400 | 7,277 | |
| 10 | 1,725 | 202 | 1,927 | 23,760 | 21,833 | |
| Total | 16,800 | 17,083 | 10,600 | 44,483 | 127,384 | 82,901 |
Table 239. - 2 ha unit: estimated net returns in Tanzanian shillings over a ten year period (Pedersen et al., 1983)
| Year | Gross Costs | Gross benefits | Net benefits | |||||
| Investment | Operation & maintenance | Interest | Total | Livestock | Crops | Total | ||
| 1 | 36,000 | 8,986 | 4,320 | 49,306 | 10,509 | 25,362 | 35,871 | -13,435 |
| 2 | 8,650 | 3,888 | 12,538 | 24,300 | 21,800 | 46,100 | 33,562 | |
| 3 | 8,600 | 3,456 | 12,056 | 19,620 | 21,950 | 41,570 | 29,514 | |
| 4 | 17,810 | 3,024 | 20,834 | 17,540 | 21,450 | 38,990 | 18,156 | |
| 5 | 9,800 | 2,592 | 12,392 | 23,640 | 20,950 | 44,590 | 32,198 | |
| 6 | 9,700 | 2,160 | 11,860 | 25,500 | 20,950 | 46,450 | 34,590 | |
| 7 | 10,080 | 1,728 | 11,808 | 26,340 | 21,450 | 47,790 | 35,982 | |
| 8 | 14,080 | 1,296 | 15,376 | 27,726 | 21,950 | 49,676 | 34,300 | |
| 9 | 9,400 | 864 | 10,264 | 25,700 | 21,450 | 47,150 | 36,886 | |
| 10 | 9,300 | 432 | 9,732 | 60,820 | 21,450 | 82,270 | 72,538 | |
| Total | 36,000 | 106,406 | 23,760 | 166,166 | 261,695 | 218,762 | 480,457 | 314,291 |
Agricultural development will be conditioned by Government policies, by the prevailing economic, social, institutional and infrastructural conditions. It is too simplistic to visualize a problem and a purely agronomic solution. Farming systems are usually characterized by activities related to crop and animal production, family and household consumption, production, labour and leisure time usage, and off-farm household tasks (Swanan, 1984). Technology development and transfer activities that do not consider these complexities might attempt to extend inappropriate technology which will not be accepted by the farmer. Researchers often have little knowledge or understanding of the farmers' problems and the farming system in which he operates. There is need for communication and a feedback mechanism. The communication networks in agricultural systems are often complex (Anon., 1994b). Technological developments, adoption and transfer based on problems identified by the farmer (bottom-up) are likely to be more effective in producing technology acceptable to farmers than a top-down approach. Hitimana et al. (1994) emphasized the importance of involving farmers in technology development, even at the early stages. Unfortunately the predominant model in the development process has been linear, unidimensional and one-way (Rogers and Adhikarya, 1979).
Researcher → Extensionist → Farmer
In this approach technological packages are produced which are often inappropriate to farmers' circumstances. This is because, as they are designed mostly through experimental station research work, their domains of extrapolation have not been delimited. Farmers and on-station researchers are working in fundamentally different situations (Table 240). Therefore, it is important that farmers, researchers and extensionists establish a relationship which is the opposite of the linear, unidimensional and one-way model mentioned above, i.e.:
Chantalakhana (1980) described some of the background problems in a paper on the development of integrated farming in Thailand. Reynolds (1989) listed some of the factors which will have a bearing on the types of technology derived and whether they will reach and be adopted by the farmer. Also some of the generalizations about innovations and the rate of adoption were summarized from the work of Rogers and Shoemaker (1971). From a series of case studies - e.g., the adoption of the shrub legume Leucaena in Australia (Lesleighter and Shelton, 1986); the adoption of agricultural innovations among rubber farmers in Nigeria (Aigbekaen, 1984) - twelve possible reasons for non-adoption of pasture and forage crop research findings at farmer level are given (Table 241). Similar reasons could influence the adoption or non-adoption of the various models described in Section 9.5.
Recently Ong (1994) has raised the question of whether alley cropping is a realistic and practical option for overcoming problems of declining (soil) fertility - or just ecological pie in the sky. This is because the results obtained thus far have been mixed and also because IITA researchers have had difficulty in reproducing the positive (on-station small plot) results on working farms under farmer management.
It is interesting to note what happened when the units developed in Zanzibar (see Section 9.5.7) under experimental station conditions were introduced at farmer level;
initial reaction was of considerable interest and appreciation of the likely benefits, but under the prevailing very difficult economic situation which discouraged imports a common indication was “when there is something in the shops to buy I may be interested, for now I shall carry on with my subsistence cropping”;
Table 240. - Comparison between on-station and on-farm conditions for the production of agricultural packages (Prince of Songkla University, 1988)
| Research Station | Farmer | |
| Objective | To maximize the physical production of one species per land unit | To optimize the functioning of a more or less complex agricultural production system |
| Bio-physical Environment | Predominance of homogeneous plots. Total control of all possible variables | Predominance of heterogeneity. The control of many variables is limited |
| Factors of Production | Not limiting and well controlled | At least one of them is limiting (land, labour, equipment and capital) |
| Risk Factor | Consequences of a complete failure are of limited importance | Has to be limited in order to guarantee the survival of the agricultural production system |
later reaction was more positive when the economic situation improved and farmers were more actively involved in short training courses and working on the experimental units.
As the new technologies were being tried out by smallholders a rural institutions consultant carried out a (questionnaire) survey early in 1984 to discover the elements of the “decision - making matrix” within which livestock decisions are taken by smallholders (King, 1984).
He concluded that:
The place of the hardy but unproductive Zebu cattle in the traditional mixed farming system is a subsidiary one but that labour devoted to cattle husbandry is minimal as cattle are tethered (often on other farmer's land) and thus returns to labour are high in addition to the social and other benefits. The attraction of cattle ownership under this system is evident and the level of improvement required to induce farmers to abandon it must be correspondingly high.
High prices being paid for milk in Zanzibar city have made the acquisition of cross-bred cattle attractive to the farmer. While cross-bred cattle can survive under traditional tethered grazing there is an incentive for intensification (production of fodder crops) to achieve their much higher production potential.
There is a surprising reluctance to devote the small amount of required labour to cutting and preparing crop by-products. This may be a realistic assessment of the opportunity cost of farmers' labour or possibly is a demonstration of the traditional subsidiary nature of cattle raising.
There was evidence of community conflict over the deliberate encouragement of cattle to eat food crop by-products.
Fodder grasses appeared to be more popular than legumes.
Cattle deaths from east Coast fever and the limited availability of exotic and cross-bred animals had discouraged some farmers.
Farmers did not ask themselves whether a mixed farm was profitable but whether the application of household labour (including women's scarce weeding labour) and expenditure to fodder crops provides more benefit than applying the same resources to food crops or cash crops or non-farm activities. It should also be noted that the 2.0 ha unit was highly profitable even without cattle.
Table 241. - Reasons for non-adoption of pasture and forage crop research findings at farmer level (Reynolds, 1989)
| Recommendation of inappropriate (and expensive) technologies which have not been adequately farm tested |
| Failure of extension services to transfer the new technologies |
| Failure to appreciate the complexity of the small farm system |
| Failure to appreciate that agricultural development is subject not only to agronomic or biological problems but also to socio-economic, institutional and infrastructural forces and that there are many barriers to change |
| The often limited knowledge the research worker has of the farmer, or understanding of his problems |
| Lack of understanding of the factors which influence farmers' decision making process |
| Lack of a two-way information mechanism and heavy reliance on a top-down approach |
| Poor understanding by farmers of new technologies which result in inappropriate practices and a high failure rate when adopting innovations |
| Failure to appreciate the importance of level of management |
| Failure to provide sufficient incentive for the farmer to change and to appreciate that unless benefits are of the order of 50–100 percent the farmer may not consider the advantage sufficient |
| Failure to appreciate the risk factor, and the lack of adequate credit facilities |
| Failure to appreciate that the pace of change may be slow and that considerable extension effort will be required before adoption really takes off |
The implications were that:
a system designed and operated under research conditions may demonstrate considerably improved agronomic and economic performance compared with the traditional smallholder set up, however, acceptability and adoption by the farmer may be based on social, and other parameters than those considered by researchers;
the benefits of a new system must provide sufficient incentive (and the farmer must be convinced of these benefits) for the smallholder farmer to abandon or modify traditional practices;
community and social factors are likely to be very considerable barriers to change;
the provision of forages and the use of by-products are only one part of the system. Unless the problems of an adequate supply of cross-bred animals, diseases, etc. are overcome, then adoption of these innovations may be low.
However, as by 1986 some thirty farmers were involved in establishing forage plots and heifers were being sold to smallholders (FAO, 1987) it appeared that a small farm unit with integrated crop/livestock farming was regarded as a reasonably safe investment (provided adequate protective measures were taken against animal disease) and some of the experimental station findings were being implemented at farmer level.
Perhaps important lessons can be learned from the work of the Vanuatu Pasture Improvement Project (VPIP) where the extension and training programme was the major project activity with some 65% of total time input (Womack and Mullen, 1993). It was concluded that:
“the VPIP has been very successful in Vanuatu through well planned extension inputs and the involvement of all government and non-government organisations who work directly with farmers. The development of Vanuatu's livestock industry has been approached from a farming systems viewpoint with the broader goal of rural development in mind.
The use of carefully selected leader farmers in the demonstration extension process (see Figures 208 and 224) has been critical to the projects' success. Key farmers, along with Agricultural Field Assistants, other extension workers and VPIP staff have jointly identified problems and together found solutions. We believe that this approach will be the linch-pin of successful farmer adoption of proven technology in the South Pacific Region.”
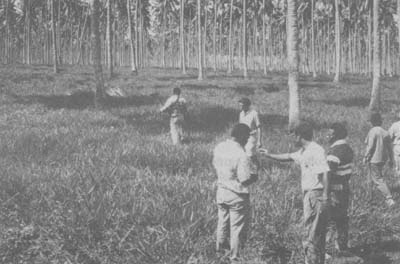
Figure 224. - Extension workers and key farmers inspecting on-farm demonstration Signal-legume pastures under coconuts on Plantation Reunie Vanuatu (PRV), Malekula.
The training of key leader farmers is the focus of an on-going FAO funded project (TCP/RAS/4451 - South Pacific Regional Pasture Improvement) which has the objective of improving fodder and pasture technology in South Pacific countries through the dissemination of regionally significant and proven technologies from Vanuatu.
The importance of on farm trials was stressed by Simaraks (1994). It can be “a base for information flow and technology diffusion (see Figure 225), as well as being used as a demonstration site for farmers' field days and facilitating farmer to farmer extension through their own discussions. Researchers and extension workers can act as facilitators for both diffusion of technology and information flow and learn lessons at the same time. Experienced farmers can train other farmers.”
| Existing System | New Approach |
 |  |
Figure 225. - Diagram comparing the existing system and the new approach, using on-farm trials as a tool for technology transfer with a participatory concept (from Simaraks, 1994).
Forage cultivation and cattle raising under coconuts is now widely accepted as one of the methods by which the smallholder farmer can increase his income and food supply. Livestock feeding systems based on banana leaves and stems, sugar cane, Napier grass, leucaena, gliricidia, rice straw, copra cake and rice bran as well as various conventional grasses and legumes have given promising results in a number of countries and particularly in South-East Asia where hand feeding of tethered animals is a traditional practice. Initial reactions have been favourable to various systems described in Section 9.5 utilizing existing crops and ideas although in some countries they represent a major change in approach. However, as in all rural development, it is the application of these systems at smallholder level that counts. There can be no attempt to impose the various systems on small-holders; if they are convinced that the systems can increase their income and bring them a better standard of living they will soon be accepted, copied and modified. As suggested by Blackie et al. (1979) “tradition and his own experience have taught him those farming practices which work… all change brings cost as well as benefits… the farmer will be reluctant to accept an outsider's evaluation of the benefit/cost ratio to the local community”.
The relationship between farmers' willingness to take risk and the adoption of innovations is a subject that has been extensively studied (Beets, 1990). Smallholders are reluctant to take risks, because risk-taking could jeopardize their subsistence.
Luning (1978) has suggested that because of the risk factors involved, small farmers engaged in crop production will not respond to new technology unless the cash pay-off is about two to three times the cash outlay necessary for its adoption (Mahadevan and Hickman, 1982). Data from the Asian Development Bank (1969) lend support to this assessment. Since weather-induced yield variability in crop returns is estimate to be of the order of 15–25 percent, there seems to be little enthusiasm for new technology which does not give yield jumps in the order of 40–60 percent.
Kirwan (1986) highlighted the critical nature of the risk factor to smallfarmers involved in the Zamboanga del Sur Development Project and their reluctance to become long-term borrowers.
Time will clarify which system or systems will, in practice, prove to be attractive enough to be adopted by the smallholder.
![]()
![]()
![]()