![]()
![]()
![]()
Grazing in the southeastern and south central regions of USA under slash pine (Pinus elliottii) and longleaf pine (Pinus palustris) is popularly known as the “pine-and-pasture” or “cattle-under-pine” system (Nair, 1991). Baudolin and Fisher (1991) mention that as much as 40 million ha in Alabama, Florida, Georgia and Louisiana may be capable of supporting the pines and cattle mix. A series of studies have been carried out since the 1940s as reported by Johnson et al., 1983; Lewis, 1974, 1984, 1985; Lewis et al., 1983, 1984, 1985, 1985a, 1989; Lewis and Pearson, 1987; Pearson, 1983. Among findings were that: production of pasture declined with closure of the tree canopy; the most productive and shade tolerant species was Pensacola bahia grass (Paspalum notatum); wider spacing of pines (6.1 × 6.1 m) increased tree diameter and wood yield; although the standard tree density and arrangement is 1,111 trees ha-1 at 2.4 × 3.7 m spacing, for silvopastoral management the best arrangement was shown to be a double-row configuration of 1.2 × 2.4 × 12.2 m (or 4 × 8 × 40 feet) in terms of both forage and wood production (see Table 253).
Table 253. - Average survival, height, diameter at breast-height, basal area, and forage yields at age 13 of slash pine planted in single-row and double-row configuration at 1,111 trees ha-1, Withlacoochee State Forest, central Florida
| Spacing configuration (m) | Survival (%) | Height (m) | Diameter (cm) | Basal area (m2 ha-1) | Forage yields (kg ha-1) |
| 2.4 × 3.7 | 61 | 10.5 | 14.5 | 11.6 | 1,223 |
| 1.2 × 7.3 | 68 | 10.6 | 13.2 | 11.2 | 605 |
| 0.6 × 14.6 | 68 | 11.1 | 13.0 | 12.0 | 1,195 |
| (1.8 × 2.4) × 7.3 | 67 | 9.8 | 12.7 | 9.1* | 1,577 |
| (1.2 × 2.4) × 12.2 | 67 | 11.0 | 14.0 | 13.6 | 1,416 |
| (0.6 × 2.4) × 26.8 | 74 | 10.2 | 10.9 | 7.6* | 2,882* |
| Average | 68 | 10.5 | 13.2 | 10.8 | 1,483 |
Source: Nair (1991) after Lewis and Pearson (1987).
Sharrow (1991) investigated the effects of different tree planting patterns on forage production in Oregon. In Douglas fir (Pseudotsuga menziessi) there was a strong interaction between density and pattern with highly aggregated plantations better able to maintain forage production at high tree densities. As tree growth is not reduced by aggregation into rows (provided that trees have at least one side bordering the open tree/crop interface and are not too closely spaced) Sharrow suggests that single or double-row patterns appear to offer the most promising combination of tree and understorey production in systems which emphasize achieving high levels of forage production while maintaining tree production near maximum (see Table 254).
Johnson et al. (1983) working in Louisiana indicate that net profit from a mixture of pines and cattle/pasture can be greater than producing either alone and by interplanting pines early monetary return is achieved. McNeel and Stuart (1984) financially analyzed various agroforestry management options in Southern States and found that all intercrop management alternatives provided higher dollar ha-1 values than the pine monocrop alternative.
Another tree crop with considerable intercropping potential is the black walnut (Juglans nigra). The silvicultural-economic model of Kincaid et al. (1982) concluded that early returns from agricultural production offset the higher initial cost of a multi-crop management system with walnuts, producing timber, nuts, soybeans, winter wheat and grazing (Nair, 1991). From an economic study of different management regimes of black walnut plantations, Garret and Kurtz (1983) and Kurtz et al. (1984) reported that internal rates of return and net worth were greatest from more intensive, multi-crop regimes.
Table 254. - Effects of tree density and planting pattern on forage yield (Sharrow, 1991)
| Density/Pattern | Forage yield (kg ha-1) | Loss due to bare spots (kg ha-1) | Loss due to competition (kg ha-1) |
| Open pasture | 3,170 | 0 | 0 |
| 180 Clusters = 900 Trees per Hectare | |||
| Single tree, grid | 889 | 56 | 2,225 |
| Cluster, grid | 1,713 | 179 | 4,278 |
| 2 × 18.5 m single row | 2,327 | 343 | 500 |
| 3 × 3 × 34 m double row | 2,490 | 476 | 204 |
| 3 × 3 × 3 × 50 m 3-row | 2,539 | 482 | 149 |
| 3 × 3 × 3 × 3 × 66 m 4-row | 2,577 | 485 | 108 |
| 90 Clusters = 450 Trees per Hectare | |||
| Single tree, grid | 1,398 | 28 | 1,744 |
| Cluster, grid | 2,494 | 89 | 587 |
| 5.1 × 19 m, single row | 2,518 | 162 | 490 |
| 3 × 37 m, single row | 2,748 | 171 | 251 |
| 3 × 6 × 34 m, double row | 2,816 | 108 | 246 |
| 3 × 3 × 71 m, double | 2,830 | 214 | 126 |
Early work in Australian agroforestry has been described in a number of papers (Anderson, 1978; Anderson and Moore, 1987; Anderson et al., 1988; Haines, 1992; Learmonth and Rabbette, 1978; McKinnell, 1978). Recently, Moore (1991) indicated that the average carrying capacity of livestock in an agroforest with 150 trees ha-1, over a 30 year growing cycle, is about 60% of that in open pasture. “During the first 12 years, the carrying capacity is about 83%. From year 12 onward, the carrying capacity declines steadily as the crowns of trees expand and shade out more light. At 20 years, the carrying capacity is about 51%, and by year 30 it is 13%. A similar trend occurs for lower densities of trees (e.g. 75 trees per hectare) but the carrying capacity is higher (see Figure 235).
The combined production of timber and livestock from an agroforest over the whole growing cycle is illustrated in Table 255. The overall combined productivity is higher than either enterprise on its own. The balance between agricultural and sawlog production can be varied by choice of regime. “Pasture uses moisture and nutrients from a relatively shallow zone, while trees make use of material deeper in the soil profile. Some of the extra productivity is likely due to the trees sheltering pasture and livestock”.
A few farmers have taken up and adapted the strictly uniform wide spacing of trees used in the research experiments. Some have planted their 10 hectare area of agroforest with strips of four or five rows of eucalyptus separated by 20–30 m pasture”.
Rows of trees and pasture
Arranging the trees in strips of two to five rows with open pasture between has been used by other farmers as well. It makes haymaking, cropping, and other tasks easier. This is especially important in the first few years after the trees are planted, when they are subject to damage by livestock.
Figure 235. - Average sheep carrying capacity as percentage of that for pure pasture.
(After Moore, 1991).
According to Moore (1991) one farmer indicates that grazing in the agroforestry area does not present any particular problems. “It is just a question of management. When the trees are young and susceptible to being damaged by sheep, I use ‘crash-grazing’, that is, I put in a large flock for a few days and get them out before they develop a taste for the bark”.
Table 255. - Sawlog and agricultural yields for agroforestry as % of production from pure forestry and pure agriculture respectively. Data are for a regime of 150 trees per ha-1 thinned to 50 trees ha-1 in year 20 and clear felled after 30 years (Anderson et al., 1988).
| Agroforestry yield (%) | |
| Sawlog yield | 93* |
| Agricultural yield | 42** |
| Total | 135 |
* As % of yield in pure forestry.
** As % of capacity in pure agriculture.
N.B.: This indicates % yield only with no indication of units or overall change in value of production.
Young sheep do less damage to the trees than older sheep, while the good shelter offered by the agroforestry area makes it an excellent lambing paddock.
Bird et al. (1992) reported the results of a 30 ha project combining P. radiata and pasture (perennial rye grass and subterranean clover) grazed by sheep (10 sheep ha-1). Treatments were (i) grazing control (no trees), (ii) 100 trees ha-1 (12 × 8 m), (iii) 277 trees ha-1 (9 × 4 m), (iv) 277 trees ha-1 (5 rows of trees, with a 36 m pasture gap), (v) 1,650 trees ha-1 (3 m between rows, 2 m between trees within row). Tree growth and sheep production data are shown in Tables 256 and 257. The data indicate that at year 10 there is some adverse impact of pines on animal production at a tree spacing of 100 ha-1 and a larger effect at higher tree densities, because of decreased pasture production. However, in spite of apparently producing less pasture than other plots with trees, animal production on the 277 trees ha-1 5 row plots was greater in 1991. This may reflect a shelter advantage to sheep on these plots and/or a greater contribution than expected from pasture within the trees. “The timberbelt arrangement of trees (i.e., 277 trees ha-1 5 rows of trees, with a 36 m pasture gap - treatment (iv)) appears to give better tree and animal production” than other systems. This approach allows the use of temporary electric fencing in the first 2–4 years to protect the trees from stock. It is too costly to protect individual trees, yet fencing pasture areas in the 'gaps' is feasible. Unless grazing is instituted as soon as possible the sown pasture will rapidly degenerate and stock carrying capacity will decline.
Carruthers (1990) reported on the intercropping of poplars in northern Italy where poplars are normally grown at wide spacings (300 trees ha-1). In order to understand the possible economic benefits of intercropping, an exploratory financial analysis was carried out (Carruthers and Tranter, 1989) comparing poplar and soya bean monocropping with a rotational intercropping system (the latter assumed that the crop occupied 50% of the area and its yield declined from 100% monocrop yield in the first year to 85% in the second). Some of the results are shown in Table 258.
The following conclusions were drawn from the evaluations:
In all conditions intercropping can provide better returns than poplar monoculture, despite additional costs and reduced yields;
Reducing the costs of crop production has a greater effect than maximizing yield;
If conditions (prices, yields, discount rates) are good for poplar, intercropping offers better returns than soya monocropping);
(Clearly, these findings depend on the validity of the assumptions and emphasize the need for further study and the collection of empirical data).
More recently Willis et al. (1993) used a spreadsheet based agroforestry model PopMod to re-evaluate the economic potential of poplar-based agri-silvopasture on good arable land in the UK concluding that “with the adoption of net margin accounting for agriculture, the introduction of grants, and the prospect of significant real reductions in agricultural prices, poplar-based agroforestry is now a viable land use option on good arable land”.
Table 256. - Growth of Pinus radiata at various spacings established in 1983 at Carngham (Bird et al., 1992)
| Treatment (trees ha-1)1 | Top height (m) | Diameter (cm) | |||||||||
| 1986 | 1987 | 1988 | 1989 | 1990 | 1991 | 1986 | 1987 | 1989 | 1990 | 1991 | |
| 100 (open) | 3.0 | 3.6 | 4.8 | 6.1 | 7.1 | 7.7 | 6.1 | 9.2 | 17.2 | 19.3 | 20.8 |
| 277 (open) | 3.4 | 4.2 | 5.7 | 7.3 | 8.6 | 9.5 | 6.7 | 10.2 | 18.0 | 19.8 | 21.3 |
| 277 (5-rows) | 3.3 | 4.3 | 5.8 | 7.7 | 8.8 | 9.9 | 6.4 | 9.8 | 16.7 | 18.4 | 19.7 |
| 1,650 unpruned | 3.6 | 5.2 | 6.8 | 8.6 | 10.8 | 11.3 | 6.6 | 10.7 | 15.2 | 16.6 | 17.6 |
| 1,650 pruned2 | -- | -- | 6.9 | 8.8 | 10.7 | 11.4 | -- | -- | 15.4 | 16.8 | 17.8 |
| I.s.d. (P = 0.05) | 0.5 | 0.7 | 0.8 | 0.8 | 0.6 | 0.7 | 1.7 | 2.3 | 1.4 | 1.1 | 1.0 |
1 By 1989 the initial tree stocking of 100, 277, 277 and 1,650 trees ha-1 was reduced to 60, 200, 200 and 1,350 trees ha-1, respectively from windthrow and thinning.
2 In 1988 an additional ‘treatment’ was included: 7 contiguous rows were pruned in each plot of the original 15 rows of the 1,650 trees ha-1 plots.
Table 257. - Sheep production in relation to tree density, Carngham 1986–91
(Bird et al., 1992)
| Treatment (trees ha-1) | Liveweight gain (kg sheep-1) | Wool production (kg sheep-1) | ||||||||
| 1986 | 1987 | 1988 | 1990 | 19912 | 1986 | 1987 | 1988 | 1990 | 19912 | |
| o (pasture) | 8.5 | 11.7 | 15.2 | 9.9 | 18.3 | 3.25 | 4.12 | 4.52 | 5.76 | 4.13 |
| 100 (open) | 10.6 | 8.7 | 16.1 | 10.2 | 16.2 | 3.62 | 4.14 | 4.55 | 5.74 | 3.95 |
| 277 (open) | 9.0 | 3.5 | 8.4 | 5.5 | 18.3 | 3.36 | 3.64 | 3.58 | 5.43 | 4.14 |
| 277 (5-rows) | 9.3 | 7.7 | 12.3 | 7.1 | 20.0 | 3.68 | 4.17 | 3.79 | 5.78 | 4.23 |
| 1,650 (woodlot)1 | 6.4 | -- | -- | -- | -- | 2.78 | -- | -- | -- | -- |
| I.s.d. 5% level | 2.1 | 3.5 | 2.9 | 4.2 | 5.6 | 0.23 | 0.52 | 0.16 | 0.44 | 0.50 |
1 Sheep could not be sustained on these plots after August 1986.
2 In 1991 the plots were stocked with 12 to 16 sheep ha-1 and the liveweight gains ha-1 were 293, 259, 220 and 280 kg (l.s.d. (P = 0.05) = 74 kg) and wool produce ha-1 was 66, 63, 50 and 59 kg (l.s.d. (P = 0.05) = 6.3 kg), for the respective treatments.
Table 258. - Comparison of net present values1 (millions lire) of poplar and soya monocropping and intercropping systems (Carruthers, 1990)
| Discount rate: | 4% | 7% | 7% | 7% | 7% | 7% |
| Poplar yield2: | 220 | 120 | 220 | 220 | 220 | 320 |
| Poplar price3: | 90 | 90 | 60 | 90 | 120 | 90 |
| Soya | 6.5 | 5.6 | 5.6 | 5.6 | 5.6 | 5.6 |
| Poplar | 5.9 | -1.3 | 0.1 | 3.3 | 6.6 | 7.8 |
| Poplar-soya | 6.7 | -0.5 | 0.7 | 4.1 | 7.4 | 8.6 |
1 Investment period of 10 years; base year 1985; poplars at 335 stems ha-1; soya mono crop yield of 2.9 t DM ha-1 year-1; soya price 753 330 lire t-1.
2 t ha-1 after 10 years
3 Lire × 1000 per t
It is interesting that in integrating sheep and Pinus radiata and in making “compromises between conflicting requirements for the production of timber and pasture” the New Zealand research indicated that about 100 crop trees ha-1 was close to optimum for sawlog production (knowles and Percival, 1983) and this also allowed reasonable pasture growth for most of the rotation. Anderson and Moore (1987) in Western Australia concluded that “generally densities of 50–110 trees ha-1 enable the objective of joint production of timber and pasture at satisfactory levels to be achieved, at least during the first half of a 25-year rotation” Knowles (1989) and Knowles and West (1984, 1988) confirmed that several studies using computer based profitability models have shown that final stockings of radiata pine as low as 100 stems ha-1 are likely to be the most profitable to the grower (McGregor and Williams, 1984, Thomas, 1990). However, each farm situation will give a slightly different answer to the question “How many trees per hectare in the final crop?”. The New Zealand Forest Service assists in management decisions using a range of computer models from SILMOD to RAM and most recently STANDPAK. Hawke et al. (1984) stress that in most situations a final crop of 100–150 stems ha-1 will give the highest overall return on the money invested. At tree densities of around 200 stems ha-1 most agricultural production occurs in the first 10–15 years, depending on the rate of tree growth. At lower tree densities (100 stems ha-1) significant agricultural production will occur until the tree crop is around 20 years old. Tree crops of around 200 stems ha-1 may give a larger cash flow at harvesting, even though individual trees are of lower value than at 100–150 stems ha-1. The effects of tree age and density on livestock carrying capacity are shown in Figure 233. As the amount of feed declines with time so the farmer must be aware of the need to reduce livestock numbers. The contribution to income from the understorey grazing is largely dependent on the tree stocking, but can be significant. Knowles (1975) concluded that the financial return from a sheep grazing operation would be US$ 66.1 ha-1, while returns from a forest grazing system would be US$ 84.9 ha-1.
Research has also indicated that internal rates of return of up to 12 percent can be achieved on favourable sites, provided that trees are pruned and thinned as soon as possible to a final crop stocking of 150 to 250 stems ha-1.
With a crop rotation length of 25–35 years it is important that the farmer uses all available information and assistance to make the initial decision about planting density. The New Zealand Forest Service has the following comment on profitability. “Stated in general terms agroforestry is likely to be more profitable than either farming or forestry when the level of farming returns is low. With higher farming returns agroforestry at low tree densities can compete with farming in some circumstances, but the margins either way are comparatively small. In these situations neither agroforestry nor forestry is likely to be the preferred land use” (Hawke et al., 1984).
Torres (1983) indicates that “available information would suggest that forest grazing is a technically feasible alternative, its economic viability depending on the technical and economic potential of the timber tree and the livestock enterprise, as well as the duration of the production cycle and access to financial capital.” In some situations separate blocks may be used for trees and for grazing.
With the decline in the world price of natural rubber (Horne, 1993 quotes a net 32% reduction in latex prices since 1988) growers are keen to combine rubber with other enterprises such as sheep production. Studies by Kartamulia et al. (1993) and Verwilghen et al. (1992) demonstrated that rearing sheep in rubber plantations (see Figure 236) could generate from 22–40% additional income. Although latex prices have increased again in 1995 the need for income stability will stimulate the on-going research.
A major constraint to the expansion of sheep production in rubber plantations is the provision of sufficient forage of adequate quality throughout the year and throughout the duration of a plantation (20–25 years) (Chen, 1991). The data in Table 259 highlight the two main problems of forages in rubber plantations: a rapid decline in both productivity and legume composition of plantation forages with plantation age (Horne, 1993).
Table 259. - Typical yields of forages in rubber plantations established with cover crops
(after Horne, 1993).
| Age of rubber (year) | PAR Transmission (%) | Standing Dry matter (t ha-1) | Forage Productivity (t ha-1 yr-1) | Botanical composition (%) | ||
| Legume | Grass | Broadleaf | ||||
| 1–2 | 70–90 | 2.0–3.5 | 5–7 | 14 | 79 | 2 |
| 3–5 | 20–70 | 1.0–2.0 | 1–5 | 31 | 37 | 25 |
| 6–20 | < 20 | 0.5–1.0 | < 1 | 37 | 10 | 46 |
Sources: Wan Mohamed (1977), Chee and Faiz (1991), Chong et al. (1991b).
While shade tolerant species have been evaluated (Wong et al. 1985a, 1985b; Shelton and Stur, 1991) and research continues (Horne mentions Panicum maximum, Brachiaria humidicola, B. brizantha, Paspalum notatum, Stenotaphrum secundatum and the legumes Arachis pintoi, other Arachis sp., Desmodium heterophyllum, Stylosanthes humilis and S. guianensis) an alternative approach to the problem of the long period of negligible forage production in conventional plantations is to reduce or eliminate the problem altogether by changing the planting pattern of the rubber trees to allow more light to reach the ground (Horne, 1993). Other workers have previously mentioned the need to change planting designs (Iniguez and Sanchez, 1991; Liyanage, 1991; Mohd. Najib, 1989; Sanchez, 1991; Tajuddin et al. 1991, 1993) bearing in mind that animal production will continue to be a secondary enterprise in rubber plantations and that there should be negligible reduction in plantation yield. The two potential systems of most interest are hedgerows and block plantings.
Hedgerows - were originally tried in the 1930s in Java to allow integration of rubber with coffee. The two planting patterns tried involved rubber trees closely planted (1–3 m apart) in rows 8–9 m or 16–20 m apart. In the narrow alleys, coffee could be grown for about 12 years until the canopy closed, but in the wide alleys the coffee could be grown indefinitely. Although results were initially promising research on hedge planting was abandoned in the 1950s because of lower latex yields per hectare and a higher incidence of damage to hedge-planted trees by root disease and wind.
Hedgerow plantings are being reinvestigated by the Rubber Research Institute of Malaysia to allow integration of sheep production with rubber plantations (Horne, 1993; Shelton, 1993). In conventional plantations the planting distance is 4–5 m (450 trees ha-1) and the canopy closes after four to five years. The hedge-planted rubber consists of double rows of rubber trees (with a spacing of 2–3 m) planted with a 22 m wide alley between the double row (450 trees ha-1). Improved forages in the alleys receive only moderate shading from the rubber trees on the edges of the alley. In Figure 237 the double row of the rubber trees is fenced off so that grazing of the alleys does not result in any damage to the rubber trees. (In Figure 238 bark damage has resulted where trees were initially unfenced). With the possibility of stronger clones that can resit wind damage and new techniques for stimulating latex production, it is hoped that latex yields from the hedge-planted rubber may equal yields from conventional plantations. The big advantage of the system could be sustainable sheep production using conventional grass/legumes species regardless of the age of the rubber trees. Under the ACIAR Project (PN 9113) grazing of N-fertilized B. humidicola and B. humidicola and other grasses + legumes (A. pintoi, etc.) in the spaces between the rubber hedgerows began in December 1992. It is hoped that lambs grazing between the rubber double rows will achieve growth rates of at least 80 g head1 day1. Details of sheep production under conventional rubber and on improved pastures under the double hedge-row planting system will be reviewed in two forthcoming papers by Chong and Tajuddin (1995).
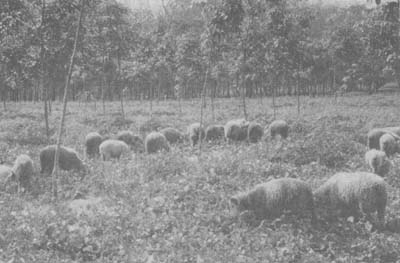
Figure 236. - Sheep grazing under young rubber in Malaysia (Photo Ismail Tajuddin).
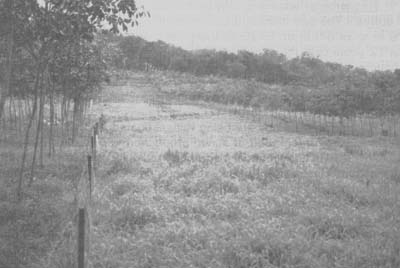
Figure 237. - Hedgerow planted rubber, MARDI, Malaysia.
Block planting - in block planting, rubber trees are planted in blocks with intervening blocks being sown with forages and tree legumes for sheep production. It may be possible to achieve equivalent latex yields per hectare from block plantings as from conventional plantations by using higher planting densities within the blocks (e.g. 625 trees ha-1 with the potential of lower yields per tree but higher yields per hectare, and up to 2,500 trees ha-1 in Indonesia with thinning of the plantation at three or five years of age). Tree covered and treeless (forage) blocks could be rotated every 20 years, allowing rehabilitation of the organic matter levels of all soils by forages.
The major disadvantage of both block planting and hedgerow planting schemes is that they require large areas to be left unplanted with rubber. Even if experiments show significant advantages to plantation income it may be difficult to convince estate management (Horne, 1993)!
It is interesting that the double-row hedgerow and block planting systems for rubber being experimented with in Indonesia and Malaysia are similar to systems examined in New Zealand for Pinus radiata.
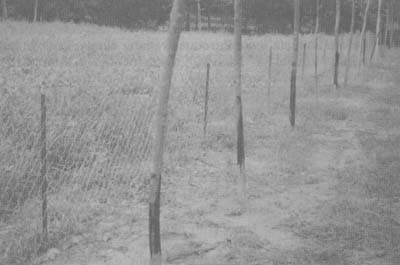
Figure 238. - Young rubber trees showing bark damage caused by sheep prior to fencing of the (double) hedgerow.
Because of canopy closure feed availability is a critical factor in maintaining sheep and cattle production under oil palm. According to Eng (1992) light transmission can go as low as 10% of full sunlight when the oil palm is about 8 to 12 years old and destocking is necessary. As with rubber there is a need for research into planting patterns which allow more light to reach the ground.
Hartley (1977) reported on some of the initial work on livestock/oil palm integration at the West African Institute for Oil Palm Research in Nigeria where spacing experiments were undertaken to investigate systems for intercropping and grazing. Attempts to compensate for increased width between the rows by decreasing spacing within the row led to reduced yields (see Table 260). However, normally spaced individual palms within widespaced rows yielded slightly more than palms at normal spacings. The most satisfactory arrangement was found to be alternating pairs of normally spaced rows of palms (9 m triangular) with forage cropping in the empty lanes. In a spacing-grazing experiment, a rectangular spacing of 6.4 × 12.8 m allowed P. purpureum to grow satisfactorily in the wide lanes between rows and resulted in fresh bunch (FFB) yields which were only slightly lower than the conventional 9 m triangular spacing (Mack, 1991).
Table 260. - Fruit bunches ha-1 yr-1 for 12 year old oil palms in the Ivory Coast (after Hartley, 1977)
| Spacing | ||||||
| Triangular | Rectangular | |||||
| Metres | 9.14 | 12.8 | 9.14 × 19.8 | 6.4 × 19.8 | 3.66 × 19.8 | 6.4 × 12.5 |
| Density (ha-1) | 138 | 70 | 55 | 79 | 138 | 128 |
| Yield (t) | 7.6 | 4.8 | 3.7 | 4.3 | 4.1 | 6.9 |
In 1986 a study was initiated at the MARDI Livestock Research Centre in Kluang, Johor to evaluate three different oil-palm planting patterns and their effect on oil palm yield, pasture production and growth performance of Dorset-Horn crossbred sheep. Three types of spatial arrangements were used - single, double and triangular rows with the distance between rows being 12.2 m, 15.2 m and 7.9 m in single, double and triangular rows, respectively (density of palms was maintained at 138 palms ha-1 for each type of spatial arrangements). Abdullah et al. (1992) reported on the dry matter on offer before animals were introduced in November 1989 and up to May 1991. The average DM yield of ground vegetation before animals were introduced under single, double and triangular rows were 839, 883 and 861 kg DM ha-1 harvest-1, respectively and in May 1991 were 608, 728 and 722 kg DM ha-1 harvest-1, respectively. The general trend was for a rapid decline in the percentage composition of leguminous cover crops, a sharp increase in grass species and a general increase in broad leaf species. Once light becomes a limiting factor differences are likely to occur. Eng (1992) reported on the growth of Dorset-Horn crossbred sheep under the three spatial arrangements and four sub-plot treatments:
| G/8 | - | Inter-rows planted with Guinea grass and grazed at S.R. 8 |
| G/10 | - | Inter-rows planted with Guinea grass and grazed at S.R. 10 |
| G/12 | - | Inter-rows planted with Guinea grass and grazed at S.R. 12 |
| N/4 | - | Inter-rows with native forage species and grazed at S.R. 4 |
Table 261 shows the mean liveweight gain (LWG) of Dorset crossbred sheep grazing under oil palm without any concentrate supplementation over the experimental period. The results indicate that no significant differences in LWG hd-1 were detected for all treatments, but differences in LWG ha-1 between the various sub-plot treatments were significant (P = 0.05). However, sheep grazing in the oil palm planted to double rows with the wider inter-rows produced higher LWG hd-1 (20.4 kg) compared to 15.6–16.3 kg hd-1 in the oil palm planted to triangular or single row spacing, even at this early growth stage of the oil palm. It will be interesting to observe if significant differences emerge as canopies close.
There is a considerable amount of information in the various reports referred to which is directly relevant to the coconut-pasture-cattle system. Not least is the modelling approach adopted by the New Zealand Forest Service (from SILMOD to RAM and STANDPAK). A schematic representation of STANDPAK is shown in Figure 239. This summarizes how current knowledge of forest management, log processing, agricultural productivity under trees, product prices and production costs can all be incorporated into user-friendly computer models, in order to support decision-making. STANDPAK can either be used independently as a stand model, or in conjunction with the IFS/FOLPI model, when it also addresses planning issues at the forest estate level such as the scheduling of planting, felling and replanting, together with cash-flow aspects (Thomas, 1990).
Table 261. - Mean LWG of Dorest cross-bread sheep grazing under oil palm (Abdullah et al., 1992)
| LWG (kg hd-1 yr-1) | LWG (kg ha-1 yr-1) | ||
| Main Plot | |||
| Triangular | 16.25 | 134.7 | |
| Single-Row | 15.59 | 127.0 | |
| Double-Row | 20.38 | 173.6 | |
| Sub-Plot | |||
| G/8 | 17.63 | 141.0b | |
| G/10 | 17.01 | 170.1bc | |
| G/12 | 16.18 | 194.1c | |
| N/4 | 18.81 | 75.2a | |
| LSD (P = 0.05) | ns | 33.1 | |
Figure 239. - The FRI Pinus radiata modelling system (STANDPAK). After Thomas (1990).
In Australia financial returns from agroforestry can be calculated using computer models such as FARMTREE and MULBUD (Prinsley, 1992); Scanlan (1992) has developed a model which determines the relationship between pasture production and tree density, allowing valuation of pasture and livestock production (but not timber yields).
In Philippines, Peralta et al., (1983) developed a simulation model for prediction of an established coconut farm over a 20-year period when it is replanted at various rates.
In USA, YIELD-PLUS (a computerized tree growth simulator) and CASH (a computerized cash flow and sensitivity analysis programme) were used to analyze the silvo-pastoral system for beef and timber/pulpwood production based on loblolly pine (Pinus taeda), Bahia grass (Paspalum notatum) and coastal Bermuda grass (Cynodon dactylon). The system increased profits and improved cash flow over monoculture pine (Dangerfield and Harwell, 1990).
In U.K. Welsh researchers have developed a computer spreadsheet model POPEYE for sheep grazing under poplar (Thomas, 1990, 1991) which, depending on the assumptions made about future prices and costs, suggest that this silvopastoral option could be an attractive one. Stocking et al. (1989) used cost-benefit analysis to assess the benefits over costs of agroforestry enterprises.
The Forest/Fuelwood Research Development Project (F/FRED) of Winrock International funded by USAID developed the Multipurpose Tree Species System (MPTSys), a software package for managing field research data and other information about multipurpose trees and shrubs (Venkateswarlu, 1994). Included is MPTGro, a computer model designed to simulate multipurpose tree growth in various management and environmental conditions which might be adapted, for example, to assess optimum tree density to obtain a given coconut yield ha-1.
A modelling approach (LICRO) has been used by Dahlan (1989) and Dahlan et al. (1991) for oilpalm and livestock in Malaysia and systematic research programmes by MARDI and RRIM (in Malaysia) and others have considerably increased our knowledge of the oil palm and rubber environment and the integration of pastures and livestock. As part of the ACIAR Project (PN 9113) on the integration of forages with plantation crops for sustainable ruminant production a postgraduate student is working on a model to predict the economic outcomes of grazing sheep under rubber in Malaysia (Shelton, personal communication).
An example of a different type of model that can be used to assist cash flow and development planning is the Vanuatu Animal Health and Production Division computer herd and pasture projection model, where one variable can be changed at a time to assess the effect (Evans et al., 1992). Some of the major factors which influence overall productivity, costs and profitability on a medium sized plantation can be seen in the following figures for a hypothetical well managed plantation of 150 ha recently increased in size to 245 ha.
The plantation has the following characteristics:
The model can show how fast a loan can be paid off, how much pasture needs to be improved to allow for the following years natural increase in herd numbers, how improvements in weaning percentage and decreases in mortalities affect profitability, the effect of changing prices, etc.
For example, if one of the following changes occurs then returns will vary as indicated:
| - | weaning falls from 80% to 70% | returns fall from 17% to 11% |
| - | weaning rises from 80% to 85% | returns rise from 17% to 19% |
| - | veal prices fall to 150 VT kg-1 | returns fall to 9% |
| - | steer prices fall to 140 VT ha-1 | returns fall to 8% |
| - | both veal and steer prices fall | returns fall to 0% |
| - | pasture development 35,000 VT ha-1 | returns rise to 26% |
| - | 60,000 VT ha-1 | returns fall to 12% |
| - | management costs 1.5 MVT annum-1 | returns fall to 6% |
| - | 2.0 MVT annum-1 | returns fall to -4% |
“Clearly if beef prices fall to the theoretical levels indicated and farmers can sell all they produce then the only profitable way to increase production will be to rehabilitate existing pastures or develop new pastures very cheaply. If pasture development costs were contained at 35,000 VT ha-1, cull prices remained constant, veal and steers were 150 and 140 VT kg-1 and weaning percentages improved to 85% the internal rate of return becomes 8% which is still not commercially attractive, certainly if borrowed funds are used. Commercial beef development proposals should have a projected rate of return at least equivalent to bank interest.
A 10% change in price has a greater impact than a 10% change in any other variable. Improvement in weaning percentages, efficient labour management and weed control is something the manager clearly does have influence over.” (Evans et al., 1992).
A number of authors have commented on the economic aspects of integration and methods of assessing the economic performance of particular systems and practices (Betters, 1988; Blandon, 1985; Filius, 1982; Mendoza, 1987). Particularly relevant was the paper by Thomas (1990) which focuses on the economic context within which the New Zealand agroforestry systems developed and discussed practical computerized tools for investment appraisal in agroforestry. A number of key issues were identified which are particularly appropriate to the coconut-pasture-cattle situation:
In agroforestry systems “trees may be planted in rows at equal spacings, wider than are normally found in a forest monoculture, and agriculture practised between the rows. Alternatively trees may be planted around the edges of fields leaving the agricultural component largely unaffected. The trees may also be found in irregular clumps or even as irregularly spaced individuals. There are no ground rules to dictate what type of spatial configurations can exist. Much depends on a variety of topographic, socio-economic and climatic factors”.
The problem is one of determining the optimum combination of crops, trees and livestock from the many feasible options which can be sustained from a given set of resources. Optimum land use is then achieved by allocating available resources to that activity which offers the greatest return, be it agriculture, forestry or agroforestry. This was illustrated as in Figure 240 where the point Z represents the ‘all agriculture’ option and Z' the ‘all forestry’ option. By introducing trees into the system returns from sheep grazing the pasture increase up to point R; similarly moving from the ‘all forestry’ option at Z', thinning and pruning trees planting pasture and introducing sheep it is possible to increase timber productivity up to point S. Both activities are complementing each other in terms of their use of resources (through shade provision and shelter for the sheep, suppression of competing weeds and increased nutrient cycling). The crucial issue is at what point further expansion of the timber or livestock/pasture component results in a reduction in the production of the other, and the effect on revenue. Point T represents the optimal solution where complementarity is exploited to its maximum.
Carruthers (1990) identified a further key issue when he stressed that: agroforestry is an approach to specific goals, a response to specific needs or opportunities and a product for a particular market.
Figure 240. - The productivity of agriculture and forestry in an agroforestry system
(Thomas, 1990).
Traditionally, cattle have been used as “sweepers” or “brushers”, keeping the grass and weeds short, preventing excessive nutrient and moisture competition with the coconut palms and ensuring easy location and collection of fallen nuts. According to Arope (1985c) animals have acted as weeders or biological lawn mowers in the plantations, saving on part of the herbicide cost. The present emphasis in coconut areas is on planting high-yielding hybrids (mainly in large commercial plantations) and/or on coconut based farming systems where complementary enterprises such as livestock are integrated with coconuts to increase productivity per unit area, increase employment opportunities and to provide a against low and fluctuating copra prices (Aguilar and Benard, 1991). Increasingly, new management techniques have been adopted, improved grasses and legumes have been planted to increase the animal carrying capacity and in smallholder systems increased use is being made of by-products and forage production is being integrated with food crops.
What is likely to happen in the future and can we learn from the experience of livestock integration with other tree crops?
For the immediate future the large majority of established coconut areas are planted at traditional spacings, so there is a need to identify grass and legume species for reduced light situations (and especially < 30% light transmission).
Where high yielding hybrids are planted at even closer spacings than those traditionally used it remains to be seen if intergrazing is feasible and catch cropping prior to canopy closure may be the main intercropping activity. With the positive results from grazing sheep under coconuts in Vanuatu the integration of sheep at low stocking rates may be feasible, with the same need for low light species as in (i).
As long as high prices were obtained for rubber, palm oil and copra and coconut oil then any use of ruminants was as an aid to the management of the key enterprise, the plantation crop. With the fall in prices for rubber, palm oil, copra and coconut oil in recent years there has been more interest in integrating tree crops and livestock and in developing systems where the combined income from the two enterprises is significantly greater than that obtained from the plantation crop alone. Although prices have recently increased there is continuing interest in systems which provide income stability, by not relying on one source of income only. It is interesting that in the literature on rubber (Mohd. Najib, 1989; Tajuddin et al., 1991, 1993; Iniguez and Sanchez, 1991; Sanchez, 1991; Shelton, 1993), oil palm (Hartley, 1977) and coconut (Darwis, 1988; Evans et al., 1992; ILCA, 1988) there is increasing reference to the need for new tree spacings. While trials are underway with wider inter-row spacings, thus for example Tajuddin et al. (1991) suggest that it may be possible to move from the conventional systems of planting rubber at 6 × 3.7 m (450 trees ha-1) or 9 × 2.5 m (444 trees ha-1) to a hedge-planting system of rubber at 22 × 2 × 3 m (450 trees ha-1) in which the light penetration between the hedges is greatly increased and shade tolerant forage species may be of lesser importance, perhaps we can learn from past experience with other tree crops such as work with pastures under Pinus radiata in New Zealand (Knowles, 1988, 1989; Knowles and Percival, 1983; Percival et al., 1984d) where twin rows 3.5 m apart and 24.8 m to the next two rows have been investigated, with alder (Alnus accuminata syn. A. jorunillensis) in the dairy region of Costa Rica (Budowski, 1983), with pines in southern USA (Gold and Hanover, 1987; Lewis et al., 1983, 1984, 1985 and Pearson, 1983) where the best silvopastoral arrangement in terms of both forage and wood production was a double-row configuration of 1.2 × 2.4 × 12.2 m and black walnut (Juglans nigra L.) in central USA (Garret and Kurtz, 1983) where wider spacings have been used to accommodate the requirements of both or all components of the integrated system. The ILCA Annual Report for 1988 (ILCA, 1988) suggests that “in the long term, the economics of spacing tree crops more widely to allow more light to reach the understorey and facilitate production of forage for livestock should be investigated. In the medium term, a search should be made for shade-tolerant grasses and legumes for use under existing tree densities, and ways to integrate them into smallholder farming systems should be investigated.”
Future work is thus likely to focus on three key areas (Reynolds, 1993):
Screening of new forage species for shade tolerance and persistence;
Systems of coconut tree spacing with emphasis on wide inter-row areas;
Development of various (coconut) multicropping systems where various management options are modelled to maximize return for the grower.
![]()
![]()
![]()