![]()
![]()
![]()
Member countries in Asia and the Pacific[1] have made great strides at reducing poverty and food insecurity and improving human development. From 1962 to 2003, life expectancy at birth increased by 17 years in East Asia and the Pacific and by 18 years in South Asia (World Bank, 2006).[2] Mortality rates for children under five have declined dramatically. The Human Development Index is higher today than it was in 1975 for all countries in the region for which there are data (UNDP, 2005). From 1981 to 2001, the proportion of people living on less than $1 per day[3] declined from 57.7 to 14.9 percent in East Asia and the Pacific and from 51.5 to 31.3 percent in South Asia. In South Asia, progress was more rapid in the 1990s than in the 1980s. In East Asia and the Pacific, poverty rates were cut in half from 1981 to 1990 and cut in half again from 1990 to 2001 (World Bank, 2006). From 1990 - 1992 to 2000 - 2002, the proportion of undernourished in developing and transition countries in Asia and the Pacific declined from 20 to 16 percent (FAO, 2004a). Access to improved water supplies in rural areas increased in nearly all countries from 1990 to 2002 (UNDP, 2005). While not all countries have shared in these gains, progress has been widespread across the region.
Despite the substantial progress, many remain mired in poverty. None of the developing countries in Asia and the Pacific are on track to meet all of the Millennium Development Goals by 2015 (UNESCAP, 2005). In 2001, more than 700 million Asians still lived on less than $1 a day, more than the entire population of sub-Saharan Africa at that time. As of 2000 - 2002, there were still 548 million undernourished people in the developing and transition economies of Asia and the Pacific. Many farmers, fishers and foresters are exceedingly vulnerable to floods, droughts and cyclones as well as less frequent events such as earthquakes and tsunamis (see feature on "Development, science and markets for disaster risk reduction"). Absolute income gaps between the richest and poorest quintiles are widening, and it is politically difficult to manage these disparities.
Although the agricultural sector (including forestry and fisheries unless otherwise specified) continues to grow, it is declining in relative importance in Asia, both in terms of its contribution to GDP and its share of the labour force. Farm households are diversifying their sources of income toward services and industry, or leaving the agricultural sector altogether. For example, the share of agriculture in GDP in Thailand decreased from 36 percent in 1960 to 10 percent in 2003 (World Bank, 2006). This relative decline of agriculture is inevitable in countries that experience economic growth, which has been widespread in the region. Since the Industrial Revolution, no country has managed to become wealthy without a major reorientation of the economy away from agriculture.
Urbanization is proceeding rapidly in East Asia (E Asia[4]) and Southeast Asia (SE Asia[5]). In 2004, the ratio of urban to total population was 42 percent in both these subregions, up from 33 and 34 percent, respectively, ten years earlier (FAO, 2006a).[6] These levels are still well below that in the developed economies (where it was 70 percent in 2004).[7] Urbanization has been much slower in South and Southwest Asia (SSW Asia[8]) and the Pacific Islands,[9] where the ratios currently stand at 30 and 20 percent, respectively. In Central Asia,[10] the rural share of the population is increasing, with urbanization rates falling from 44 to 41 percent from 1994 to 2004.
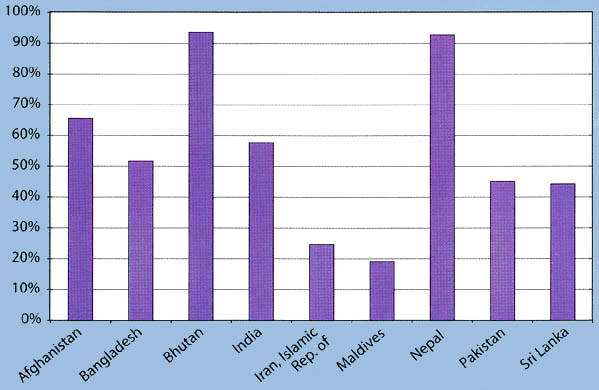
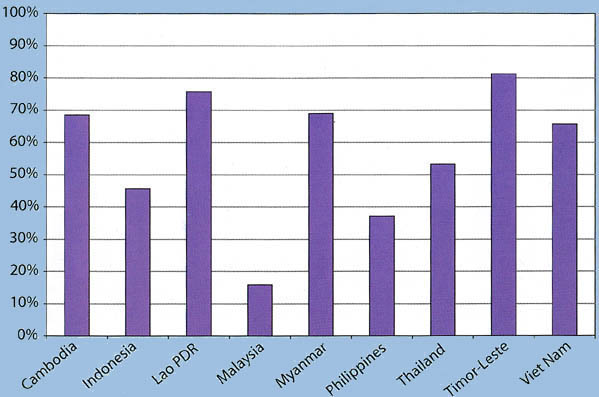
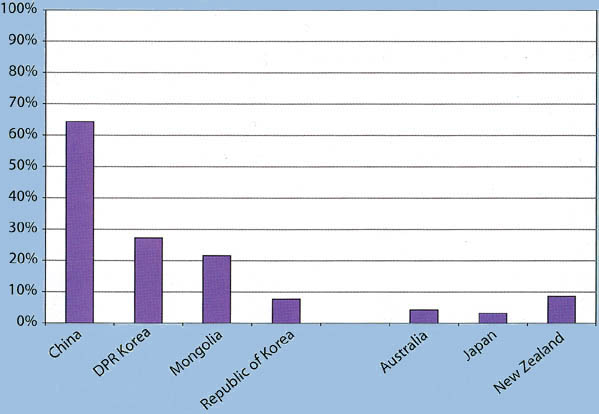
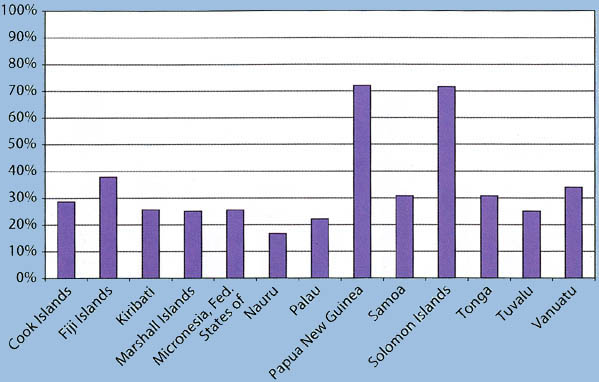
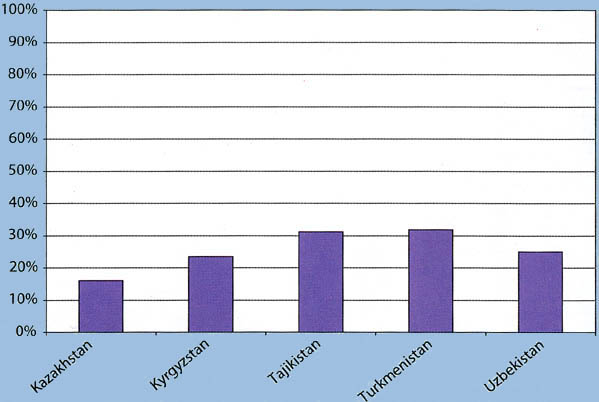
Despite the trends in urbanization, the absolute size of the agricultural labour force is still increasing in all subregions except for E Asia and the developed economies. More than half of the economically active population is still involved in agriculture in E Asia, SE Asia, SSW Asia and the Pacific Islands, and agricultural employment is especially important for the livelihoods of the poor (see Figures 1a to 1e). In addition, agriculture remains a major sector of all developing Asian economies. In India, it accounts for 22 percent of GDP (2003), and 58 percent of the economically active population engages in agricultural activities. These figures are even larger if the value generated through downstream processing is included. Thus, the health of the agricultural sector is crucial for increasing economy-wide productivity, especially in areas with a comparative advantage in agriculture. Agriculture also serves as a buffer and safety net by providing employment in the face of large economic shocks, such as the financial crisis in 1997 - 1998.
The importance of agriculture to the macro economy, the labour force and the poor suggests that investment in agriculture should continue. Indeed, studies in India and China have shown that, dollar for dollar, agricultural research has historically been one of the most effective means for government spending to reduce poverty (Fan, 2002; Fan, Hazell and Thorat, 2000; Fan, Zhang and Zhang, 2000). Other research has shown that agricultural growth in Asia is typically more "pro-poor" than growth in other sectors (FAO, 2005a; Timmer, 2005). Unfortunately, public funding for agriculture is declining in many countries, although there are notable exceptions such as China. Furthermore, much of the funding for agriculture often goes to subsidies that are not targeted to the poor, instead of being allocated to activities that increase productivity. Private funding of agricultural research may be able to compensate to some extent, but it has so far been limited in developing countries because of difficulties in reaching small farmers.
|
Figure 1a. Percentage of labour force in agriculture, South and Southwest Asia, 2004
|
|
Figure 1b. Percentage of labour force in agriculture, Southeast Asia, 2004
|
|
Figure 1c. Percentage of labour force in agriculture, East Asia and the developed economies, 2004
|
|
Figure 1d. Percentage of labour force in agriculture, Pacific Islands, 2004
|
|
Figure 1e. Percentage of labour force in agriculture, Central Asia, 2004
|
Ideally, the rural to urban transition (of jobs and the economy) should result from people being pulled into urban areas with new jobs, as opposed to being pushed out of rural areas. Such an outcome will require rapid growth in both industry and agriculture. Rapid growth in agriculture will also tend to dampen some of the tensions and disparities that arise in the wake of rapid urban and industrial growth, and make it easier to manage the rapid growth of cities. Of course, poverty in many parts of Asia is concentrated in backward regions and among disadvantaged families that will not be lifted out of poverty by agricultural growth alone. This poverty will need to be specifically targeted with more education and improved infrastructure, and good governance will be needed to implement these programs. But even for these people, it is likely that agricultural growth is an essential complement to education and infrastructure in the process of poverty reduction.
Rice, wheat and maize
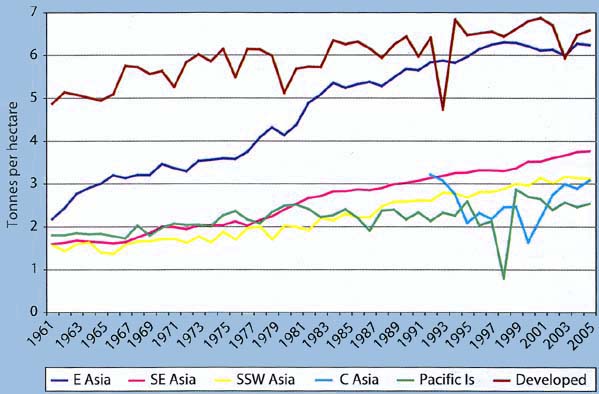
Rice is the most widely planted crop and the most important source of calories in Asia and the Pacific. Per capita rice production in the developing countries of the region increased from 117 kilograms of paddy in 1961 to an all-time peak of 166 kilograms in 1999. Since then, however, production has failed to keep pace with population growth, and per capita production declined to 154 kilograms in 2004. The decline in per capita production is because of small declines in area harvested and continued population growth, as yields per hectare are still increasing (although growth has slowed). On a subregional basis, rice yields have largely stagnated in E Asia and SSW Asia during the past five years, but they remain on an upward trend in SE Asia (see Figure 2).
|
Figure 2. Rice yields by subregion, 1961 - 2005
|
Per capita wheat production is also below its peak in both E Asia and SSW Asia, the two main producing subregions. As is the case for rice, Asian wheat area is below its peak in the late 1990s. Yields grew a cumulative 10.5 percent during the past ten years (from 1992 - 1994 to 2002 - 2004).
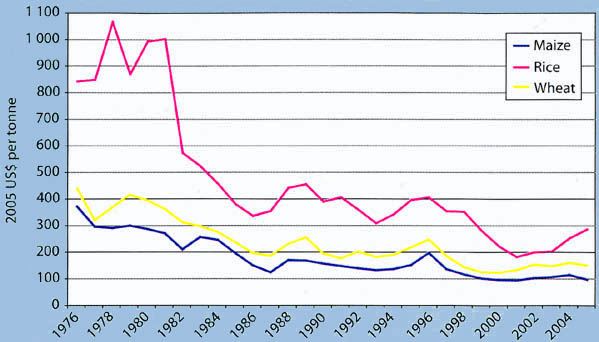
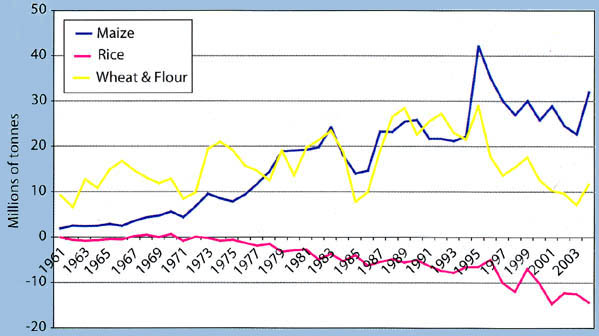
These declines in per capita production should be considered in the context of demand and trade, as economic growth allows Asians to diversify their diets away from staple foods. Rice prices on the world market in 2005, adjusted for inflation, were still well below the level during the 1990s, even after China's recent exit as a major net exporter (see Figure 3).[11] These low prices are responsible to some extent for the recent decline in area and the low prices suggest there is no large-scale crisis in rice production, at least at present. Well managed intensive irrigated rice systems growing two or three rice crops per year seem to be remarkably sustainable over long periods of time, although climate change may put this to the test. Wheat prices in the first half of this decade, adjusted for inflation, were also at historic lows (see Figure 3). Regional net imports of wheat and wheat flour for 2001 - 2004 averaged 9.8 million tonnes, their lowest level for a four year period in at least the past forty years.[12] Regional net exports of rice also reached historic highs from 2001 - 2004 (see Figure 4).
|
Figure 3. Inflation-adjusted world market grain prices, 1976 - 2005
|
|
Figure 4. Net grain imports, Asia and the Pacific, 1961 - 2004
|
Despite the long-term declines in world grain prices and costs of production per tonne, yield stagnation in many grain producing areas, continued population growth and possible increased demand for bioenergy give cause for concern that prices will increase substantially in the future. While higher prices would benefit some farmers, they would also increase hunger. It is possible that this scenario is overly pessimistic, and that even a relatively small rise in prices will give farmers the incentives to intensify production, thus increasing supply again and ensuring prices do not rise by more than a small amount. But such a positive outcome is not certain, and the risk of increased hunger means that action must be taken to avoid substantially higher food prices.
In general, trends in prices, wages and profits are more important indicators than trends in agricultural production. For example, the world's supply of food is already adequate to feed everyone if distributed evenly, but this fact is not relevant in market economies where access to food depends on incomes and prices. Low retail prices for food are important because most of the poor's money is spent on food. High profits for farmers are also important, because many farmers are poor and farming is an important source of income.
Unfortunately, simultaneously achieving low prices for consumers and high profits for farmers through government subsidies is not sustainable in poor countries. The large number of poor consumers and farmers means that subsidies will divert too many scarce resources away from important productivity enhancing investments such as infrastructure, education and health that are essential for long-term development. The best way to achieve low prices and high profits is through public goods such as scientific agricultural research that lower production costs per tonne and reduce the risk of higher prices in the future. Lower production costs per tonne are the only sustainable way to keep farming profitable and deliver low prices to poor consumers.
In contrast to rice and wheat, production of maize continues to outpace population growth in the region. Driven by rising demand for animal feed and increased adoption of hybrid seeds, yields and area both increased about 12 percent from 1992 - 1994 to 2002 - 2004, and maize area harvested reached a peak for the region in 2004. Despite the increased production, the region is still a net importer of maize (see Figure 4). Although demand is growing, world maize prices in the first half of this decade were at historic lows (see Figure 3).
Oilseeds, fruits and vegetables, industrial and beverage crops
Production of a wide range of other crops, including edible oilseeds, fruits and vegetables, rubber and coffee, is also much higher today than it was in the early 1990s. Prices of these commodities adjusted for inflation are generally lower, showing that growth in supply outstripped growth in demand.
Production of edible oilseed crops increased substantially during the past ten years (from 1992 - 1994 to 2002 - 2004) in Asia and the Pacific, led by oil palm, whose production more than doubled. Essentially all of the increased production of oil palm was because of an increase in area harvested of 3.4 million hectares in Malaysia and Indonesia, as average yields remained approximately constant. Asia and the Pacific accounted for 89 percent of world production in 2004, up from just 11 percent in 1961. Unfortunately, some of the growth in production has come at the expense of the environment. Burning of forests to clear new area for plantations has caused air pollution that has adversely affected human health, and possibly also the production of other crops in the region.
Production of rapeseed, sunflower seed, sesame seed and groundnut also increased substantially, with cumulative increases ranging from 27 to 41 percent during the past decade (2002 - 2004 compared with 1992 - 1994). Production of soybeans, the most widely planted edible oil crop in Asia and the Pacific, grew 15 percent. Much of these increases were because of higher yields, but the area harvested to these crops also increased by 3.9 million hectares in E Asia. During the same period, the area harvested to these edible oils declined by 0.7 million hectares in SSW Asia, although soybean area in this subregion increased by 2.4 million hectares (55 percent). In SE Asia, soybean area fell by nearly half (most of the decline was in Indonesia). Thus, there have been dramatic shifts in oilseed area between and within countries during the past decade because of increased demand and changes in policies.
Several fruits and vegetables registered large production increases between 1992 - 1994 and 2002 - 2004. In E Asia, there were large increases in production of watermelons, pears, plums, asparagus, cucumbers and cabbages, and this subregion accounted for nearly all of the increased production in the region. Production growth rates of these commodities in China averaged more than 10 percent annually during the past decade.
Production increases for tomatoes (111 percent) and onions (86 percent) were also large, and were more widespread across the region. Among tropical fruits, bananas (62 percent) and mangoes (37 percent) also showed rapid growth. India accounted for the largest share of increased production, but China, the Philippines, Indonesia and Thailand (for mangoes) also showed large increases.
Large increases in production also took place for rubber and coffee. Coffee production in the region jumped 92 percent from 1992 - 1994 to 2002 - 2004, led by increases in Viet Nam (where production more than quintupled) and to a lesser extent, Indonesia (56 percent) and India (55 percent). This increased production led to a large decline in coffee prices on the world market. Rubber production increased by 46 percent during the past decade, with the largest gains coming from Indonesia and Thailand. Although Asia and the Pacific accounted for 92 percent of world natural rubber production in 2004, the increased production did not lead to a decline in world rubber prices. Prices (adjusted for inflation) in 2004 were at a similar level to that prevailing ten years earlier, because recent increases in petroleum prices led to increased prices for synthetic rubber (natural rubber's main potential substitute).
Production of sugar cane, tea and cotton in the region increased during the past decade by 22, 25 and 16 percent respectively. Most of the increase in sugar cane production was because of greater area harvested, while for cotton all of the increase was because of higher yields. Tea benefited from both larger area and higher yields. Tobacco production fell 18 percent, with most of the decline coming from a 31 percent decrease in area harvested in China.
Diversification of cropping systems
As it has for millennia, rice remains the most important crop in the region. Rice is especially dominant in mainland SE Asia, where there are extensive flood plains that are well suited for rice cultivation. In this part of the region, rice accounts for more than half of total crop area harvested in most countries. However, the importance of rice is declining. While it occupied 26 percent of total crop area harvested in the region in 1980, its relative importance declined to 23 percent in 2004.
Relative declines also occurred for most other cereal crops, with the exception of maize. Wheat's share of total crop area harvested was 14 percent in 2004, down from 18 percent in 1980. The share of area devoted to coarse grains (excluding maize) declined from 13 percent in 1980 to 6 percent by 2004, although maize's share of total crop area has been approximately constant at 7 percent since 1980. Roots and tubers declined from 4 percent of area in 1980 to 3 percent by 2004. As cereals have become less dominant, oilcrops and fruits and vegetables have assumed rising importance. Oilseeds increased their share of area from 13 to 17 percent between 1980 and 2004, while fruits and vegetables increased their share from 4 to 10 percent.
Diversification is likely to continue, encouraged by the substantial shift in relative world market prices among agricultural and food products during the past 25 years. While prices of most agricultural commodities (adjusted for inflation) declined during this time, prices of fruits and livestock products decreased much less than rice prices, due partially to shifts in consumer demand (see Table 1). For example, the ratio of world market prices of oranges and bananas relative to rice in 2003 - 2005 were more than triple and double (respectively) the ratio in 1979 - 1981. A similar trend is noticeable for most meat, poultry and fish products. The price ratios of beef and shrimp to rice have increased 43 and 63 percent, respectively, and the ratio has nearly quadrupled for poultry. Relative to rice, the prices of field crops such as soybeans, wheat and maize have also increased, but the increases have generally been smaller than for high value products.
Because changing consumer demand will continue to drive diversification, government influence is best confined to macrolevel guidance as opposed to microlevel planning.
Table 1. Inflation-adjusted agricultural commodity prices on world markets
|
Commodity |
Price (2005 US currency) |
Units |
% change |
% change in |
|
|
1979 - 1981 |
2003 - 2005 |
||||
|
Rice |
956 |
249 |
$/tonne |
-74% |
0% |
|
Wheat |
392 |
155 |
$/tonne |
-61% |
52% |
|
Maize |
287 |
107 |
$/tonne |
-63% |
44% |
|
Soybeans |
634 |
252 |
$/tonne |
-60% |
53% |
|
Shrimp |
26 |
11 |
$/lb |
-58% |
63% |
|
Poultry |
75 |
74 |
cents/lb |
-2% |
278% |
|
Swine |
211 |
66 |
cents/lb |
-69% |
20% |
|
Beef |
297 |
111 |
cents/lb |
-63% |
43% |
|
Soybean Oil |
1 285 |
546 |
$/tonne |
-58% |
63% |
|
Sunflower Oil |
1 442 |
865 |
$/tonne |
-40% |
130% |
|
Palm oil |
1 203 |
418 |
$/tonne |
-65% |
33% |
|
Oranges |
964 |
817 |
$/tonne |
-15% |
225% |
|
Bananas |
876 |
506 |
$/tonne |
-42% |
122% |
|
Sugar |
43 |
8 |
cents/lb |
-81% |
-26% |
|
Tea |
514 |
209 |
cents/kg |
-59% |
56% |
|
Coffee |
458 |
76 |
cents/lb |
-84% |
-37% |
|
Cotton |
203 |
62 |
cents/lb |
-69% |
17% |
|
Rubber |
139 |
60 |
cents/lb |
-56% |
67% |
Source of raw data: IMF (2006)
Note: cents refer to one-hundredth of a US dollar. lb refers to a US pound, equal to approximately 0.45 kg.
At the macrolevel, governments should be aware that policies to artificially raise grain prices hinder diversification, especially if such policies are sustained over long periods of time. It is also important to enable the participation of private sector retailers and agribusiness firms in marketing by removing excessive regulations and providing a stable policy environment. These firms can provide the capital, markets and knowledge that farmers need in order to diversify. Governments should allocate adequate funds for agricultural research on crops other than cereals, build dense networks of rural roads that allow farmers to effectively market perishable products and establish, monitor and enforce quality standards.
Microlevel planning is less necessary and may often be counterproductive, especially because market signals provide guidance to farmers as to what specific crops or products are most in demand. For example, there are many reports of diversification plans that have failed, often because of marketing problems. Given an enabling macroenvironment as described above, relatively higher prices (and profits) for non-staple foods will naturally encourage farmers to switch crops, at least in some areas. In areas that have a strong comparative advantage for growing rice, such as the extensive floodplains in mainland SE Asia, most farmers will continue to grow rice. There are many such areas in all Asian countries, so despite the trend toward crop diversification, rice will remain a major crop (if not the dominant one) in most Asian countries for many years to come. For example, wheat still occupies more than a quarter of annual harvested area in Australia and about a fifth of annual harvested area in the United States of America.
Livestock, fisheries and forestry
An FAO index of livestock production grew rapidly from 1992 - 1994 to 2002 - 2004, with the most rapid growth occurring in China (93 percent), Viet Nam (93 percent) and the Philippines (79 percent). For the region as a whole, all subcategories of livestock products grew rapidly. The most rapid production growth was in poultry (a cumulative 83 percent) and eggs (78 percent). Rapid growth in poultry and egg production was widespread throughout the region, with the exception of Central Asia (where growth was negative in these and most other major livestock product categories) and the developed economies. Production of milk exhibited strong growth in East Asia (136 percent), SE Asia (65 percent), SSW Asia (52 percent) and the developed economies (33 percent). Pigmeat production grew 50 percent for the region, with strong growth in SE Asia (55 percent), E Asia (53 percent) and the Pacific Islands (44 percent).
Approximately 80 percent of the total increase in Asian livestock production since 1990 has come from large-scale industrial operations located in urban areas, often with thousands of animals packed closely together. The advantages of locating in urban areas are easier access to both feed supplies and markets for meat and eggs. However, such large concentrations of animals and animal wastes close to dense human population often cause considerable pollution problems such as algal blooms in offshore fisheries, leaching of nitrates and pathogens into drinking water supplies and contamination of soil resources with excess nutrients, pathogens and heavy metals. In order to reduce this pollution, livestock producers can be encouraged to locate further from cities and closer to croplands, where manure can be better utilized by crop farmers and human population densities are lower. Shifts in location can be achieved through a combination of zoning and land use regulations reinforced by taxes, incentives and infrastructure development. For example, in Thailand, high taxes were levied on poultry production within a 100 kilometre radius of Bangkok, and in less than a decade, the concentration of poultry production on the outskirts of Bangkok dropped substantially. Thailand's relatively well developed infrastructure no doubt contributed to this outcome (discussion in this paragraph is based on FAO, 2006b).
Another key problem facing the livestock industry is highly pathogenic avian influenza (HPAI). Farmers have lost production, and the negative effects were often compounded when consumer fears reduced demand and caused prices to decline. Because control of HPAI is a public good, governments need to take an active role in instituting early warning systems that provide for surveillance, diagnosis and control. Crucial components of these systems include sharing data, cooperating with other governments and international organizations and disseminating information, especially among small producers. It is also important to design appropriate compensation schemes that reduce the impact on small producers, while ensuring that culled birds are disposed of properly and that funds are not leaked to other uses. Compensation schemes can benefit those in need and provide incentives for farmers to help control HPAI.
Relative to other high value products such as livestock, poultry and dairy, production from capture fisheries (which account for slightly more than half of regional fish production) has grown relatively slowly in recent years. Production growth during the past ten years (1992 - 1994 to 2002 - 2004) was just 23 percent for the region, and in the developed economies, production declined 33 percent. Production also declined in E Asia during the past few years, as production in 2004 was 4 percent below its peak in 1999.
There are many concerns regarding the depletion of capture fisheries. The rise of industrial fishing has substantially increased fishing effort, and in many areas there has been "fishing down the food chain" as the proportion of larger, more valuable species (e.g. groupers, snappers, sharks) has declined in favour of an increased share of smaller, less valuable species (e.g. triggerfish, squids, octopus). These trends have often created a negative impact on small fishers that depend on the vitality of marine resources for an important part of their livelihood. An analysis of fishing effort, catch levels and profits in the Gulf of Thailand showed that reductions in effort would lead to recovery of fish stocks and increased production and profits. Because access to marine resources is difficult to regulate, both within and between countries, improved cooperation will be necessary to achieve such desirable outcomes. The experience in Europe's North Sea after two world wars shows that heavily exploited fish stocks can recover when released from heavy fishing pressure (for more discussion of these issues, see FAO, 2004b).
Slowing growth of capture production and high prices for fish have made diversification into and intensification of aquaculture attractive options for farmers in Asia and the Pacific, which is home to about 90 percent of the world's aquaculture production. In fact, production from aquaculture, including aquatic plants, more than doubled in the region between 1994 and 2004. Production nearly doubled in SSW Asia, and more than doubled in E and SE Asia. As a result, aquaculture accounted for 45 percent of total fish production in the region in 2002 - 2004, up from 30 percent in 1992 - 1994. The total value of the international fish trade exceeds that for any other agricultural commodity, but there are increasing demands on the quality and safety of traded seafood products. The region will have to greatly improve the quality of its exports in order to meet these demands.
Production of fuel wood, which accounts for 75 percent of wood use in the region, declined by a cumulative 1.7 percent between 1992 - 1994 and 2002 - 2004. Declines occurred in most subregions, although production increased slightly (by a cumulative 4.6 percent) in SSW Asia. Production of industrial roundwood declined by a cumulative 10.1 percent between the same two periods, with an especially large drop of 24.7 percent in SE Asia. Furthermore, the relative importance of natural forests as a source of industrial roundwood has declined, and the majority of official industrial wood production now comes from plantation forests. This shift is because large volumes of plantation wood have reached maturity in recent years in some countries, in addition to the fact that much of the highest value, easiest to log and most profitable natural forests have already been destroyed. Policies such as logging bans in natural forests in, inter alia, China, India, the Philippines and Thailand have also contributed to this shift. But illegal logging is widespread, and it is believed that actual harvests from natural forests are substantially higher than recorded in the statistics of several countries (for more discussion of these and other forestry issues, see FAO, 2003 and FAO, 2005b).
Among all regions of the world, Asia and the Pacific has the lowest level of forest cover, with forest area equal to about 19 percent of total land area. Between 1990 and 2000, there was a cumulative loss of forest cover in Asia and the Pacific of about 1.1 percent. This rate of loss was less rapid than in Africa or South America, and similar to that in North and Central America. Within the region, the highest rate of loss was in insular SE Asia, where a significant factor is clearance of land for agricultural purposes (often oil palm plantations). Loss of forest cover was higher for natural forests, with some compensation being provided by increases in plantation area. As a whole, the region is very close to meeting the World Conservation Union (IUCN) target of 10 percent of forests under conservation status, although there are still challenges in managing those conservation forests properly.
There have been some improvements in forest management in the region because of broadened realization of the consequences of deforestation, concerted national and international pressure, greater attention to social and land tenure issues and a range of specific policy measures to regulate and encourage better management. However, a range of challenges remain: areas under certification are small, the quality of governance is falling in many countries, plantation growth rates are low and devolution has often not had the desired effects. These challenges will need to be addressed in order to improve the livelihoods of those who depend on forests and ensure the sustainability of the resource base on which they depend.
Inputs to production
Labour, mechanization and land
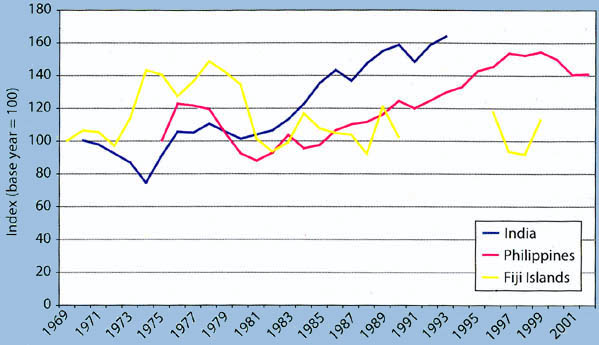
Economic growth and improved infrastructure are allowing many rural dwellers to obtain better paying jobs outside agriculture, in turn leading to increases in agricultural wages. Agricultural wages, adjusted for inflation, increased in India by 63 percent from 1970 to 1993, while a similar increase was observed in the Philippines from 1981 to 2002. Such trends are taking place in many countries in the region, but not all. For example, agricultural wages were largely stagnant in the Fiji Islands from 1980 to 1999 (see Figure 5).
|
Figure 5. Indices of trends in inflation-adjusted agricultural wages, selected countries
|
Because labour is the most important input in many production systems, rising wages (and reduced availability of labour) in many Asian countries are forcing farmers to mechanize operations, adjust cropping patterns and/or resort to migrant labour. In some cases, these changes can be extraordinarily rapid. In the Central Plain of Thailand, the quantity of labour used in irrigated rice cultivation declined from 57.5 person days per hectare in 1987 to just 8 person days per hectare by 1998, a decline of 86 percent in little more than a decade (Isvilanonda, Ahmad and Hossain, 2000). The reduced labour use was because of mechanization of harvesting operations and a switch from transplanting to direct seeding. Similarly rapid changes are occurring in southern China, where many farmers have changed from triple cropping (rice-rice-winter crop) to growing a single crop of rice in order to save labour.
Farmers often cannot afford agricultural machinery, so well functioning rental markets are crucial for the adoption of mechanical technologies. For example, while combine harvesting is widespread in the Central Plain of Thailand, only a small percentage of farmers actually own a combine harvester. Use by owners, plus rental through cooperatives or government agencies, collectively account for just 6 percent of use, with the remainder occurring in private rental markets (Dawe, 2005a). These rental markets tend to arise naturally in the absence of government restrictions.
Because many of the migrants to cities are young and male, the average age of farmers is increasing. Farmers are getting older not only in Japan and the Republic of Korea, but also in countries such as Thailand. Farm households are also becoming more likely to be headed by females. For example, in Thailand, the percentage of female-headed agricultural households increased from 12 to 27 percent between 1978 and 2003 (Dawe, 2005a). The increasing importance of women in farm management has also been documented in parts of India and other countries. The changing profile of farmers has important implications for irrigation managers and extension agents (among others), who must devise new strategies to communicate effectively with their new clientele.
In wealthier countries such as Japan and the Republic of Korea, average farm size is increasing, but at a slow pace. For example, between 1956 and 2003, average farm size in Japan increased by just 0.60 hectares. The increase in the Republic of Korea from 1969 to 2002 was 0.58 hectares (Fan and Chan-Kang, 2003). In contrast, national average farm size is still decreasing in most Asian developing countries. For example, average farm size in Nepal decreased from 0.95 hectares in 1992 to 0.79 hectares in 2002, and similar trends occurred in Pakistan and the Philippines, among others, during the decade of the 1990s (FAO, 2006c). But farms are becoming larger in dynamic agricultural areas close to large cities, such as Suphan Buri province near Bangkok. From 1993 to 2003, total agricultural land area in Suphan Buri declined, but the number of agricultural households declined even more rapidly, as families migrated to Bangkok or assumed non-agricultural jobs in rural areas. Active land rental markets have played an important role in the land consolidation process in Suphan Buri (Dawe, 2005a).
Land loss to urbanization is increasing the pressure to raise crop yields, although the magnitude of this loss is not as large as commonly supposed. Much of the "loss" in cultivated land in China in recent years is for ecological purposes such as conversion of marginal sloping lands to forests, or because of shifting cropping patterns in favour of horticulture. Nevertheless, non-agricultural construction claimed a cumulative 1.1 million hectares between 1997 and 2002, equal to about 0.8 percent of cultivated land at the beginning of the period (Lu et al., 2005). In Indonesia, land devoted to house compounds and surroundings increased by 0.3 million hectares between 1996 and 2004, equal to about 0.65 percent of agricultural land in 1996 (raw data from BPS, 2002; BPS, 2006). Total farm area declined by 3 percent from 1991 to 2002 in the Philippines (raw data from NSO, 2006).
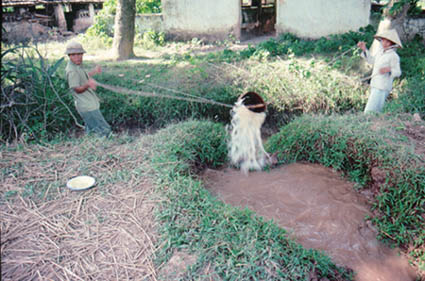
Water
Agriculture is the largest user of water in Asia and the Pacific, accounting for nearly 90 percent of consumptive use. But economic growth has created growing competition for that water, and use by households and industry will increase rapidly in the future. Non-irrigation water use may account for nearly a quarter of total use in the region by 2025. Projected growth in consumptive use by agriculture in the region to 2025 is essentially zero, while growth in cereal demand is expected to be more than 50 percent (Rosegrant, Cai and Cline, 2002). Thus, it will be crucial to improve water productivity.
Despite increasing competition for water, irrigated area in the region increased from 1993 to 2003 by 15 million hectares. As a result, many marginal production systems have declined in importance. For rice, harvested area under the deepwater and upland ecosystems (where yields are low) declined by 25 percent from the late 1970s to the early 1990s. During the same period, the share of rice area that is irrigated in Asia (excluding China, where nearly all rice is irrigated) increased from 35 to 44 percent (Huke and Huke, 1997). The increased prevalence of irrigation appears to have contributed to stabilizing aggregate rice production in Asia and helping to make the world rice market more stable than it was in the 1970s (Dawe, 2002). Nevertheless, the rate of increase in irrigated area was slower in recent years than in earlier decades.
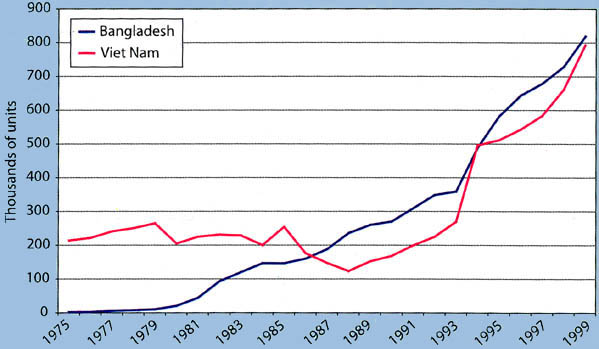
The continued increases in irrigated area do not mean that large dams continue to be constructed at the same rates as in the past. Instead, much of the new irrigation uses pumps to extract water from subsoil reservoirs, drainage canals or creeks and streams. For example, in Pakistan, tubewells and other wells accounted for more than half of growth in total irrigated area from 1961 to 1981. From 1982 to 1995, all of the growth in irrigated area came from tubewells, with the area irrigated by other sources actually declining in absolute terms. Rapid growth in pump irrigation has also occurred in Bangladesh, India, Sri Lanka and Viet Nam, among other countries (Dawe, 2005b; see Figure 6).
|
Figure 6. Number of operating tubewells (Bangladesh) or agricultural pumps (Viet Nam), 1975 - 1999
|
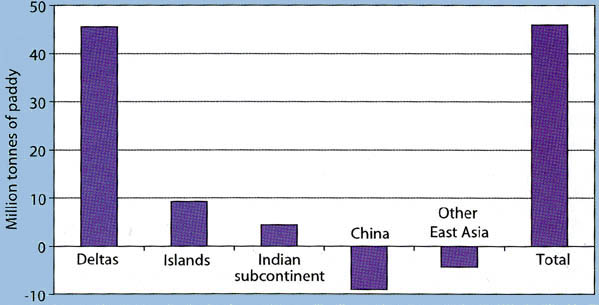
The rapid spread of pump technology that allows greater control over water resources has shifted the comparative advantage of rice production within the region. Nearly all the increases in Asian rice production during the past decade came from the delta areas of mainland SE Asia, Bangladesh and eastern India, all of which are well endowed with water (see Figure 7). Greater control over water can increase cropping intensity, as in the Central Plain of Thailand, and spur adoption of modern varieties, as in Bangladesh and eastern India. This shift in comparative advantage suggests that the delta countries, in particular those in mainland SE Asia where population densities are relatively low, will be an important future source of rice supplies for the world market.
|
Figure 7. Change in rice production, 1992 - 1994 to 2002 - 2004
|
Pump irrigation creates natural incentives for farmers to be more careful in water management because they face a positive marginal cost for energy every time they irrigate, even if the water itself is free. However, government policies to subsidize electricity for pumping can reduce or eliminate this incentive. The money spent on such subsidies could usefully be redirected to public goods such as agricultural research, education, rural roads, clean drinking water or immunizations. Lack of incentives to manage water carefully can also lead to resource overexploitation. Draw down of water tables that exceeds natural recharge is not necessarily a negative outcome (there are not many who would argue that oil or mineral resources should never be exploited), but it can create problems when it is so rapid that the change becomes difficult to manage, forcing farmers to abandon agricultural land because of deteriorating water quality and land salinisation when they do not have alternative sources of income.
While increased groundwater pumping has improved farmers' control over water and access to safe drinking water, groundwater resources in parts of Bangladesh, Cambodia, China, India and Nepal contain high levels of arsenic affecting drinking water quality. Irrigation with arsenic contaminated water can also result in accumulation of arsenic in the rice grain and the soil, but more research is needed in order to quantify the severity of these effects on food safety and food security.
Incentives for careful water management are less prevalent in gravity flow surface irrigation systems, as Asian farmers do not usually pay for such water, or pay a flat fee that is not dependent on the quantity of water used. These irrigation systems also typically fail to provide water in a reliable and flexible manner that can support farmers who are facing shortages because of competition from industry or who want to diversify cropping patterns, and conjunctive management of surface and groundwater is rare. Nevertheless, even in the absence of prices, some farmers living near urban areas are being forced to manage gravity flow water more carefully, as water is reallocated by administrative fiat away from agriculture and toward the industrial and household sectors. Farmers in the upstream ends of irrigation systems often impose a similar discipline on downstream farmers. However, in the absence of property rights or marginal water pricing, such reallocation can be arbitrary, and it often fails to maximize equity, economic efficiency or the productivity of scarce water (Rosegrant and Binswanger, 1994).
While surface water pricing for individual farms is not likely to be cost-effective given the small farm sizes prevailing in Asia, China has developed a system of pricing water volumetrically to groups of farmers. For large groups of farmers, this system may not provide proper incentives because of free-rider problems. As a possible solution, some irrigation systems in China temporarily assign property rights over water to individual water managers. They are allowed to collect water fees from farmers based on historical quantities used, but have to pay only for water actually withdrawn, which gives financial incentives to the manager to reduce water inputs (Wang et al., 2005).
Improved planning of water resource use, including incentives for surface water management, improved water control structures and capacity building for irrigation system managers, will be important given rising agricultural wages and the greater importance of non-farm income in household livelihoods. These two trends are reducing the desire of many farmers to participate in water management, as has happened in the famous subaks of Bali and many other irrigation systems. More attention to individual financial incentives that combine property rights and marginal water pricing, such as those being tested in parts of China, may lead to greater water productivity than does the standard approach to participatory irrigation management, where the financial incentives are more muted.
Fertilizer and pesticides
Over the longer term, consumption of nitrogen (N) fertilizer per hectare of crop area harvested has steadily increased in most of Asia. In E Asia, growth has been especially rapid, from 69 kg nitrogen (N) per hectare in 1978 to 155 kg N per hectare in 2002. Growth has also been rapid in SE Asia and SSW Asia, but much less than in E Asia. As a result, current levels of N use are much higher in E Asia than in SE Asia and SSW Asia. Consumption of phosphate (P) and potash (K) fertilizer has also grown rapidly, sometimes at rates exceeding the growth in N consumption. However, there are many areas where soil nutrients are being mined, e.g. many intensive rice systems are exhibiting negative K balances (Dobermann, Witt and Dawe, 2004). In some cases, reversing these imbalances will lead to higher profits for farmers.
Inorganic fertilizers make a major contribution to lowering per tonne production costs of food. In turn, affordable prices for food increase caloric intake of the poor and reduce the prevalence of being underweight, which the World Health Organization recently cited as the most dangerous health problem in the world. Thus, fertilizer makes important contributions to improving human health. On the other hand, fertilizer runoff from agricultural production, especially N, contaminates water supplies. For example, Chinese rice farmers often use inappropriate types (ammonium bicarbonate instead of urea) and excessive quantities of N (180 kg per hectare or more), leading to low recovery efficiencies of 35 percent or less. In addition to reducing farmer profits, the lost N from crop (and livestock) production also contributes to the creation of "dead zones" in the East China Sea at the mouth of the Yangtze River (Li and Daler, 2004). Such dead zones can devastate fishing grounds and the livelihoods of those who depend on them for sustenance and income. Improving recovery efficiencies will require investments in human capital, both for extension agents and for farmers. In other parts of Asia (e.g. Cambodia, parts of the Philippines), it is probably beneficial to increase N use, but higher recovery efficiency will also be important in these areas.
In the wake of rising prices for petroleum and natural gas, urea fertilizer prices on the world market more than doubled from 2002 to 2005. World market prices for triple superphosphate (TSP) and potash also increased, but to a much smaller extent. Fertilizer subsidies are less common in Asia than they were twenty years ago, so rising prices have often been passed on to farmers, putting downward pressure on profits. The effects are smaller than commonly supposed, however, because costs of labour, land and management account for most of the gross value of production. For example, nitrogen fertilizer typically accounts for less than 10 percent of the gross value of rice production in intensively managed systems. Thus, a doubling of urea prices has the same effect on rice farmers' income as a 10 percent decline in the price of paddy.
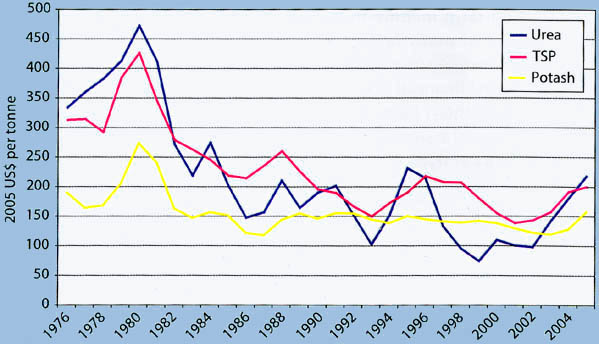
Despite the recent surge, world market fertilizer prices in 2005 (after adjusting for inflation) for urea, TSP and potash were at similar levels as in 1995 (see Figure 8), and, in the case of urea and TSP, were much lower than in the early 1960s, on the eve of the Green Revolution. Compared with 1963 - 1965, prices for TSP in 2005 were 28 percent lower. In 2005 US dollars, urea prices were about $500 per tonne in the early 1960s, compared with $219 per tonne in 2005. It is not clear how future prices for petroleum, natural gas and urea will evolve. For example, after the second oil shock in 1980, urea prices declined 69 percent in real terms in just six years. Of course, that may not happen this time.
|
Figure 8. Inflation-adjusted world market fertilizer prices, 1976 - 2005
|
The recent rise in fertilizer prices may encourage some farmers to adopt organic agriculture. But the magnitude of this shift will likely be small because of inorganic fertilizer's small contribution to production costs. While organic agriculture occupies an important market niche, that niche is small. Adoption rates are less than one-tenth of one percent of arable and permanent agricultural land in nearly all developing economies in Asia and the Pacific (FAO, 2005c), suggesting that most farmers do not believe that organic agriculture can produce food at competitive costs. While production costs per hectare in organic agriculture are sometimes lower than in conventional agriculture, production costs per tonne of output are typically higher, which means that organic farming is profitable only if the output can be sold at higher prices. Indeed, prices for organic output are higher, but in developing countries, this higher price consigns such produce to niche markets. Furthermore, organic farming is ecologically sustainable only in a limited set of environments.
Because of problems with data availability, it is difficult to paint a general picture of trends in pesticide use. However, the perceptions of many farmers, extension service providers and even policy-makers regarding the magnitude of crop losses caused by insect pests are often greatly exaggerated (Heong and Escalada, 1997). Thus, it is important to minimize the negative health effects that pesticide (especially insecticide) applications can have on farmers, who often spray with little or no protection. This can be done by educating farmers in integrated pest management (IPM) as promoted by FAO, through innovative media campaigns and by strengthening regulatory enforcement. Plant breeding can also offer improved pest and disease resistance in new varieties.
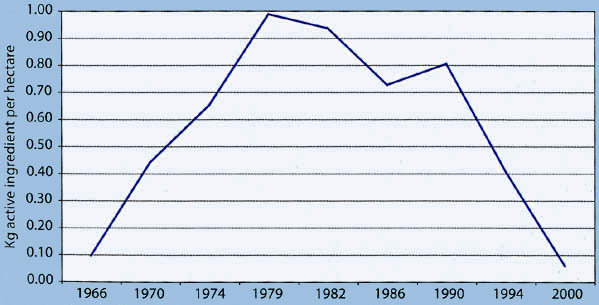
One positive example is the steady reduction in insecticide use on rice in the Central Luzon rice bowl of the Philippines during the past twenty years. Application rates are now lower than before the Green Revolution (see Figure 9). During the same time, rice yields in this area increased. Another potential means of reducing insecticide use is Bt cotton, a genetically modified crop that is now being widely adopted in China and India, where collectively more than 70 percent of the region's cotton is produced. Reports appear to indicate that insecticide use with Bt cotton has fallen dramatically and that farmers' health has improved (Pray et al., 2002).
|
Figure 9. Insecticide use by rice farmers in Central Luzon, Philippines, 1966 - 2000
|
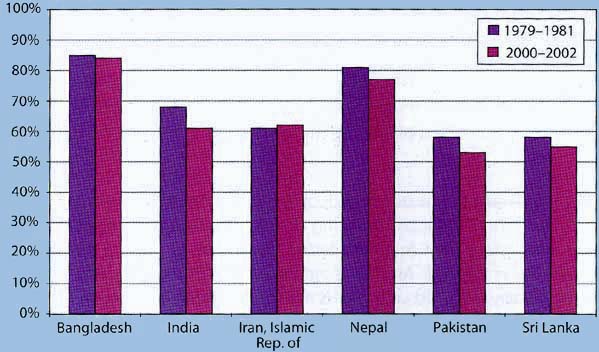
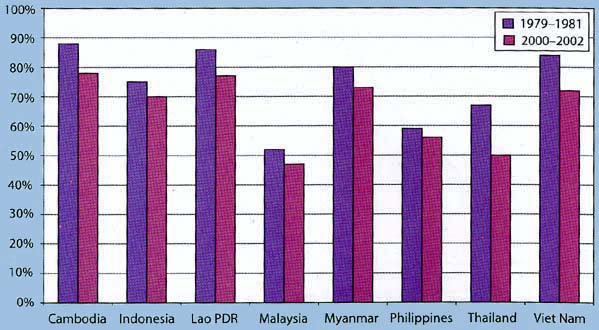
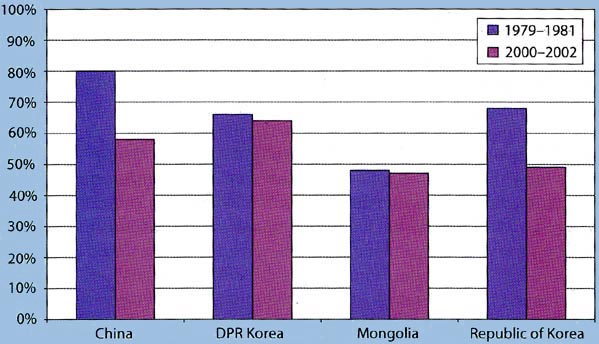
Income growth leads to many changes in diets. Bennett's Law, a well-known regularity in the development process, states that the proportion of calories from starchy staple foods (grains, roots and tubers) in total calories declines as income increases. Because of the widespread economic growth in the region, such a decline has occurred in nearly all developing countries in Asia and the Pacific during the past 20 years (see Figures 10a to 10c).
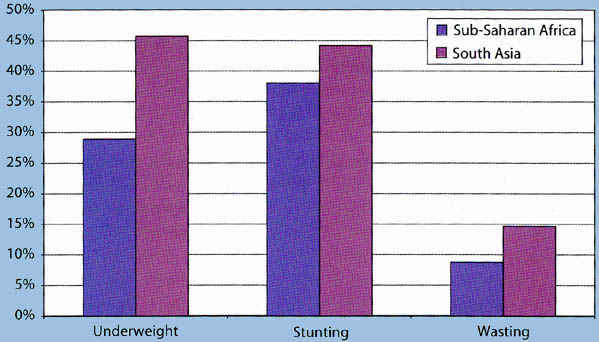
As caloric intake has increased and diets have diversified, anthropometric indicators (e.g. weight for age) have improved substantially for children under five in nearly all countries in the region since 1990. Data collected by the World Bank (2006) show that the prevalence of stunting declined from 32 percent in 1992 to 17 percent in 2000 in East Asia and the Pacific, while South Asia showed a decline from 62 percent in 1990 to 46 percent in 1999. The prevalence of underweight also registered declines in both of those two regions during the 1990s (18 to 14 percent in East Asia and the Pacific, 62 to 48 percent in South Asia). Although these indicators of nutritional status have improved in South Asia, the incidence of underweight, stunting and wasting in South Asia is much higher than anywhere else in the world, including sub-Saharan Africa (see Figure 11). For example, the most recent data from the United Nations Childrens Fund (UNICEF, 2006) indicate that underweight prevalence is 46 percent in South Asia compared with 29 percent in sub-Saharan Africa. In South Asia, females are also slightly more likely to be underweight (47 percent) than are males (44 percent). In addition to increased availability of food, both the education and status of women have been shown to make large contributions to the reduction of child malnutrition (Smith and Haddad, 2001).
|
Figure 10a. Percentage of calories from starchy staple foods, South and Southwest Asia, 1979 - 1981 and 2000 - 2002
|
|
Figure 10b. Percentage of calories from starchy staple foods, Southeast Asia, 1979 - 1981 and 2000 - 2002
|
|
Figure 10c. Percentage of calories from starchy staple foods, East Asia, 1979 - 1981 and 2000 - 2002
|
|
Figure 11. Incidence of underweight, stunting and wasting in children under 5, sub-Saharan Africa and South Asia
|
Staple foods
As diets in the region are diversifying away from staple foods, diversification is also taking place within the category of starchy staples. For example, in southern India, the importance of rice is declining as consumption shifts toward wheat. But in northern India, where wheat is the traditional staple, demand is shifting from wheat to rice (Pingali and Khwaja, 2004). Similar trends are taking place in northern and southern China. In SE Asia, where rice is the staple food and wheat is not grown, a shift from rice to wheat has been taking place in several countries. The process is well underway in Malaysia, the Philippines, Thailand and Indonesia, is just starting in Viet Nam, but has not yet begun in Cambodia, Lao PDR and Myanmar. Some of the shift from rice to wheat products is also because of increased convenience in terms of less preparation time, which is important as populations become more urbanized. Starchy roots are an important staple food in many Pacific Island nations, in addition to cereals. Per capita consumption of starchy roots has declined in several of these countries in favour of cereals since 1980, e.g. Samoa, Solomon Islands and Tuvalu.
Despite a shift towards rice in specific parts of India and China, per capita demand for rice is now stagnant at best in most countries of the region, and is declining in others. Per capita consumption in Japan was just 58 kilograms in 2002, compared with 111 kilograms in 1961. Sharp declines have also been experienced in Malaysia, the Republic of Korea and Thailand. Per capita rice consumption in China is well below its peak, and in India it has been essentially stagnant for a decade. These trends do not imply that Asian diets will become westernized in the sense that wheat replaces rice as the major source of calories. Even in Japan where per capita income is very high, rice still provides considerably more calories than wheat, and there is no doubt that the Asian preference for rice will remain for many years to come. On the other hand, the only factor now sustaining growth in rice demand in Asia is population growth, but this is slowing in most of the region. It is difficult to know how much longer aggregate regional rice demand will continue to increase, but at a minimum it is clear that it will not be a dynamic source of demand growth for farmers.
While the importance of rice is declining, especially for middle-class households, it is important for development efforts not to become overly focused on agricultural products with high value-added potential. Rice often provides two-thirds of calories for the poor and can account for 20 to 40 percent of total household expenditures (Dawe, 2000). Furthermore, in most countries in SSW Asia and SE Asia, the poorest of the poor are more often rice consumers than rice farmers. Because so much of the poor's income is spent on rice, it is important to reduce that burden by lowering the retail price. One study in rural Central Java in Indonesia (Block et al., 2004) found that when rice prices increased in the late 1990s, mothers in poor families responded by reducing their caloric intake in order to better feed their children, leading to an increase in maternal wasting. Furthermore, purchases of more nutritious foods were reduced in order to afford the more expensive rice. This led to a measurable decline in blood haemoglobin levels in young children (and in their mothers), increasing the probability of developmental damage. A negative correlation between rice prices and nutritional status has also been observed in Bangladesh.
Lower rice prices will be more sustainable if they come about through improvements in productivity that lower production costs per tonne and allow rice farmers to increase profits at the same time that consumers benefit from lower prices. Scientific research is critical to this process of increasing productivity and thus needs to be widely supported by the public sector. While agriculture in general needs public support, it is particularly important for rice because it is the most important commodity for the Asian poor. In addition to this socio-economic dimension, there is also a technical reason for public support: rice is a self-pollinating crop. Such crops tend to have a homozygous genome, which means farmers can save their own seeds without a substantial loss in yield for subsequent crops. This reduces the financial incentives for the private sector to breed new seeds and suggests a stronger role for the public sector. Hybrid rice, which is heterozygous, may change this equation in the future and allow for more private sector participation, but for the moment inbred rice still dominates the Asian landscape.
Dietary transitions
For most developing countries in Asia and the Pacific, daily per capita fat consumption has increased substantially since the early 1960s, and it continued increasing during the 1990s. Led by rapid growth in China, the largest increase from 1990 - 1992 to 2000 - 2002 among subregions was in E Asia. Gains were more moderate in SE Asia, SSW Asia and the developed economies, while per capita intake of fat actually declined in Central Asia and the Pacific Islands. It should be noted, however, that the level of fat intake in these latter two subregions, even after the decline, is still greater than in SE Asia and SSW Asia. Much of the increased fat consumption since 1990 has come from animal products, but a large proportion has also come from vegetable oils.
The percentage of calories in the diet coming from fat has increased substantially since 1980 in most countries in the region. It is an open question how far this trend will continue. For example, it reached a peak of 32 percent in Malaysia in 1990, but has declined since then to 25 percent. Even in developed Japan, it is 27 percent, much below levels in Australia, New Zealand and the United States of America (38, 32 and 37 percent, respectively). Thus, Asian diets may not become as fatty as those in Western countries. However, fat intake will probably continue to rise in SE Asia and SSW Asia, as the current percentage of calories coming from fat for most countries in these two subregions is less than 20 percent.
Protein consumption per capita increased substantially among developing countries in E Asia, SE Asia and the Pacific Islands since 1990. Gains in SSW Asia were small, however, and Central Asia experienced declines. Growth in protein consumption was generally slower than growth in consumption of fats. The percentage of protein that comes from animal sources increased from 1990 - 1992 to 2000 - 2002 in E, SE and SSW Asia, while it was essentially constant in Central Asia and the developed economies. In the Pacific Island nations, this percentage declined during that period. In the developed economies of the region, animal protein accounted for 58 percent of total protein in 2002, while it was less than half in all other subregions. The lowest percentage occurred in SSW Asia (20 percent), where poverty is particularly widespread and vegetarianism is practiced by many.
While the gap in protein consumption between the developing countries of Asia and the Pacific and developed nations is narrowing, this does not imply that diets are becoming homogeneous, as fish and seafood account for a much larger proportion of protein (relative to meat and poultry products) in Asia and the Pacific than in the rest of the world. Even in Japan, which is as wealthy as the major Western economies, fish and seafood supply 50 percent more protein than meat, while in Australia and the United States of America meat supplies eight or nine times as much protein as fish and seafood. Thus, while growth and globalization are causing profound transformations in diets, there is still tremendous heterogeneity across countries and it appears these differences will remain for many years to come.
With increased agricultural trade, it is more common today to find temperate zone fruits in tropical developing countries. While these fruits may be easy to find on supermarket shelves, they have not substantially affected the consumption patterns of most Asians in developing countries. In Malaysia (the wealthiest tropical member state in the region), bananas and pineapples contribute more than six times as many calories as do apples and grapes, and in the Philippines the ratio is about 80 to 1. On the other hand, tropical fruits have had more success in temperate countries. In Japan, imported bananas contribute almost as many calories as do apples, and in the United States of America they contribute more.
During the past twenty years, several developments have combined to increase trade in agricultural products. Transportation and communication infrastructure has improved substantially in the region. For example, in India, there were 3.3 million kilometres of roads in 2002, up from 2.0 million in 1990. The cellular telephone network is expanding rapidly, allowing farmers and traders to communicate more easily about current trends in prices. In the Philippines in 2003, there were 270 cellphones per thousand people, up from essentially zero a decade earlier. In Bangladesh, there were only 10 per thousand people, but many more have access through rental markets (all data in this paragraph come from World Bank, 2006). Rapid economic growth and urbanization, as discussed earlier, have increased the demand for more diversified diets that rely on specialized production from other localities. Tariffs and non-tariff barriers (NTB) on international trade are lower.
Domestic marketing
While international trade is important, most food production in Asia is directed to domestic markets, and most consumption comes from domestic food production (Japan and the Republic of Korea are exceptions to the latter generalization). Large changes are taking place in these domestic marketing systems, many of them associated with the rise of supermarkets. In Asia supermarkets are expanding into poorer neighbourhoods, smaller towns and rural areas, targeting low and middle-class consumers. The purchasing practices of the supermarkets are transforming agri-food markets in Asia with important implications for small farmers and rural communities. In Thailand, for example, about 10 percent of all farmers in 2003 were operating as contract farmers, compared with a negligible percentage a decade earlier (see the box "Can contracts help small farmers participate in more globalized food chains?" for more discussion of this increasingly common institutional arrangement). Reardon et al. (2003) estimates that supermarkets accounted for 30 percent of retail food sales in SE Asia in 2002, up from just 10 percent a decade earlier. Food procurement and distribution systems are becoming more centralized, although it is important to remember that most Asian farms remain small.
Large firms can bring needed investment capital, working capital and knowledge, but they may be reluctant to deal with small producers because of high transactions costs. The development of suitable marketing intermediaries that can utilize the comparative advantages of small farms (e.g. in crops that require labour-intensive production) will be important to bridge this gap. Fundamental changes in small farms need to occur in order for them to provide what supermarkets demand in terms of quantity and quality. They often have to comply with certification requirements that are more stringent than official food safety standards. Meeting the demands of procurement officers requires skills and technology that small farmers often do not have. They may have to invest - individually or collectively - in irrigation, greenhouses, trucks, cooling sheds and packing technologies. Farmers need to be able to sort and grade their produce, meet timing and delivery requirements and document their farming practices. In addition, they should be able to bridge the gap between delivery and payment, which presupposes access to credit.
Downstream, the changes have potential benefits for consumers in terms of achieving greater variety, reduced seasonality and lower prices of food products. In terms of food safety, tracing the source of food contamination has become easier, but there is also a risk that the entry of unsafe food into the food chain is rapidly distributed. Supermarkets are raising food quality standards, but there is still an important regulatory and oversight role for governments.
International trade
As regards international trade, many countries have lowered agricultural tariffs and non-tariff barriers, and applied tariffs in most countries are well below the maximum allowed under World Trade Organization (WTO) agreements. Many tariff reductions have been unilateral, and bilateral/subregional agreements have further lowered tariffs for selected trading partners. Dowlah (2003) found that the unweighted average tariff in Bangladesh for agricultural products declined from 76 percent in 1991 - 1992 to 34 percent in 1998 - 1999, with similar trends in import weighted tariffs and the effective rate of protection. China lowered its most favoured nation (MFN) tariffs on agricultural products from 46 percent in 1992 to 19 percent in 2001, while India lowered its MFN tariffs from 66 percent in 1990 to 42 percent in 2001 (FAO, 2005a). Non-tariff barriers have also been lowered in many countries. Despite the increased openness to trade, some sensitive commodities remain subject to substantial protection.
One prominent subregional agreement is the Association of Southeast Asian Nations (ASEAN) Free Trade Agreement (AFTA). The first six members of ASEAN have already cut intra-ASEAN tariffs to 5 percent or less on nearly all items (rice being a prominent exception), and the other four members are due to follow by 2010 or sooner. Most non-tariff barriers are also being eliminated. AFTA is further expanding to include China, Japan and the Republic of Korea (AFTA plus 3). Other subregional agreements include the South Asia Free Trade Agreement (SAFTA) and the Pacific Island Countries Trade Agreement (PICTA), and there are many bilateral trade agreements as well (e.g. between Thailand and China for fruits and vegetables; see Bilaterals.org, 2006). Generally speaking, freer trade is beneficial, but changes in trade policy create both winners and losers. It is important that the interests of the poor be fully considered in designing and implementing agreements (see the feature on "Trade liberalization, poverty and food security").
Because of improved infrastructure, changes in demand and more open trade policy, international agricultural trade today is substantially more important throughout Asia and the Pacific than it was in the early 1960s. During the past ten years (from 1994 to 2004), trade volumes (both imports and exports) have continued to grow in nearly all member states. Given the rapid growth of Asia - Pacific economies, much of the increased agricultural trade has been within the region. In 1987, 38 percent of agricultural exports from Asia - Pacific economies had destinations elsewhere in the region, but by 2003 this percentage had increased to 48 percent. The increase for agricultural imports has been slower. In 2003, 41 percent of all agricultural imports by regional economies came from within the region, compared with 38 percent in 1987 (data from WITS, 2005).
The Asia-Pacific region is a net importer of agricultural products (including forestry and fisheries), as it has been since the middle of the 1960s. SE Asia is the main surplus producing subregion, with a trade surplus in 2003 of about $26 billion. The Pacific Islands and Central Asia are also surplus producers, while East Asia, SSW Asia and the developed economies are net deficit subregions (see Figure 12). The largest net importer is Japan, with a deficit in 2003 of nearly $57 billion. In fact, excluding Japan, the Asia-Pacific region is a net surplus region (data from WITS, 2005).
|
Figure 12. Agricultural trade surplus or deficit per capita by subregion, 2003
|
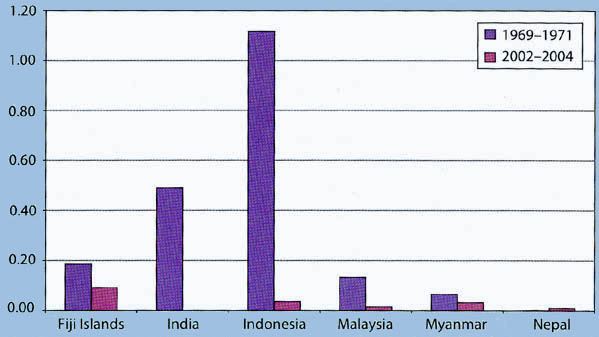
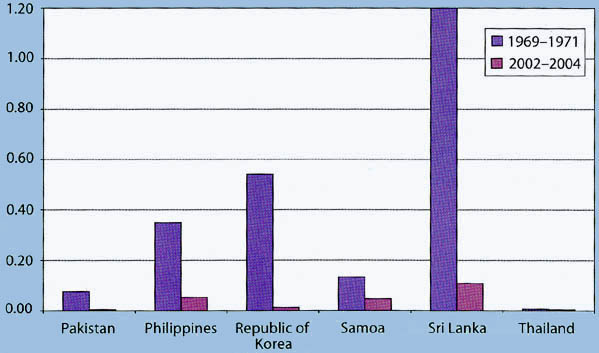
Despite the deficit status of some countries, cereal imports are now less than 10 percent of foreign exchange reserves in most Asian countries, suggesting foreign exchange constraints are not a serious problem in most circumstances (see Figures 13a to 13b; ratios exceeding 100 percent in some particular years were not uncommon 35 years ago). Per capita availability of calories exceeds the minimum dietary energy supply in all member countries for which reliable food balance sheet data are available, with only one exception. Thus, most Asian countries have achieved food security at the national level.
|
Figure 13a. Ratio of the value of cereal imports to foreign exchange reserves, various countries, 1969 - 1971 and 2002 - 2004
|
|
Figure 13b. Ratio of the value of cereal imports to foreign exchange reserves, various countries, 1969 - 1971 and 2002 - 2004
|
Despite the impressive progress in national food security, many households in the region are still food insecure. Household food security depends on access to food, in particular incomes and food prices. On both of these fronts, the situation has improved considerably during the past twenty years. The income of the poorest quintile of the population has increased in most Asian countries (Timmer, 2004; absolute income gaps between rich and poor have widened considerably at the same time) and international prices of cereal crops have declined, while increased productivity has allowed farmers to reap gains that offset the fall in prices.
Because rice is by far the most important source of calories for those Asians who are still food insecure, rice prices are a critical determinant of household food security. Fortunately, prices on the world rice market in 2003 - 2005 were 74 percent lower, in inflation-adjusted US dollar terms, than they were in 1979 - 1981. This improvement is because of lower unit costs of production, as supply has increased faster than demand. For individual countries, world prices are also much lower in domestic currency terms (adjusted for inflation), because real currency depreciation against the US dollar has been much less than the fall in dollar denominated rice prices. Given appropriate policies, the decline in world prices gives the poor increased opportunities to access cheap food.
The world rice market is also more stable today than it was in the past, making it a more reliable source of supplies. The increased stability of prices is because of more stable production and the re-emergence of market oriented exporting nations (e.g. Thailand, Viet Nam) that must be reliable suppliers to the world market in order to ensure the health of their domestic rice economies (Dawe, 2002). As an example of this improved stability, world market prices did not increase in the aftermath of the 1998 El Niño, which led to large production shortfalls in Indonesia and the Philippines and coincided with further losses caused by the "flood of the century" in Bangladesh. World prices did increase about $80 per tonne from 2003 to 2005, but this was a small increase compared with increases in previous decades. In addition, this increase to some extent was simply a recovery from the very low prices prevailing in 2001 to 2002, not just a decline in China's net exports. Prices are still well below the level of ten years ago. While world market instability does not threaten the availability of supplies, it is probably not desirable for all world price fluctuations to be passed on to domestic consumers and producers. Thus, there is still a need for cost-effective national policies to stabilize domestic prices. Such policies should aim to stabilize rice prices but not increase the long-term average, because the poorest of the poor are often rice consumers.
The effects of agricultural subsidies in developed countries on household food security are conflicting. Because subsidies encourage production, they lower market prices, hurting farmers. On the other hand, those lower prices help poor consumers. Thus, any reduction of subsidies will have mixed effects on the poor in the short term, depending on the specific commodity and country. In the longer term, it is even more difficult to ascertain the effects, as removal of subsidies might spur innovation and further productivity gains, as seems to have happened in New Zealand (Federated Farmers of New Zealand, 2002). Such innovation will put downward pressure on prices and hurt farmers that do not increase productivity or add value through downstream processing.
|
[1] In this publication, Asia
and the Pacific includes all 46 members of the Regional Office for Asia and the
Pacific, excluding France and the United States of America as the bulk of their
population is outside the region. Other FAO publications and databases may
include different countries for the Asia and Pacific region. For the purposes of
this document, these 44 countries are divided into six mutually exclusive
subregions defined in later footnotes: East Asia, Southeast Asia, South and
Southwest Asia, Central Asia, the Pacific Islands and the developed
economies. [2] The designations "East Asia and the Pacific" and "South Asia" are those used by the World Bank. They include only developing countries. [3] All instances of $ refer to US$. [4] E Asia is comprised of China, Democratic People's Republic of Korea, Mongolia and Republic of Korea. [5] SE Asia is comprised of Cambodia, Indonesia, Lao People's Democratic Republic, Malaysia, Myanmar, Philippines, Thailand, Timor-Leste and Viet Nam. [6] Unless otherwise noted, most data cited in this report are from FAO (2006a). [7] The developed economies include Australia, Japan and New Zealand. [8] SSW Asia is comprised of Afghanistan, Bangladesh, Bhutan, India, Iran (Islamic Republic of), Maldives, Nepal, Pakistan and Sri Lanka. [9] The Pacific Islands include Cook Islands, Fiji Islands, Kiribati, Marshall Islands, Micronesia (Federated States of), Nauru, Niue, Palau, Papua New Guinea, Samoa, Solomon Islands, Tonga, Tuvalu and Vanuatu. [10] Central Asia includes Kazakhstan, Kyrgyzstan, Tajikistan, Turkmenistan and Uzbekistan. [11] All statements in this paper about trends in world market prices use raw data from IMF (2006). [12] Central Asia is excluded from this calculation for lack of long time-series data. |
![]()
![]()
![]()