Dur, J.C. 1, 2; W. Wiriyakitnateekul 3; G. Lesturgez 2,
4; F. Elsass 1, 5;
M. Pernes 2;
C. Hartmann 4
and D. Tessier 2
Keyword: clay mineral, acidification, analytical transmission electron microscopy, neoformation smetites
|
Abstract Sandy soils of Northeast Thailand are predisposed to high acidification rates due to leaching and the export of alkalinity is associated with crop removal in these intensive cropping systems. Despite significant acid release, soil pH generally remains stable at a threshold value of around 4.0. Low organic matter content and the absence of weatherable primary minerals would suggest that clay mineral dissolution is responsible for the high degree of buffering commonly observed in these soils. The objective of this study was to investigate changes in nature and organisation of clay minerals following intensive cultivation in a typical sandy soil from Northeast Thailand. Surface soils were sampled under a forest (FS) and an adjacent area cultivated for 50 years (CS); they were compared with parent material sampled at 3.5 meter depth (PM) with the aim of characterising the evolution of clay minerals through pedogenesis and cultivation. The proportion of small particles (mode 0.1 µm) decreased according to pedogenesis – from parent material to soil, and land use – from forest to crop. Under the cultivated and forest soils, particles of kaolinite appeared to be very small (0.02-0.10 µm), poorly crystallised and eroded, often organised as aggregates of 1-2 µm. Expandable 2:1 clay minerals were associated with kaolinite. Chemical data of individual particles revealed that kaolinite contained iron and that expandable 2:1 clay minerals were smectite, vermiculite and mixed-layer illite/smectite. X-ray diffraction patterns of <2 µm-fractions indicated that kaolinite was the main phase, 78%, 88% and 88% in CS, FS and PM respectively, smectite being a minor phase with 20%, 6% and 12% respectively. Our results suggest that the dissolution of kaolinite was accelerated in cultivated system (CS), with a correlative neoformation of smectite, which buffers potential declines in soil pH. |
Introduction
Sandy soils are widespread in the tropics and constitute an important economic resource for agriculture despite their inherent low fertility (FAO, 1975). Such soils occupy a large area of the Northeast Thailand plateau (Ragland and Boonpuckdee, 1987). These soils are often characterised as being of a light sandy texture, acidic to depth (pH around 4.0 in CaCl2) with very low exchange properties (CEC <2 cmocl kg-1) and therefore a low nutrient supplying capacity (Imsamut and Boonsompoppan, 1999). Soil acidification is a major concern in tropical sandy soils since climate and high leaching rates are prevailing conditions for the development of this phenomenon. Intensive cultivation results often in accelerated acidification which has brought into question the long-term sustainability of agronomic production systems (Helyar, 1976).
In Northeast Thailand, degradation of acid sandy soils by further acidification under permanent agriculture has been clearly highlighted (Noble et al., 2000). However accelerated acidification occurs sometime without pH drop in these acid sandy soils (Lesturgez et al., 2005). Regarding the low organic matter content and the absence of other weatherable minerals, the authors suggested the role of clay minerals in buffering the soil pH.
In order to ascertain the role of clay minerals in buffering capacity, a mineralogical study has been conducted in Northeast Thailand with the objective to identifying changes in nature and properties of clay minerals possibly induced by 50 years of intensive cultivation. The study has been conducted on a forest soil, an adjacent cultivated area and the parental material of these soils in order to highlight (i) general clay properties of the soils, (ii) evolution following pedogenesis and (iii) changes induced by 50years of intensive cultivation.
Materials and methods
Site and sampling
The study was conducted on a representative upland sandy soil of Northeast Thailand. The site selection was based on previous studies (Lesturgez, 2005) and a paired site approach was conducted to quantify differences between Dipterocarp forest (undeveloped) and agricultural (developed) areas. The soil at the studied sites belongs to Warin soil series (N 16º16′; E 102º47′): Dipterocarp forest and adjacent cultivated land that was deforested 50years ago and used for cassava and sugarcane cultivation to date. The same soil type was observed in both areas with little topographical differences (i.e. slope) between these two areas. The undisturbed Dipterocarp forest, close to agricultural field, had a well-defined boundary to separate the two land use systems. Selected characteristics of the soil at the studied sites are presented in Table1. Samples were collected at 0-10cm depth both in the soil under forest (FS) and in adjacent cultivated area (CS) and at 3.5 m depth for parent material (PM). Samples were air-dried and passed through 2mm sieve.
X-ray diffraction (XRD)
40g sub-samples of air -dried material were dispersed in water overnight by shaking. Clay fractions (<2 µm) were obtained by sedimentation from the initial samples after organic matter oxidation (H2O2-treated clay). Mineralogical analysis was performed by X-ray diffraction on oriented samples obtained by sedimentation of the <2 µm fractions on glass slides and air-dried. Samples were run in a Siemens D5000 system with CoKα radiation. The diffraction patterns were decomposed into elementary curves using the program DECOMPXR (Lanson, 1997) in order to quantify the proportion of different clay minerals. The decomposition was done on the 1st order diffraction peaks for kaolinite, illite and smectite (or vermiculite).
Table 1. Selected properties of the studied soils
| Horizon | Depth (cm) | Particle size distribution | pH | Bulk density (Mg.m-3 ) |
||
| (%) | ||||||
| Sand | Silt | Clay | ||||
| Forest soil (FS) | ||||||
| A | 0-15 | 78.7 | 18.5 | 2.8 | 5.4 | 1.4 |
| E | 15-65 | 74.9 | 18.0 | 7.1 | 5.2 | 1.4 |
| B1 | 65-120+ | 67.9 | 15.3 | 16.8 | 4.9 | 1.5 |
| Cultivated soil (CS) | ||||||
| Ap | 0-15 | 80.5 | 16.8 | 2.7 | 4.6 | 1.6 |
| E | 15-65 | 71.2 | 16.9 | 11.9 | 4.8 | 1.6 |
| B1 | 65-120+ | 64.0 | 15.2 | 20.8 | 4.6 | 1.5 |
| Parent material (PM) | ||||||
|
PM |
350 | 77.4 | 9.5 | 13.1 | – | – |
Laser granulometry (LG)
Particle size distributions (PSD) were measured on <2 µm fractions dispersed in distilled water (ultrasound ~15 min). The quantity of material was adjusted in order to obtain adequate particle concentration (obscuration = 45%). PSD was produced using a LS-230 Beckman-Coulter laser grain-size analyser, with a range of particle size from 0.04 to 2000 µm, divided into 116 fractions. PSD was performed under agitation of clay suspension in the measuring cell. Three repeated measurements were undertaken in each sample.
Analytical transmission electron microscopy (TEM-EDS)
Dispersed clay suspensions were deposited on collodion-coated Cu grids and air-dried. Images were produced in a Philips 420 STEM transmission electron microscope operated at 120kV and equipped with a Megaview II CDD camera. Magnification at 10500x covered the particle-size ranged from 0.5-2.0 µm and magnification at 31000x ranged from 0.05 µm-1.00 µm.
Microanalyses were performed using an Oxford INCA energy dispersive spectrometer (EDS) with an ultrathin windowed Si (Li) detector connected to the microscope. In order to limit irradiation damages, analyses were done using a probe spot 100nm in diameter (Romero et al., 1992). The chemical compositions (Al, Si, K, Ca, Mg, Fe, Na and Ti) were determined on individual particles selected regarding dispersion. A minimum of 100 particles was analysed for each sample in order to get a representative set of data. Minerals were identified by their chemical compositions, on the basis of calculated structural formula expressed in number of constituting cations. Quantitative discriminations were used to sort particle analyses into mineralogical classes (Figure1).
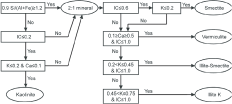
Figure 1. Procedure for identifying clay minerals using analytical data from TEM-EDS. Numbers of atoms in structural formulae are calculated on the basis of 11 and 7 oxygen atoms per half cell for 2:1 and 1:1 clay minerals, respectively. Si, Al, Fe, K, Ca: number of atoms in the calculated structural formula. IC: Interlayer Charge Value (Ca2+ + Na2++ K+) of the particle
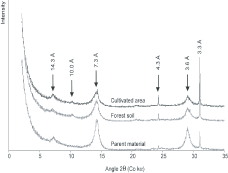
Figure 2. X-ray diffractograms (Co kα) of clay fractions (<2 µm) for cultivated soil, forest soil, and parent material
Results
Mineralogical determination of clay fraction by XRD
XRD patterns indicated the presence of quartz (4.3 and 3.3Å), kaolinite (7.3 and 3.6 Å) and 2:1 clay minerals (illite at 10.0Å and smectite at 14.3Å) in all three samples (Figure2). The intensity of quartz peaks (4.3 and 3.3Å) was higher in soils (CS and FS) than in parent material (PM). According to peak intensity, kaolinite was the main crystalline phase with 78%, 88% and 88% in CS, FS and PM, respectively (Table2). On the other hand, the proportion of smectite was only of 20%, 6% and 12% in CS, FS and PM respectively. The diffraction intensity of illite was significant only in FS (6%). As the peaks of kaolinite were very large compared to a reference kaolinite (Brindley and Brown, 1980), they have been decomposed into three elementary peaks modelling crystallinity, each peak position corresponded to a structural order: highly disordered (7.37Å), slightly disordered (7.22Å) and well ordered (7.15Å). The proportion of the three types of peaks within the kaolinite fraction has been recalculated and expressed in percentage of total peak surface (Table3). The proportion of highly disordered kaolinite was equivalent for CS and FS (40%) but lower in PM (34%). The slightly disordered kaolinite was correlatively more important in PM (66%) while the well ordered kaolinite was present only in CS (3%).
Table 2. Selected characteristics of the clay fractions (<2 µm) for parent material, forest and cultivated soil
|
|
Parent material |
Forest soil |
Cultivated soil |
|
|
Mineralogical determination by modelling the XRD diffractograms. Peak surface (%) |
||||
|
Highly disordered kaolinite (7.37 Å) |
30 | 35 | ||
|
Slightly disordered kaolinite (7.22 Å) |
58 | 53 | ||
|
Well ordered kaolinite (7.15 Å) |
0 | 0 | ||
|
Total kaolinite |
88 | 88 | 78 | |
|
Illite (10 Å) |
0 | 6 | ||
|
Smectite (14.3 Å) |
12 | 6 | ||
|
Particle size distribution by laser granulometry. Particle surface area vs. particle diameter (%) |
||||
|
0.04-0.30 µm (%) |
86 | 49 | 37 | |
|
Mode value (µm) |
0.088 | 0.117 | 0.106 | |
|
0.30-10.00 µm (%) |
14 | 51 | 63 | |
|
Mode value (µm) |
0.775 | 0.755 | 0.755 | |
|
Quantitative mineralogy by analytical transmission electron microscopy (TEM-EDS). Particle number (%) |
||||
| Kaolinite | 82 | 42 | 34 | |
| Smectite | 10 | 29 | 54 | |
|
Al-vermiculite |
1 | 12 | 1 | |
|
Mixed layer illite/smectite |
5 | 14 | 3 | |
| Illite | 2 | 2 | 8 | |
Particle size distribution by laser granulometry (PSD)
Particle size distribution (PSD) was expressed in particle surface area (SA) as a function of the particle equivalent diameter. Average and standard deviation of the three replicates are presented in Figure3. Particle size distributions were bimodal shape in all samples. For PM, the main particle size mode was around 0.1 µm (0.04-0.30 µm) and covered 86% of total SA (Table2). PSD for CS and FS had two strong modes around 0.1 µm and 1.0 µm, thus appearing very different from PM. The SA of small particles (mode 0.1 µm) strongly decreased from PM to FS and CS. When comparing FS and CS, the SA of small particles decreased from FS to CS.
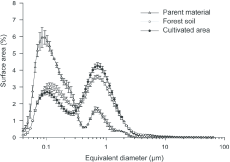
Figure 3. Particle size distributions of clay fractions (<2 µm) for cultivated soil, forest soil, and parent material by laser granulometry
Morphology and chemical composition of particles by TEM-EDS
Examples of TEM images are shown for FS (Figure4). The shape and size of particles were similar in CS and FS. The size of particles observed on TEM images allowed discrimination between quartz grains and clay minerals. Most of quartz grains were the large particles while clay minerals were much smaller (Figure4-A). A significant proportion of small particles was organised into aggregates of 0.5-2.0 µm (Figure4-B). Dispersed kaolinite particles appeared to be eroded both in CS and FS and constituted the majority of PM ranging between 40 and 120nm. A great diversity of particle shapes was observed in Figure4-C.
Analytical transmission electron microscopy (TEM-EDS) revealed that kaolinite contained iron. The 2:1 clay minerals were smectite and mixed-layer illite/smectite in all samples, vermiculite was in FS and illite was only in CS. Smectite was associated with kaolinite in aggregates. Particles of titanium and iron were also detected. The main 2:1 clay mineral was smectite with 54, 29 and 10% in CS, FS and PM, respectively (Table2). Mixed-layer illite/smectite was low in proportion with 3, 14 and 5% in CS, FS and PM, respectively. Al-vermiculite developed mainly in FS (12%). The repartition of clay minerals was determined by EDS following the marked trends between samples, but their proportions were markedly different from XRD determinations.
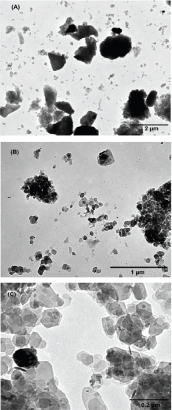
Figure 4. TEM images of clay fractions (<2 µm) for cultivated soil, forest soil, and parent material at magnification ×10500 (A), ×31000 (B) and ×105000 (C)
Discussion
Methodological aspects
When comparing results obtained by XRD and EDS analyses, the discrepancy between quantitative data relates to two essential methodological aspects:
XRD detected well crystallised phases of clay minerals in parent material but it was underestimated for the fine neoformed phases as well as dissolution products in soils. The discrepancy between XRD and EDS is not a trivial issue, but suggests a transition from 1:1 to 2:1 clay minerals in a significant part of the clay fraction.
Mineralogical properties of soils in Northeast Thailand
The studied soils contained a very small quantity of clay minerals. The clay fraction consisted of a mixture of 1:1 (kaolinite) and 2:1 clay minerals (illite and smectite), and contained a significant proportion of small quartz grains as noted in other soils of this region (Bruand et al., 2004). Kaolinite showed crystal disorder (XRD) and appeared to be dissolved (TEM) in soils as well as in parent material. Some iron was detected in kaolinite as a lattice substitution for Al. XRD patterns and EDS analysis confirmed the presence of expandable 2:1 clay minerals especially smectite, but EDS also identified mixed-layer illite-smectite and Al-vermiculite in small proportion. Kaolinite appeared to be disordered in these soils as well as in parent material since the XRD peak around 7A was very lar ge.
Evolution through pedogenesis
To investigate in more detail changes in crystallinity between the different samples, the “kaolinite” XRD peaks have been decomposed. The proportion of highly disordered kaolinite is equivalent in CS and FS but more important in soils than in PM, and slightly disordered is correlatively more important in PM (Table3). Crystal disorder is probably related to kaolinite dissolution. This may be consistent with the hypothesis that kaolinite in parent material was poorly crystallised and this phenomenon has been accentuated by weathering through pedogenesis.
Table 3. Normalised proportions of disordered kaolinite species in kaolinite fraction
|
Parent material |
Forest soil |
Cultivated soil |
|
|
Highly disordered |
34 |
40 |
40 |
|
Slightly disordered |
66 |
60 |
58 |
|
Well ordered kaolinite/Total kaolinite |
0 |
0 |
3 |
Particle size distributions of clay fractions showed the loss of finer particles (mode 0.1 µm) in soils when compared to those in PM. The value corresponding to the loss was 50% for CS and 37% for FS. On the other hand, EDS result indicated a higher proportion of kaolinite in PM (82%) than in the soils (34% in CS and 42% in FS). TEM images showed that the fine particles (mode 0.1 µm) corresponded to fine grained kaolinite. These results strongly suggested that a disappearance (completely dissolved) of the small particles of kaolinite may be due to their dissolution when buffering acid addition and/or their leaching to depth. On the other hand, EDS detected a much higher proportion of 2:1 clay minerals in soils than in parent material, suggesting that the clay neoformation may possibly occur on the basis of degraded kaolinite.
Evolution of mineralogy due to intensive cultivation
Particle size distributions of <2 µm fractions revealed a decrease of finer particles (mode 0.1 µm) in CS compared to FS. On the other hand, EDS analysis revealed a discrepancy in the content of mixed-layer illite/smectite and Al-vermiculite between CS (4%) and FS (26%) and a correlative discrepancy in the content of smectite between CS (54%) and FS (29%). These results pointed out the difference between these two soils: kaolinite dissolution was associated with a neoformation of smectite which appeared to be accentuated in CS.
Conclusion
The aim of this study was to evaluate the evolution of clay minerals, especially kaolinite and 2:1 clay minerals, in acid sandy soils of Northeast Thailand subjected to intensive cultivation. Our results have shown that the main clay mineral is kaolinite. Quartz is also present in all clay fractions but its grain size is coarser compared to clay minerals (TEM images). The presence of expandable 2:1 clay minerals has been highlighted, especially smectite as well as mixed-layer illite/smectite and vermiculite, though in smaller proportions. With respect to kaolinite, the great diversity of morphological shapes, very small particle size and the presence of iron in crystal structure were consistent with a dissolution process due to soil acidification. Kaolinite is thus characterised by fragility under acidic conditions.
Results also indicate, by using three different analytical methods (especially TEM-EDS analysis), that fine kaolinite particles become scarcer with increasing pedogenesis whereas 2:1 clay minerals tend to be neoformed. The first phenomenon may be related to dissolution of fine grained kaolinite particles and/or their leaching to depth. The second phenomenon can be linked to the properties of 2:1 clay minerals which are less readily eluviated.
The neoformation of smectite containing Ca as exchangeable cation appeared to dominate in cultivated soil, whereas in forest soil it appeared to be associated with neoformation of other 2:1 clay minerals such as Al-vermiculite and mixed-layer illite/smectite. Further studies, focusing on the clay evolution in soil profiles, are needed to validate these hypotheses and to investigate the role of smectite in soil pH buffering.
Acknowledgments
This work formed part of a research program funded by the Department of Technical and Economic Co-operation (DTEC), the Land Development Department (LDD), the Institute of Research for Development (IRD) and the National Institute of Agronomic Research (INRA) and this work received a financial support from the French Ministry of Foreign Affairs through the French Embassy in Thailand.
References
Brindley, G.W. and Brown, G. (Editors), 1980. Crystal structures of clay minerals and their X-ray identification, Monograph No. 5. Mineralogical Society, London, England, 495 pp.
Bruand, A., Hartmann, C, Ratana-Anupap, S., Sindhusen, P., Poss, R. and Hardy, M., 2004. Composition, fabric, and porosity of an Arenic Haplustalf in Northeast Thailand: Relation to penetration resistance. Soil Science Society of America Journal, 68, 185-193.
Dudek, T., Srodon, J., Eberl, D.D., Elsass, F. and Uhlik, P., 2002. Thickness distribution of illite crystals in shales. I: X-ray diffraction vs. High-resolution transmission electron microscopy measurements. Clays and Clay Minerals, 5, 562-577.
FAO (Editor), 1975. Sandy Soils (Report of the FAO/UNDP seminar on reclamation and management of sandy soils in the Neareast and North Africa, held in Nicosia, 3-8 December 1973). FAO Soils Bulletin 25. FAO, Rome, Italy, 245 pp.
Helyar, K.R., 1976. Nitrogen cycling and soil acidification. Journal of the Australian Institute of Agricultural Science, 42, 217-221.
Imsamut, S. and Boonsompoppan, B., 1999. Established soil series in the Northeast of Thailand. Reclassified according soil taxonomy 1998. Department of Land Development, Bangkok, Thailand, 154 pp.
Lanson, B., 1997. Decomposition of experimental X-ray diffraction patterns (profile fitting): a convenient way to study clay minerals. Clays and Clay Minerals, 45, 132-146.
Lesturgez, G., 2005. Densification des sols sableux sous culture mécanisée. Cas du Nord-Est Thallandais. Thèse, Université Henri-Poincaré, Nancy, France, 160 pp.
Lesturgez, G., Poss, R., Noble, A., Grilnberger, O., Chintachao, W. and Tessier, D., 2005. Soil acidification without pH drop under intensive cropping systems in Northeast Thailand. Agriculture, Ecosystems & Environment, (Accepted).
Noble, A.D., Gillman, G.P and Ruaysoongnern, S., 2000. A cation exchange index for assessing degradation of acid soil by further acidification under permanent agriculture in the tropics. European Journal of Soil Science, 51, 233-243.
Ragland, J. and Boonpuckdee, L., 1987. Fertilizer responses in Northeast Thailand: 1. Literature review and rationale. Thai Journal of Soils and Fertilizers, 9, 65-79.
Romero, R., Robert, M., Elsass, P. and Garcia, C, 1992. Evidence by transmission electron spectroscopy of weathering microsystems in soil developed from crystalline rocks. Clay Minerals, 27, 21-33.
1 Unité de Phytopharmacie
2 Unité de Science du Sol, INRA, Centre de Recherche de
Versailles-Grignon, Route de St-Cyr, 78026
Versailles,
France, [email protected]
3 Office of Science for Land Development, Land
Development Department, Chatuchak, Bangkok
10900,
Thailand.
4 Institut de Recherche pour le Développement,
UR176
SOLUTIONS, Chatuchak, Bangkok 10900,
Thailand.
5 Present address: Centre de Géochimie de la Surface,
UMR 7517, 1 Rue de Blessig, 67084 Strasbourg, France.
Gillman, G.P.1
Keywords: exchangeable fertilizers, nitrate, anionic calys
|
Abstract Despite the obvious benefits that the use of soluble fertilizers have afforded in raising world food production, there is rising concern about the detrimental effects in terms of economic inefficiency and environmental damage that may ensue if soluble fertilizers are applied inappropriately. This is particularly important in the management of light-textured soils, where leaching losses are common. This paper canvasses the use of a synthetic clay material, Hydrotalcite, for the delivery of anionic nutrients (nitrate, phosphate, sulfate etc.) in an exchangeable and therefore leaching-retarded form. This is analogous to the way nature provides mechanisms for retaining cationic nutrients (calcium, magnesium, potassium etc.) in many soils by the presence of phyllosilicate clays (smectite, kaolinite) as soil components. Anion-loaded hydrotalcite can be applied separately, can be added to conventional (particularly phosphatic) fertilizers, or can be used to stabilize phosphate in feedlot wastes that can then be used as soil amendments. |
Introduction
To meet ever increasing worldwide demand for food and fibre on decreasing areas of land on which to produce them, farmers have turned to high-yielding crop varieties that generally require large amounts of soil nutrients for maximum production. This has led to a dramatic rise in the use of synthetic high-analysis fertilizers, whereby nutrients can be applied in a soluble and therefore plant-available form in a highly efficient manner. An unfortunate down-side of applying soluble fertilizer is the ease with which the chemical species can escape the producers’ fields and pollute off-site environments.
The electrostatic retention of positively charged cationic species on negatively charged particle surfaces in soil is the basis of a well recognized phenomenon, referred to as soil Cation Exchange Capacity (CEC). The subject is exhaustively dealt with in the literature but is perhaps best summarized in a succinct entry in the Encyclopaedia of Soil Science by Bache (2002). In short, the negative charge on the surfaces of soil organic matter and soil clay particles is balanced by accumulation of cations such as Ca2+ and K+ close to these surfaces, affording the cations some protection from leaching, while still being available for uptake by plant roots.
Nature does not provide a similar mechanism for the retention of negatively charged anions in soil, except in the relatively rare occurrence of a small amount of pH dependent positive surface charge in the deeper layers of oxidic soils (Schofield, 1949; Gillman, 1974). Instead, plant nutrients such as N, P, and S are normally retained in the compounds of soil organic matter, and are only released as anions (NO3-, H2PO4-, and SO4=) following organic matter mineralization. Limited amounts of P and S can enter soil solution by desorption from clay surfaces or from dissolution of primary minerals such as apatite and gypsum. The rate of release of N, P, and S from these sources is usually insufficient to satisfy plant demand in intensive agriculture, and synthetic fertilizers containing these anions are therefore applied. Being relatively or highly soluble, they are prone to leaching loss especially in light-textured soils (Brady and Weil, 1999).
A class of clay minerals known as layered double hydroxides (LDH) has in recent years been receiving a good deal of attention because of the wide range of uses to which they can be applied. Uses include catalysts for organic molecule conversion, fire retardants, anion scavenging, and medical and pharmaceutical preparations (Carlino, 1997). A distinguishing feature of LDH clays is their high structural positive charge density brought about by co-precipitation of di- and tri-valent cation hydroxides in proportions that allow the tri-valent cation to occupy some di-valent cation sites. Hydrotalcite (HT) the best known example, forms when 25-30% of the cation sites in the brucite (Mg(OH)2) structure are occupied by Al, leading to a net positive charge that can theoretically reach about 400 cmolc/kg. The similarity between bentonite and HT in the way structural charge arises, leading to intercalation of ionic species with opposite charge, is depicted in Figure 1.
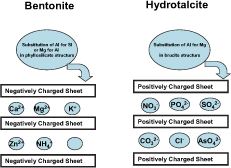
Figure 1. Illustrating the similarities between bentonite and hydrotalcite in the mechanism of retention of cations and anions on their surfaces
The HT used in the above-mentioned applications is usually in carbonated saturated form (CO3-HT) and being of high purity, is expensive. However, technical grade HT, such as Cl-HT or NO3-HT, useful for environmental applications discussed in this paper can be produced less expensively from magnesium sources such as magnesite (MgCO3) or concentrated seawater, and aluminium sources such as bauxite (Al(OH)3) or scrap aluminium (Gillman and Noble, 2005).
This paper discusses the use of HT as a platform for nutrient delivery to soils, more particularly to soils prone to nutrient leaching owing to their light texture. The results of laboratory experiments assessing the resistance of nitrate-saturated HT (NO3-HT) to leaching and to denitrification are presented, along with comparison in greenhouse trials of NO3-HT and urea as a nitrogen fertilizer in sandy soils. Finally, the concept of using NO3-HT to stabilize soluble phosphate in feedlot wastes is canvassed as a means of closing the nutrient cycle in the animal-waste-fertilizer-soil-plant-animal cycle.
Designer Fertilizers Using Hydrotalcite
Three of the macronutrients required by plants viz. N, P, and S can be incorporated into the HT structure as nitrate, phosphate, and sulfate respectively, thereby allowing their addition to soil in exchangeable and therefore slow-release form. Micronutrients that can exist in anionic form (borate, silicate, molybdate etc.) could also be introduced in this manner. Furthermore, by manufacturing a range of HT products, with total saturation of each with only one anion type, complete flexibility is allowed for the design of fertilizer blends that match the requirements of soils and the crops to be grown on them. In fact, by combining this principle with another involving negatively charged substrates (e.g. bentonite) loaded with individual cationic nutrients, a totally flexible Designer Fertilizer concept is achieved (Gillman and Noble, 2005).
Column Leaching Experiment
A 5 g sample of aged NO3-HT was mixed with 500 g of sand, and the mixture placed in a 70 mm diameter Perspex column with a filter paper in the bottom supported by a silk screen. A filter paper was also placed on top to evenly distribute distilled water added at about 2.5 ml/minute, a rate that maintained unsaturated flow conditions. Leachate was collected in 25 ml aliquots for the first 20 pore volumes, and thereafter in 250 ml aliquots until 70-75 pore volumes had been collected. Besides analysing each aliquot for nitrate-N, Mg was also determined to allow estimation of the rate of HT breakdown, as was NH4+, to estimate the amount of residual nitrate associated with NH4NO3 which is a by-product in HT synthesis.
There was a flush of nitrate from the column in the first 4-5 pore volumes, representing about 40% of the nitrate added as HT product (Figure 2). The uppermost curves show the cumulative total amount of added nitrate recovered, while the curve marked ‘Breakdown’ refers to the nitrate fraction associated with HT dissolution, and was calculated from the Mg determination (1 mole of nitrate would be released from HT for every 2 moles of Mg). The ‘Soluble’ curve, prepared from the NH4+ analyses, represents the nitrate associated with residual NH4NO3 not washed from the HT product after synthesis. Finally, the difference between the total amount of nitrate recovered and the sum of breakdown and soluble nitrate, is considered to be the nitrate removed from exchange sites of the relatively stable fraction of the HT.
The relatively high initial nitrate removal rate from the HT (50% at 15-20 pore volumes) is accounted as 22% from HT exchange sites, 20% from residual ammonium nitrate, and about 8% from the dissolution of HT particles. It would appear from these results that NO3-HT added to soil would act as both a ready source of N at the early stage of plant development, and as a reserve source of N at later stages of the growth cycle.
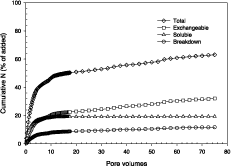
Figure 2. Cumulative amounts of nitrate (% of that applied) leached from a column of sand containing nitrate-saturated hydrotalcite
De-nitrification Studies
An aged HT slurry was dried to a point (dough consistency) where it could be rolled into balls of 4-5 mm diameter, that were then dried at 80ºC. Approximately 0.1 g of material was added to pre-weighed tubes for the accurate recording of particle mass. 50 g of sandy soil from a wheat field, 5 ml of 12 g/l sucrose solution, and 11 ml of water were then added, effecting an N concentration of approximately 100 kg N/kg soil and a C concentration of 500 mg C/kg soil. Forty tubes were prepared in this way to allow 10 tubes to be extracted at four time periods, i.e. after 3, 6, 11, and 14 days, for determination of nitrate remaining. A parallel set of tubes were prepared where 4 ml of 1 mg N/ml of KNO3 solution was substituted for NO3-HT and only 7 ml of water added to keep soil:water ratio constant, but with only 16 tubes to allow 4 tubes from this treatment to be extracted at each sampling occasion. Finally, 8 control tubes with no added N were included to allow 2 controls to be examined each time. The tubes were placed in a desiccator, the air evacuated, and stored at room temperature for the required intervals, at which times the tube contents were extracted with 2M KCl for nitrate analysis of the extracts.
The results of this de-nitrification experiment is summarized in Figure 3. It is clear that the location of nitrate in the HT inter-layers affords some protection, though the mechanism has not been investigated.
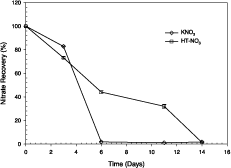
Figure 3. The recovery of nitrate when nitrate was added as nitrate-saturated HT( ), and as potassium nitrate (♦), to a saturated sandy soil with sucrose added as energy source, and stored under vacuum. Vertical bars are the standard error of the mean
The conditions of high vacuum, saturated soil, and adequate energy source were ideal for de-nitrification to occur, so that the rates of loss of nitrate might not be as rapid under some field conditions. The obvious retarding effect of HT warrants further investigation of the use of NO3-HT for the growth of crops such as lowland rice, produced under de-nitrifying conditions. It should be remembered, however, that even in sandy soils, conditions can still exist for de-nitrification to occur when soil is temporarily saturated.
Greenhouse Trials with NO3-HT
This trial compared the use of nitrate saturated HT and urea as sources of N for the growth of tropical maize, and consisted of 4 rates of N (25, 50, 75, 100 kg N/ha) and a control with zero N. The experiment was conducted in 5 kg freely draining plastic pots using a coarse-textured alluvial sand. The two nitrogen sources were applied as granules, drilled as a band across the diameter of the pot. After germination the maize plants were thinned to 4-5 per pot, and the pots were freely watered daily throughout the 9 week growth period. Macronutrients (except N) and micronutrients were applied as required. At harvest, the above ground biomass was dried and weighed to assess Dry Matter production.
The response of forage sorghum to nitrogen added as NO3-HT and as urea growing in a sandy soil under freely-draining conditions is summarized in Figure 4. For N application rates greater than 40 kg/ha, significantly higher yield was achieved with the NO3-HT application. Unfortunately, N content of the herbage was not determined but the plants that received nitrogen as NO3-HT were greener and healthier in appearance than those fertilized with urea.
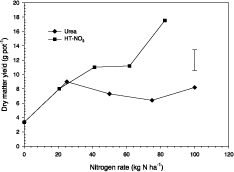
Figure 4. Response to nitrogen applied as urea and as nitrate-saturated HT of tropical maize growing in sandy soil placed in freely-draining pots. Vertical bar represents LSD between two treatment means
Stabilization of Feedlot Wastes
The rapid expansion of Confined Animal Feedlot Operations (CAFOs), more commonly known as Feedlots, has led to huge problems relating to disposal of wastes exiting these facilities. The organic matter and plant nutrient content of the materials make them prime candidates for use as fertilizers and soil ameliorants, but their generally high water content and/or intractable physical properties present major difficulties in respect of handling and storage, transport, and land application. Odour is often a problem if the facilities are located near residential areas. The above-mentioned problems result in concentration of applications of feedlot manure on relatively small areas close to the feedlot.
Nitrogen and phosphorus in the manures are of particular concern because applications of manure in excess of the plants’ capacity to adsorb these elements pose a threat of their escape to waterways, and the subsequent development of anoxic and/or eutrophic conditions. Since a plant’s P requirement is generally much less than that for N, regulatory authorities are devoting increasing attention to the rates of soluble P that can be applied to land.
Hydrotalcite has a high specificity for phosphate, and in this section, the possibility of stabilizing soluble P in feedlot wastes and using the treated material as slow-release fertilizer is canvassed.
Swine lagoon sludge
One of the more common practices for treating the effluent from swine feedlots is to pond the effluent in dams to allow settling of solids for aerobic/anaerobic digestion, and evaporation of some water. The excess supernatant liquid can be re-cycled with additional fresh water to the facility, or it can be used for fertigation of nearby areas. The jelly-like sludge that slowly accumulates in the bottom of the dam has to be removed at intervals, but is difficult to handle owing to its gelatinous nature and its objectionable odour. Also, because of its relatively high soluble P content, there are grave environmental problems associated with applying it too liberally on surrounding land.
Swine lagoon sludge (1 kg) having 89% water content was mixed with 100 g of chloride-HT in a blender for 30 minutes to allow the HT to adsorb soluble P. An amount of powdered bentonite (350 g in this case) was then blended in until a workable ‘dough’ was produced, and this was forced through a perforated plate to form ‘noodles’ that were dried at 80ºC. This product could be easily broken down into granules (Figure 5). A foul-smelling intractable sludge had been converted into an odourless, easily-handled material that had a water soluble phosphate content of 0.2 ppm P, whereas the equivalent dry weight amount of original sludge contained 47.5 ppm P in soluble form.
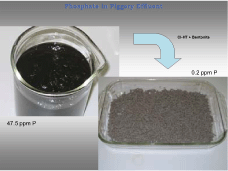
Figure 5. Conversion of swine lagoon sludge to granular fertilizer by addition of hydrotalcite and bentonite, with reduction in water soluble phosphate content from 47.5 mg P kg-1 to 0.2 mg P kg-1
Chicken battery manure
The manure from a chicken battery usually contains far less water than effluent from other animal feedlots, and in fact can be retrieved in a relatively dry form from the battery floor under particular management conditions. The soluble phosphate content is generally high owing to the large amounts of phosphate fed to battery chickens.
To demonstrate the capacity of HT to stabilize this soluble phosphate, increasing amounts of chloride-HT, viz. 0, 0.2, 0.8, and 2.0 g were added to 4 g aliquots of dried chicken manure, and the resultant mixes shaken with 10 ml of distilled water for 18 hours. As evident in Figure 6, the HT was able to greatly reduce P concentration in the extracts, soluble P being converted to an exchangeable form that would be suitable as a slow-release fertilizer.
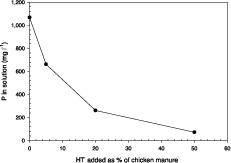
Figure 6. Reduction in water soluble phosphate content in chicken manure extract following incremental additions of hydrotalcite
Stabilization of phosphate in feedlot wastes is of particular benefit when the waste is to be applied to light-textured soils, where the benefits of addition of untreated material would be quickly lost via leaching. Also, production of dry granules allows economic transport over longer distances and easier land application. To achieve a more valuable product, however, other nutrient ingredients, either synthetic or natural, could be introduced at the blending stage to achieve higher and more balanced nutrient contents. In keeping with the overall theme of this paper, it would be preferable if all resultant nutrients were in slow-release form either as exchangeable or sparingly soluble species.
Conclusion
The use of technical grade hydrotalcite as a fertilizer platform, whether carefully designed to deliver specific amounts of anionic nutrients, or incorporated into nutrient-rich wastes to extend their effectiveness, offers great benefits with respect to economic efficiency and environmental protection, especially where agricultural enterprises are established on light-textured soil landscapes. In combination with a similar platform (e.g. bentonite) for delivering exchangeable cations, a complete system of leaching-retarded soil fertilization can be envisaged.
References
Bache, B.W. 2002. Ion Exchange. In: Lal, R., ed., Encyclopaedia of Soil Science, New York, Marcel Dekker, 726-729.
Brady, N.C. and Weil, R.R. 1999. The Nature and Properties of Soil. New Jersey, 12th edn. Prentice-Hall Inc., 881 p.
Carlino, S. 1997. Chemistry between the sheets. Chemistry in Britain, 33, 59-62.
Gillman, G.P. 1974. The influence of net charge on water dispersible clay and sorbed sulfate. Australian. Journal of Soil Research, 12, 173-176.
Gillman, G.P., and Noble, A.D. in press. Environmentally manageable fertilizers: A new approach. Environmental Quality Management.
Schofield, R.K. 1949. Effect of pH and electric charges carried by soil particles. Journal of Soil Science, 1, 1-8.
1 CSIRO Land and Water, Private Mail Bag PO, Aitkenvale. Qld. 4814, Australia
Grünberger, O.1;
J.L. Maeght1; J.P. Montoroi2; S. Rattana-Anupap3;
J. Wiengwongnam3 and C. Hammecker1
Keywords: Salinity, Time Domain Reflectometry, Sandy soils, Rice field, Northeast Thailand
|
Abstract Since the 1960’s salinity has become an increasing constraint for rainfed rice production in the sandy lowlands of Northeast Thailand. In salt-affected areas, during flooded periods, very sharp gradients in salinity occurred inside the soil solutions from the soil surface to 20 cm depth. On the soil surface, water from precipitation and runoff maintain the salt contents at values that are not detrimental to the growth of rice. Inside the matrix of the soil, salt enrichment was found to be related to the ascent of the saline water from the aquifer. During the flooded period, survival of rice depends on the behaviour of a thin (less than 10 cm) fresh water lens. Previous field survey methods for assessment of salinity hazard have relied predominantly on soil conductivity measurements by electromagnetic induction. Although this method has been found useful in this context, its low vertical resolution prevented the detection of sharp salinity gradients at depth that is required to enhance the assessment of saline flooded sandy soils. The objective of the present study was to test the use of TDR measurements to describe the spatial distribution of the fresh water lens and mean conductivity of the top layer soil (0-20 cm) during the flooded period. A survey of water measurements with vertical uncoated waveguides was performed in a salinity contrasted flooded area leading to the measurement of average salinity of the surface soil layer (0-20 cm) and an estimation of the depth of fresh water lens. Surveys with TDR measurement of average salinity of the plough layer and determination of the salinity contrasts inside the first centimeters of the flooded sandy soil was demonstrated to be an effective method of the assessment of salinity hazard. |
Introduction
Time Domain Reflectometry (TDR) has been widely used with the objective of measuring the water contents of soils and the method has been found particularly efficient and reliable in sandy soils. The method is based on the measurement of the time delay between an electrical impulse and its reflection at the end of waveguides implanted in the soil. This delay is related to the permittivity of the soil and then to the water content (Topp et al, 1980). The effect of salinity has been shown to be a limitation of this method, because of its influence on the signal. However, under
particular conditions the salinity effect will allow simultaneous measurement of conductivity and permittivity (Castaglione and Shouse, 2003). Several authors have focused on the responsiveness of TDR probes when the wave guide is implanted across a multilayered media (Nadler et al., 1991; Feng and Lin, 1999; Todoroff and Sun Luk, 2001; Lin, 2003a and 2003b, Oswald et al., 2003). In the case of a soil with contrasting water contents, the apparent permittivity could be computed by summing the propagation times (Topp et al., 1982). This method is known as “refractive index mixing”. Recently, Schapp et al. (2003) demonstrated that “refractive averaging was mostly prevalent when a small number of thick layers are oriented perpendicular to the probe” and arithmetic averaging was found to be more appropriate for multiple small layers systems.
Ploughed layers of sandy soils in flooded rice represented a particular media that is homogenous with respect to saturation in water and uniformity of texture. In salt-affected areas during flooded periods, very sharp gradients in salt contents occurred within the soil solution from the soil surface to 20 cm depth (Quantin et al., 2005; Hammecker et al., 2005). At the soil surface, water from precipitation and runoff maintained the salt content at values that are not detrimental to the growth of rice. However, inside the soil matrix, salt enrichment was found to be related to the ascent of the saline water from an aquifer. During the flooded period, survival of the rice crop was dependent on the behaviour of a thin (less than 10 cm) fresh water lens. Because of the low vertical resolution and the presence of the surface water, electromagnetic induction measurement appeared to be inappropriate to delimitate the fresh water lens. A destructive sampling performed using soil coring under water was likely to modify the fresh water lens behaviour. The objective of the present study was to evaluate the use of TDR measurements to describe the spatial distribution of fresh water lens and mean conductivity of the top layer soil (0-20 cm) during the flooded period in a sandy salt-affected paddy soil under cultivation.
Methods
All experiments were undertaken at the same site, near Khon Kaen in Northeast Thailand (N 16º 22′ 24.3′′E 102º38′43.3′′). The experimental field was selected in order to be representative of rainfed cultivated paddy fields common to the region that are affected by salinity.
Sodium and chloride make up approximately 98% of the soluble components of the soil solution (Saejew et al., 2004).
Salt patches were defined as areas covered with salt crusts in dry season and low yields of rice during the flooded period. Two pairs of soil profiles where studied inside and outside two salt patches. The main characteristics of soil samples in the dry season and ranges of electrical conductivity measurements of soil solution when flooded are presented in Table 1. The ploughed layer was a sandy loam with no significant increase in clay content with depth. In the dry state, bulk density values increased with depth, but development of the high soil strength are not evident during the flooded period. Inside the saline patch, (profiles L25-S and L14-S), the conductivity of soil solution in dry season at 10cm were above 10dSm -1 which is known to be detrimental to rice production (Zeng and Shannon, 2000), in contrast with outside the saline patch (L25-NS and L14-NS) were the conductivity of solutions were suitable for rice production.
TDR measurements were performed using a Trase field system connected to a 20 cm uncoated waveguide with three rods. The time window of the trace acquisition was generally settled to 40 ns which is the maximum value for this type of device. In order to establish conductivity calibration, TDR measurements were performed in a set of solutions with increasing conductivity (Ecs) that were previously measured with a laboratory conductimeter. Calibration of the salinity measurements were based on the method given by Nadler, (1991) with an adaptation due to the larger ranges of values. Equations developed by Dalton et al. (1984) were found to be imprecise for the high and low conductivity values observed in the field. The impedance of the transmission line (RL) was computed from the characteristic impedance of the cable (Z0 = 50 Ω) and the total reflection coefficient (ρt).
Table 1. Selected characteristics of four soil profiles used in the study
| Profile |
Depth |
Saturated paste conductivity a | Conductivity of solutionsb (Flooded period 2003) | Texturee | Bulk Densityf |
|||
|
cm |
(Dry season 2003) | Average | standard error | Sand | Silt | Clay | ||
| dS m-1 | dS m-1 | g.kg-1 | ||||||
| L14-S | Surf.C | - | 1.31 | 0.16 | – | – | – | – |
| 0-10 | 54.1 | 24.71 | 2.05 | 591 | 356 | 52 | 1.72 | |
| 10-20 | 15.6 | 19.65 | 0.90 | 623 | 305 | 72 | 1.84 | |
| L14-NS | Surf.C | – | 1.19 | 0.14 | – | – | – | – |
| 0-10 | 6.4 | 3.49 | 0.43 | 598 | 353 | 49 | 1.69 | |
| 10-20 | 2.7 | 8.14 | 0.36 | 622 | 324 | 54 | 1.81 | |
| L25-S | Surf.C | – | 1.09 | 0.14 | – | – | – | – |
| 0-10 | 27.1 | 16.04 | 1.40 | 627 | 311 | 63 | 1.61 | |
| 10-20 | 19.7 | 27.03 | 0.82 | 700 | 246 | 54 | 1.75 | |
| L25-NS | Surf.C | – | 1.01 | 0.14 | – | – | – | – |
| 0-10 | 12.9 | 6.41 | 0.34 | 679 | 259 | 62 | 1.55 | |
| 10-20 | 6.5 | 10.68 | 0.71 | 703 | 241 | 56 | 1.81 | |
a: Electrical conductivity of saturated paste in dry season, b: Conductivity of surface water and soil solutions from plastic cups at different soil depths (0.1 m and 0.25 m) in bold values indicates conductivity levels that are not suitable for rice production; c: Surface water e: Pipette method, f: 100 cm3 cylinder method (average of 5 replications) in dry season 2003.

where ρt was computed from the initial voltage value of the traces (V0) and the last value of the response outside the influence of the reflections (Vf).

RL is linked to the Ecs of the solution by the geometric constant Kc defined as

Figure 1. Measurements of the reflection coefficients of TDR traces with the waveguide immersed in solutions of in contrast to Nadler (1991), Kc was founded to be higher for low values of conductivity (Ecs <1 dS m-1 ) and lower for high values of Ecs (Ecs >3 dS m-1 ). Between 1 and 3 dS m-1, Kc was found comparable with the values indicated by the authors [Kc = 30-45]
This difficulty was overcome by adjusting a polynomial expression between the logarithm of Ecs and the total reflection coefficients observed (Figure 1).
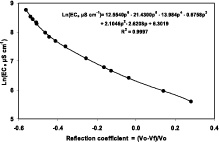
with EcS in µS cm-1 known electrical conductivity. Fitted polynomial expression used as calibration curve in this study (Eq. 4).
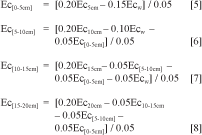
For survey purposes, measurements where spaced 2.5m apart. The waveguide, 0.2m long, was entirely driven into the soil between rice plants, in a vertical position under the water of the rice field. The conductivity for the entire length of the probe was converted introducing the reflection coefficient in equation 4. In the profiles described in Table 1, instead of a simple measurement of the entire depth of the probe, 5 measurements were performed at the same point. Firstly, measurement was performed inside the surface water, the waveguide was then driven vertically into the soil, with measurement record at depths 0.05, 0.1, 0.15, 0.2 m. Last measurement was then performed over the entire length of the probe inside the soil. When the depth of the surface water was less than 0.15m the first measurement at 0.05m was not possible. The reflection coefficients (ρtwater ρt5cm, ρt10cm, ρt15cm, ρt20cm) were calculated from the traces and computed into conductivity values using the equation 4 (Ecsw, Ec5cm, Ec10cm, Ec15cm, Ec20cm). A four layer approach was applied to compute the conductivity layer by layer assuming additive behaviour of conductivity parameter.

Results
TDR measurements of two soil layers are presented in Figure 2. Traces presented typical shapes for the depths of implantation 0.1, 0.15, 0.20 m. The transition from the cable to the rods caused a decrease of voltage. This decrease was associated with the thickness of the water layer. Sharp increases in voltage were observed because of the transition from a liquid to a saturated porous media. A time shift corresponding to the time necessary for the pulse to reach and return from contact with the water layer and the surface of the soil. Relative increases of voltage ranged from 3.8 to 12.8%. If only 0.05m of the waveguide were inserted in the soil, the influence of the transition between water and saturated soil was combined to the reflection that took place at the end of the probes and only a small effect on voltage was perceptible allthought a clear shift in time (almost 1 ns) was observed due to the permitivity effect. In the 4 profiles, the speed of reflection impulse values were between 3.9 107 ms -1 and 4.010 7 m s-1. The application of the equation of Topp et al. (1980) indicated volumetric water contents of 0.64 and 0.57 cm3cm -3 in the 0-0.2 m layer.
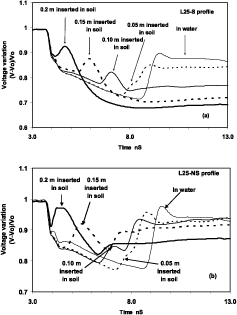
Figure 2. Traces of TDR measurements in L25-S (a) and L25-NS (b) profiles for different positions of the probe relative to the surface of the soil (totally inserted, 0.05, 0.1, 0.15 m out of the soil, inside the field water). Arrows are pointing to the effect of a resistive layer representative of the transition between water and soil
Conductivity estimates using equations from 1 to 8 are presented in Figure 3. Near the surface conductivity values of the soil were found to be in a narrow range [0.5-0.8 dS m-1]. Profiles L14-NS and L25-NS showed slight increases in conductivity with depth in the ploughed layer reaching 1 dS m-1. On the contrary, both profiles located in the saline patch (L25S and L14S) showed a strong increase in conductivity with depth since the conductivity of the 0.05-0.1 m layer reached values higher than 1.7 dS m-1.
Conductivity map of the first layer was constructed using equations 1, 2, 3 and 4 and values were interpolated and are presented in Figure 4. The result was compared to a classical salinity survey map using the same locations but developed 3 months latter. It is to note that the two maps are comparable in that they both highlight the presence of the saline patch.
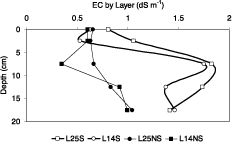
Figure 3. Estimation of the conductivity values by layer for four profiles
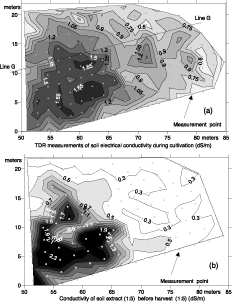
Figure 4. Survey of soil electrical conductivity measured by TDR (dS m-1) (a) compared to conductivity of 1:5 soil extracts (dSm -1) (b) using triangulation with linear interpolation. Line G traces
The shape of the traces are likely to provide suplementary information of the existence of a relatively resistant layer at the soil surface. For example, points along the line G, presented in Figure 4, had their corresponding traces depicted in Figure 5.
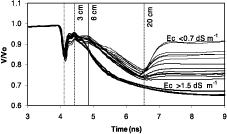
Figure 5. TDR traces along the line G, as indicated in Figure 4. (3 cm, 6 cm and 20 cm are indicating the distances along the waveguides assuming a constant permittivity, illustrating the main changes in reflection coefficient)
Two groups of traces were clairly identified.
Conclusions
Estimation of bulk conductivity by TDR of the upper surface layer of a saline sandy soil could be performed during the flooding period. The method was quicker than 1:5 soil and water extracts and was far less destructive. Unlike determination of conductivity by electromagnetism induction, the measurements achieved using TDR traces were representative only of the ploughed layer.
Inside the saline patches, the water content measurement could not be performed because of the lack of reflection at the end of the waveguides. The four profiles studied by measurements at incremental depths indicated that inside the saline patch the fresh water lens thickness was less than 0.05m. The shape of the TDR traces suggested that similar circumstances existed inside the saline patch. In contrast outside the saline patch, the low conductivity layer was thicker and the trace had distinctive characteristics. The shape of the traces could be used to identify the distribution of salinity over a given depth.
Surveys with TDR measurement of average salinity of the ploughed layer and qualitative determinations of salinity inside the few first centimeters of the flooded sandy soil has been demonstrated to be an effective method for the assessment of salinity hazard. Further developpement will require a simulation model to test the sensibility of the relation between the traces and the evolution of salinity with depth.
References
Castaglione, P. , and P. Shouse. 2003. The effect of ohmic losses on TDR measurements of electrical conductivity. Soil. Sci. Soc. Am. J. 67: 414-424.
Datlton F.N.W.W. Herkelrath, DS Rawlins, and J.D. Rhoades, 1984. TDR: Simultaneous measurements of soil water content and EC with a single probe. Science (Washington, DC) 224: 898-990.
Feng, W., and C.-P. Lin. 1999. Theoretical model of a multisection time domain reflectometry measurement system. Water Resources Research 35(8): 2321-2331.
Hammecker, C., Razzouk, R., Maeght, J.L. and O. Grunberger, 2005. Water infiltration in saline sandy soils. Tropical sandy soils. Proceedings, Khon Kaen, Thailand. November 2005, in press.
Lin, C.-P. 2003a. Analysis of nonuniform and dispersive time domain reflectometry measurement systems with application to the dielectric spectroscopy of soils. Water Resources Research 39(1): 1012.
Lin, C.-P. 2003b. Frequency domain versus travel time analysis of TDR Waveforms for soil moisture measurements. Soil. Sci. Soc. Am. J. 67: 720-729.
Nadler, A., S. Dasberg, and I. Lapid. 1991. Time domain reflectometry measurements of water content and electrical conductivity of layered soil columns. Soil. Sci. Soc. Am. J. 55: 938-943.
Oswald, B., W. Bachtold, H. Fluhler, and H. Benedickter. 2003. Spatially resolved water content profiles from inverted time domain reflectometry signals. Water Resources Research 39(12): 1357.
Quantin, C., Grunberger, O., Suvannang, N., Bourdon, E. 2005. Impact of agricultural practices on the biogeochemical functionning of salt-affected paddy fields, Proceedings: Tropical sandy soils, Khon Kaen, Thailand. November 2005, on press.
Saejiew, A., Grunberger, O., Arunin, S., Favre, F., Tessier, D., and P. , Boivin, 2004, Critical coagulation concentration of paddy soil clays in sodium – ferrous iron electrolyte. Soil Sci. Soc. Am. J. 68: 789-794.
Schaap, M., D.A. Robinson, M. Friedman, and A. Lazar. 2003. Measurement and modeling of the dielectric permittivity of layered granular media using time domain reflectometry. Soil. Sci. Soc. Am. J. 67: 1113-1121.
Todoroff, P., and J.-D. Sun Luk. 2001. Calculation of in situ soil water content profiles from TDR signal traces. Institute of Physics Publishing, Measurement Science and Technology 2: 27-36.
Topp, G., J. Davis, and A. Annan. 1980. Electromagnetic determination of soil water content: Measurements in coaxial transmission lines. Water Resources Research 16(3): 574-582.
Topp, G.C., J.L. Davis, and A.P. Annan. 1982. Electromagnetic determination of soil water content using TDR: II. Evaluation of installation and configuration of parallel transmission lines. Soil Sci. Soc. Am. J. 46: 678-684.
Zeng L. and Shannon M.C., 2000. Salinity effects on seedling growth and Yield components of rice. Crop Sci. 40: 996-1003.
1 Institut de Recherche pour le Développement (IRD), Office of Science for Land Development,
Phaholyothin Road, Chatuchak, Bangkok 10900, Thailand, olivier.grunberger@ ird.fr