![]()
![]()
![]()
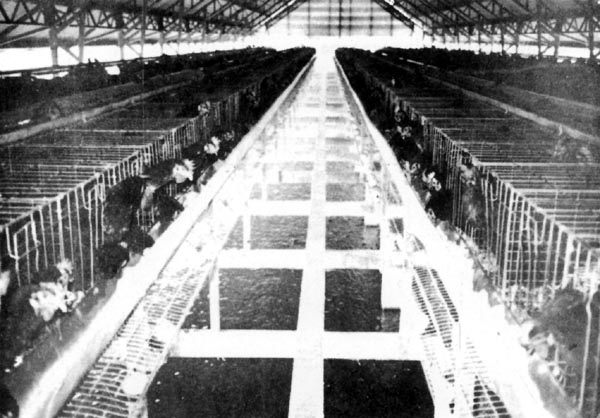
The integration of fish-cum-livestock farming such as pig/fish and duck/fish had also been demonstrated. Fish farming with pig raising increases farm income. Studies conducted both on backyard and commercial operations showed annual rates of return on investment from 43 percent to 54 percent in the case of backyard operations and from 19 percent to 42 percent in commercial scale.
The backyard type consists of 6–10 pigs in a 1 000 m2 pond and 1.0 ha for the commercial operations with 60–80 pigs. Capital costs are shown in Table 8.
Table 8. Capital costs of pig-fish farming1
| Commercial growing | Backyard | Small breeding and growing | ||
| Piggery | ||||
| Buildings per pen | 53 000 | 2 000 | 80 000 | |
| Tools and equipment | 1 000 | 32 | 1 600 | |
| Water system | 7 000 | 250 | 12 000 | |
| Other fixtures | 1 000 | - | 1 400 | |
| Total | 62 000 | 2 282 | 95 000 | |
| Fishpond | ||||
| Pond construction at | ||||
 10.50/m3 10.50/m3 | 38 360 | 2 756 | 43 071 | |
| Water system | 2 750 | 1 322 | 2 750 | |
| Nets at 26/m | 2 772 | 975 | 3 120 | |
| Buckets at 35 each | 3 920 | 350 | 3 850 | |
| Total | 47 802 | 5 403 | 52 791 | |
The operating costs and returns of integrated pig-fish farming operations are as follows1:
| Commercial growinga | Backgroundb | Small breeding and growing | |||
| Piggeryc | |||||
| Costs | |||||
| Stock/weanlings | 27 200 | 1 578 | 12 000 | ||
| Feeds | 68 551 | 2 405 | 71 899 | ||
| Labour | 3 600 | - | 4 896 | ||
| Drugs and medicine | 600 | 12 | 2 280 | ||
| Fuel | - | - | 1 603 | ||
| Repairs and depreciationd | 4 000 | 231 | 6 000 | ||
| Electricity | - | - | 3 900 | ||
| Taxes and licences | - | - | 11 136 | ||
| Freight | 1 386 | - | - | ||
| Total costs | 105 537 | 4 226 | 113 714 | ||
| Returns | |||||
| Pig sales | 88 200 | 6 050 | 116 894 | ||
| Sale of empty feed bags | 1 188 | - | 7 140 | ||
| Sale of manure | - | - | 2 400 | ||
| Total returns | 89 388 | 6 050 | 126 434 | ||
| Net income | (16 149) | 824 | 12 720 | ||
| Rate of return on investment (ROI) (% per year)e | - | 43.2 | 19.5 | ||
| Fishpondf | |||||
| Costs | |||||
| Fingerlings at 90.05 each | 6 000 | 720 | 7 800 | ||
| Irrigation fee at 390/ha/year | 260 | 39 | 338 | ||
| Land rent at 1 950/ha/year | 1 300 | 195 | 1 690 | ||
| Labour at 15/man/day | 555 | - | 675 | ||
| Manureg | - | _ | 2 400 | ||
| Poison at lO.50/ha/application | 21 | 3 | 27 | ||
| Pond maintenance and depreciation | 4 483 | 417 | 3 956 | ||
| Total costs | 12 619 | 1 374 | 16 886 | ||
| Returns | |||||
| Fish sales: | |||||
| Tilapia at 9.00/kg | 26 820 | 3 735 | 41 436 | ||
| Carp at 5.00/kg | 3 000 | 255 | 4 500 | ||
| Total returns | 29 820 | 3 990 | 45 936 | ||
| Net income | 17 201 | 2 616 | 29 050 | ||
| Rate of return on investment (ROI) | 54 | 57.6 | 82.5 | ||
| Integrated | |||||
| Total capital investment | 109 802 | 7 685 | 147 791 | ||
| Total costs | 118 156 | 5 600 | 130 600 | ||
| Total returnsg | 119 208 | 9 040 | 172 370 | ||
| Net income | 1 052 | 3 440 | 41 770 | ||
| Rate of return on investment (ROI) (% per year) | 1 | 54 | 42 | ||
a Assumes an 8-month production cycle.
b Assumes a 10-month production cycle.
e Backyard: ROI/period × 1.2; other ROI/period × 1.5.
f Based on Hopkins et al. (in press).
g Opportunity cost of manure (income foregone), for small breeding and growing operation only.
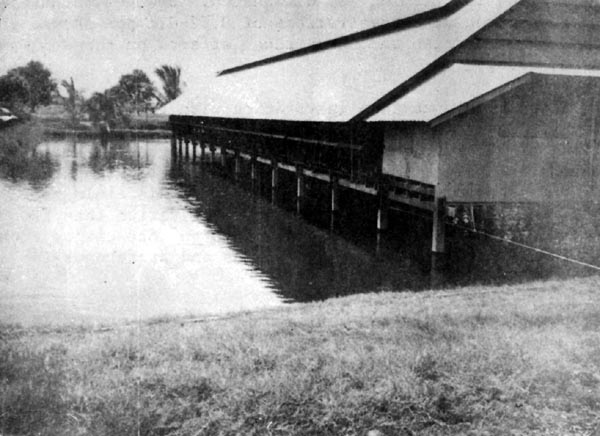
Integrated fish-livestock farming
![]()
![]()
![]()