The main purpose of intensification of farming management techniques is to increase productivity and obtain high pro-fit. This has been the direction of shrimp farmers worldwide particularly the large business enterprises. Penaeus monodon produced locally are mostly exported. It would be advantageous if production is geared both for domestic and export markets.
5.1.1 International market
There are only three major international markets for shrimps. These are Japan, the United States and Western Europe (Table 11). The main supply comes from 30 countries of which Thailand, Indonesia, Malaysia, Philippines, Vietnam and Singapore are Southeast ASEAN countries (Table 12).
The major export market of the Philippines is Japan, followed by the United States (Table 13). The same market is shared by Thailand, Indonesia and other developing countries in the ASEAN region. A decline in the quality and price competitiveness of Philippine shrimp lead to the collapse of intensive farming operations. There has been already a slump in the Japanese market which brought the price of shrimp down. The intensive operations found it difficult to make their system economical.
The international market for shrimps produced in the ASEAN countries, particularly the Philippines, is mainly Japan. Promotion of shrimp export to the United States, Canada and Europe is being made. However, in the United States, the government is now giving emphasis to aquaculture development as it realized that a great percentage of their budget is eaten up by increasing imports of seafoods. In response to this problem, the United States government recently established six regional aquaculture research centers in different regions of the continent. The Center for Tropical and Sub-tropical Aquaculture is based in Hawaii. These aquaculture centers bring together members of the private industry, the scientific community and the extension agents to address the concerns of aquaculture through research and educational extension (Aquaculture, 1989).
Table 11. Imports of shrimps and prawns by 15 major importing countries (1986)
| Importing country/area | Q | V | % of total V | ||
| 1. | Japan | 213 842 | 1 835 690 | 42.5 | |
| 2. | USA | 160 521 | 1 301 405 | 30.1 | |
| 3. | Denmark | 42 587 | 136 183 | 3.2 | |
| 4. | Hong Kong | 40 938 | 194 595 | 4.5 | |
| 5. | France | 30 923 | 175 119 | 4.1 | |
| 6. | United Kingdom | 24 682 | 128 243 | 2.9 | |
| 7. | Singapore | 19 623 | 51 416 | 1.2 | |
| 8. | Spain | 19 530 | 119 163 | 2.8 | |
| 9. | Italy | 17 607 | 117 591 | 2.7 | |
| 10. | Canada | 13 500 | 116 650 | 2.7 | |
| 11. | Malaysia | 12 797 | 6 575 | 0.15 | |
| 12. | Norway | 11 409 | 29 228 | 0.68 | |
| 13. | Sweden | 9 219 | 34 951 | 0.81 | |
| 14. | Netherlands | 8 135 | 30 070 | 0.70 | |
| 15. | Belgium | 7 029 | 42 913 | 1.0 | |
| Total | 632 342 | 4 319 792 | 100.00 |
Source: FAO Yearbook 1986
Table 12. Exports of shrimps and prawns by 30 major producing countries (1986)
| Origin | Q | % of Q | V | % of total V |
| China | 49 341 | 9.33 | 351 582 | 11.25 |
| India | 49 203 | 9.31 | 299 665 | 9.59 |
| Denmark | 40 336 | 7.63 | 150 064 | 4.80 |
| Indonesia | 35 963 | 6.80 | 284 239 | 9.09 |
| Greenland | 33 133 | 6.27 | 110 278 | 3.53 |
| Hong Kong | 31 253 | 5.91 | 229 882 | 7.35 |
| Ecuador | 30 683 | 5.81 | 284 734 | 9.11 |
| Thailand | 28 717 | 5.43 | 167 023 | 5.34 |
| Malaysia | 25 366 | 4.80 | 48 382 | , 1.55 |
| Vietnam | 19 091 | 3.62 | 72 550 | 2.32 |
| Bangladesh | 17 066 | 3.21 | 97 000 | 3.10 |
| Pakistan | 14 060 | 2.67 | 74 000 | 2.37 |
| Australia | 13 015 | 2.50 | 137 660 | 4.40 |
| Iceland | 12 389 | 2.34 | 88 360 | 2.83 |
| United Kingdom | 12 315 | 2.33 | 66 034 | 2.11 |
| Brazil | 12 285 | 2.30 | 90 107 | 2.88 |
| Argentina | 11 300 f | 2.14 | 49 500 f | 1.58 |
| Philippines | 11 211 | 2.12 | 103 828 | 3.32 |
| Singapore | 10 472 | 1.98 | 43 058 | 1.38 |
| Panama | 9 336 f | 1.77 | 74 000 f | 2.37 |
| USA | 9 091 | 1.72 | 69 119 | 2.21 |
| Faeroe Island | 8 173 | 1.55 | 20 348 | 0.65 |
| Netherlands | 7 852 | 1.49 | 27 113 | 0.87 |
| Senegal | 6 874 | 1.31 | 67 560 | 2.16 |
| France | 5 472 | 1.04 | 48 944 | 1.57 |
| Norway | 5 159 | 0.98 | 23 672 | 0.76 |
| Canada | 5 001 | 0.95 | 25 791 | 0.83 |
| Guyana | 4 980 | 0.94 | 5 000 | 0.16 |
| Macau | 4 931 | 0.93 | 5 390 | 0.17 |
| Germany, F:R. | 4 331 | 0.82 | 10 965 | 0.35 |
| Total | 528 399 | 100.00 | 3 125 828 | 100.00 |
Source: FAO Yearbook 1986
Table 13. Philippine export of shrimps and prawns (fresh/chilled/frozen) by country of destination, 1983–1987
| Country | 1983 | 1984 | 1985 | 1986 | 1987 | |||||
| Quantity | Value | Quantity | Value | Quantity | Value | Quantity | Value | Quantity | Value | |
| (mt) | (  ) ) | (mt) | (  ) ) | (mt) | (  ) ) | (mt) | (  ) ) | (mt) | (  ) ) | |
| Australia | 10 | 713 | 89 | 9 965 | 109 | 12064 | 81 | 12391 | 159 | 28146 |
| Canada | - | - | 1 | 126 | 40 | 3771 | 28 | 3926 | 70 | 8870 |
| England | * | 1 | * | 2 | 5 | 539 | 45 | 9691 | 9 | 1222 |
| Germany,F.R. | 3 | 56 | * | ** | - | - | 37 | 8158 | 19 | 4957 |
| Guam | 51 | 4749 | 65 | 5009 | 150 | 17873 | 101 | 14594 | 122 | 22104 |
| Hong Kong | 13 | 489 | 12 | 3828 | 56 | 3989 | 35 | 1991 | 58 | 5632 |
| Japan | 3955 | 295958 | 4482 | 401575 | 5917 | 811311 | 8686 | 1640435 | 121162 | 562654 |
| Saipan | 1 | 48 | * | 10 | - | - | - | - | - | - |
| Saudi Arabia | * | 29 | * | ** | - | - | - | - | - | - |
| Singapore | 15 | 758 | 17 | 1628 | 4 | 506 | 16 | 2257 | 12 | 1487 |
| Sweden | * | 12 | - | - | - | - | - | - | - | - |
| USA | 524 | 34412 | 1563 | 110692 | 1759 | 298346 | 1854 | 351695 | 2074 | 459314 |
| Arabian Peninsula State | - | - | - | - | 12 | 1682 | 13 | 2140 | - | - |
| Malaya Federal of | - | - | - | - | 14 | 867 | - | - | - | |
| Taiwan | - | - | - | - | 2 | 523 | 21 | 2359 | 20 | |
| Trust Territory of | ||||||||||
| Pacific Islands | - | - | - | - | 1 | 143 | 1 | 59 | 4 | 160 |
| Hawaii | - | - | - | - | 26 | 5 129 | 235 | 49 264 | 234 | 53776 |
| Nauru | - | - | - | - | * | 30 | - | |||
| Netherlands | - | - | - | - | 9 | 1585 | 23 | 2779 | - | |
| France | - | - | - | - | - | - | 10 | 1372 | 26 | 4188 |
| Italy | - | - | - | - | - | - | 7 | 1440 | 19 | 3347 |
| Thailand | - | - | - | - | - | - | 8 | 1228 | ||
| Okinawa | - | - | - | - | - | - | * | 2 | 0 | 1893 |
| Cyprus | - | - | - | - | - | - | - | - | 5 | 373 |
| New Zealand | - | - | - | - | - | - | - | - | - | 1 |
| Total | 4572 | 337225 | 6229 | 532835 | 8104 | 1158358 | 11210 | 2105781 | 149363 | 3158 143 |
*Less than one metric ton
**Less than  1 000
1 000
Source: BFAR Fisheries Statistics
Shrimps constitute 72 percent of imported seafood consumption in the United States in 1988. The government, therefore, felt the compelling need to produce shrimps domestically. The only way the United States could produce shrimps would be to use intensive systems to compete in the global market. This goal could easily be met as the country has a well-organized research programme and their scientific institutions are well-funded. The Oceanic Institute alone which is based in Hawaii has a U$15 million Center for Applied Aquaculture Research (O.I., 1989).
Recent intensive shrimp farming trials conducted have shown that there was no reduction in growth rates as the stocking density increased from 45–100 shrimp/m2. Yields increased directly with stocking density. Yields of 5 mt/ha/crop has already been achieved in private shrimp farm operations while research results showed the equivalent of 12 mt/ha. It was projected that it would be possible to harvest 10–20 mt/ha/crop as a routine practice in United States shrimp farms in the next decade (San-difer, et al., 1988). With this scenario in the United States shrimp farming outlook, it would not be very optimistic to rely on this market in the medium term future. Diversification of shrimp species for the local market would be beneficial in the long run since the local demand for shrimp is still high.
It has been pointed out in the Shrimp '88 Conference held in Bangkok, that the shrimp farming industry is approaching its peak of growth considering the fast rate of expansion. Just like any commodity in trade, the industry will follow a typical growth curve starting with development then undergoes a growth period or take-off stage; reaches maturity and then decline (Csavas; 1988). This is illustrated in Figure 13. This prediction happened sooner than expected.
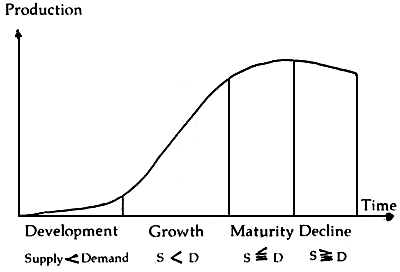
Figure 13. Growth curve of production (after Ohtsu, 1985)
Source: Csavas, 1988
It is very apparent that most developing countries are gearing towards expansion of shrimp farming. Developed countries, which are the international market outlets of Asian shrimps are also intensifying their shrimp farming development programmes, particularly the United States to reduce their imports of seafoods. With the world supply of shrimps burgeoning to high levels, it is expected that adverse economic factors will affect the shrimp farming industry in the near future. International market demand is increasing at only 5–10 percent per year or an average of 7.5 percent. On the other hand, farmed shrimp production is increasing at the rate of 48 percent from the Western hemisphere shrimp producing countries and 32 percent from the Eastern hemisphere. These sources combined have a total production of 260 000 mt (1985). At the turn of the decade 1990 the gap of supply and demand would have been met (Rabanal, 1988). As such, there will be excess supply from thereon and prices will begin to drop. Highly intensive operations will not be able to compete due to high costs of production. Provision for diversification of product and finding new markets for new products would be advantageous. Government aquaculture research institutions must initiate studies towards this direction to provide the intensive farming operations to have alternatives for the full use of their production capacities.
Even before this paper was out, the intensive shrimp farming operators were struck by low prices of P. monodon in Japan, the principal export marketing shrimps from ASEAN. Export of shrimps slumped drastically in the ASEAN countries particularly in the Philippines. Other markets besides Japan are being considered but this would probably take a while to pick up in the same magnitude enjoyed from the Japanese market. It is inevitable that the intensive shrimp farms of about 1 143 ha (IAC, 1989) in the Philippines would have to restructure their loans or diversify their aquaculture operations to avoid more losses from their investments.
It is quite obvious that the semi-intensive and extensive shrimp farming systems will prevail over the intensive and super-intensive operations when the international demand declines. They could perhaps remain in business if their selling price is good enough to compensate for high production costs. Studies have shown that profits in intensive culture would be diminished with a small reduction in selling price while the semi-intensive operations could remain profitable by slightly increasing the level of productivity (Figure 14).
Intensive farms are highly capital intensive; they are also disease-prone. A comparison of economic returns of different shrimp management systems showed that intensive shrimp farming operations do not fare well when the price of shrimp in the export market fluctuates.
Comparative economic analysis: prawn (P. monodon) culture (Posadas, B., 1987)
| Traditional | Extensive | Semi-intensive | Intensive | |||
| A. | Assumptions | |||||
| Farm size | 7 ha | 7 ha | 7 ha | 7 ha | ||
| Stocking rate | l/m2 | 3/m2 | 10/m2 | 30/m2 | ||
| Survival | 70% | 70% | 70% | 70% | ||
| Average body weight | 40 g | 38 g | 35 gm | 30 gm | ||
| Crops/yr | 2 | 2 | 2.5 | 2.5 | ||
| Production/crop | 280 kg | 798 kg | 2.45 tons | 6.3 tons | ||
| Materials/ha/crop | ||||||
| Fertilizer, organic | 1 ton | 1 ton | 1 ton | 1 ton | ||
| inorganic | 200 kg | 200 kg | - | - | ||
| Lime | - | 1 ton | 2 tons | 4 tons | ||
| Tea seed cake | - | - | 200 kg | 400 kg | ||
| Power (kwh) | 1 000 | 3 000 | ||||
| Labor (man-days) | 60 | 120 | 240 | 480 | ||
| FCR | 0.67 | 1.2 | 1.6 | 1.6 | ||
| Development cost/ha |  120 000 120 000 |  150 000 150 000 |  200 000 200 000 |  500 000 500 000 | ||
| Initial investment/ha |  132 000 132 000 |  200 000 200 000 |  428 000 428 000 |  1 145 000 1 145 000 | ||
| B. | Economic indicators * | |||||
| Payback period (yr) | 4.6 | 2.7 | 1.7 | 1.95 | ||
| Average rate of return (%) | 13 | 30 | 56 | 47 | ||
| Net present value | ||||||
 150/kg, static 150/kg, static | (86). | 264 | 2 340 | 4 281 | ||
 l40/kg ± 7% l40/kg ± 7% | (246) | 181 | 1 681 | 2 585 | ||
 l40/kg ± 20% l40/kg ± 20% | (376) | 272 | 292 | (985) | ||
| Initial rate of return (%) | ||||||
 l50/kg, static l50/kg, static | 9 | 30 * | 57 * | 46 * | ||
 140/kg ± 7% 140/kg ± 7% | 5 | 23 * | 47 * | 36 * | ||
 140/kg ± 20% 140/kg ± 20% | 3 | 9 | 25 * | 13 | ||
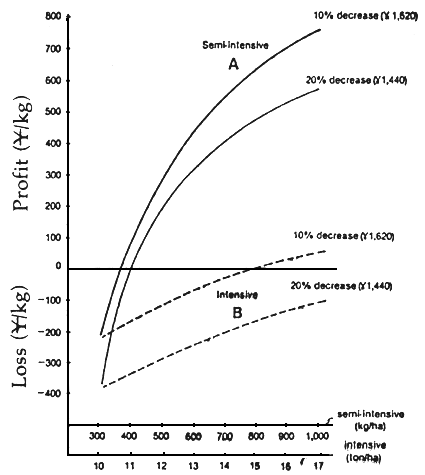
Figure 14. Profit and loss per kilogram given a decrease (by 10 and 20 percent of present levels) in selling price
Source: Hirasawa, 1985
5.1.2 Domestic market
While the Asian countries produce the bulk of shrimps in the world market, the domestic consumption could be astonishingly low if one considers per caput production shown below:
| Country | Per capita production(kg) |
| Brunei | 2.306 |
| Burma | 0.019 |
| Cambodia | 0.041 |
| Indonesia | 0.694 |
| Malaysia | 4.442 |
| Philippines | 1.348 |
| Singapore | 0.752 |
| Thailand | 3.123 |
| Vietnam | 0.928 |
Source: Rabanal, 1988
Per capita shrimp consumption of importing countries such as Japan is 1.735 kg while the United States is 0.9 kg. From these information consumption at domestic levels could still increase significantly particularly with corresponding increase in population. There is, therefore, a large domestic market which the producers should consider. The intensive farming sector should, however, be able to decrease their selling price to become competitive in the local markets. They have to reduce their cost of production to be competitive with the semi-intensive farming operations.
Although intensive farming production techniques are being adopted in most developing countries, 83 percent of the total shrimp production is still obtained from extensive and semi-intensive farming systems. The average level of shrimp culture production in Asian countries is 284 kg/ha (Table 14).
Table 14. Average crustacean yield in Asia (1985)
| Country | Average yield(kg/ha) |
| Bangladesh | 108 |
| Burma | 173 |
| China, P.R. of | 714 |
| India | 395 |
| Indonesia | 162 |
| Malaysia | 553 |
| Philippines | 149 |
| Singapore | 1 476 |
| Thailand | 450 |
| Vietnam | 260 |
Average of “extensive” and “semi-intensive” countries | 240 |
| Japan | 6 145 |
| Taiwan, R.O.C. | 7 750 |
Average of “intensive” countries | 7 620 |
| Asian average | 284 |
Source: Csavas, 1988
In the event of falling international market demand the possibility of increasing the levels of shrimp production would come from extensive and semi-intensive farming areas rather than the intensive farming operations due to lesser costs involved.
Extensive farming systems may not be able to increase production to high levels due to dependence on natural productivity. However, improvement in management techniques such as predator control, selective harvesting and stocking and frequent water change could increase production.
Since shrimp juveniles are available year round, selective or multiple harvesting and stocking is possible. Replacement of large shrimps harvested from the ponds with smaller sized shrimps from nurseries results to maximum use of production facility and at the same time increasing the level of production.
The pond system called the modular system as practiced in the Philippines for milkfish is also applicable to shrimp farming. The pond system consists of the nursery ponds, intermediate or transition ponds and grow-out ponds (Figure 15a); the multiple stock harvest system (Figure 15b).
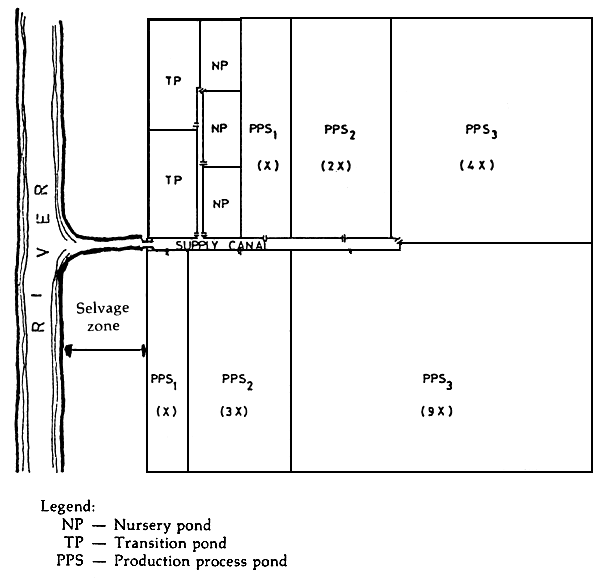
Figure 15a. Example of a modular pond system
(Source: dela Cruz, C.R., 1983)
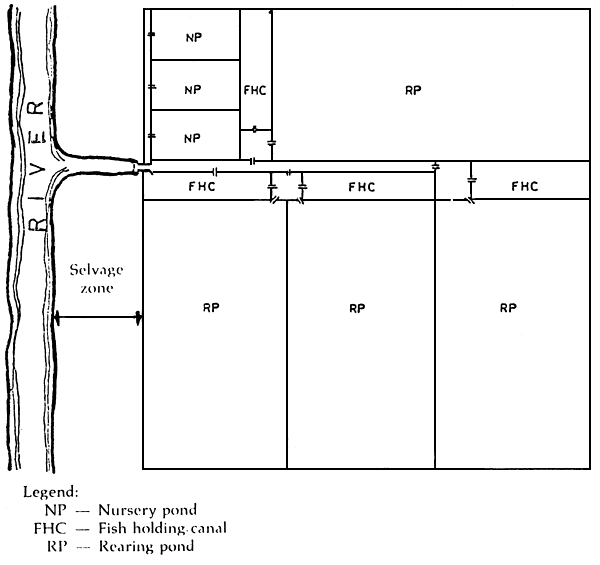
Figure 15b. Example of a multiple stock harvest pond system
(Source: dela Cruz, C.R., 1983)
In Taiwan, farmers stock seedlings after finishing a previous harvest thereby fully utilizing the pond capacity while the shrimps are small (Figure 16). Under this system, 2.5 to 3 crops of shrimp is attainable annually.
Another semi-intensive system is the circulating pond use (Figure 17). Ponds may be divided into several sections of different sizes and stock small shrimps in the small units first. When they have grown to some extent, they are shifted to the next larger sections. After each movement of a batch of shrimps, the pond is cleaned and restocked with another batch repeating the same process. Within a period of three months every pond unit is filled with different sizes of shrimps. Under tropical weather conditions, it is possible to harvest 5–6 times a year.
5.3.1 White shrimp
In the ASEAN region, the white shrimp is abundant and wild seeds are available in large quantities. As a matter of fact wild shrimp seeds that enter brackishwater ponds are composed mainly of the white shrimp, P. merguiensis or locally called hipon puti in the Philippines.
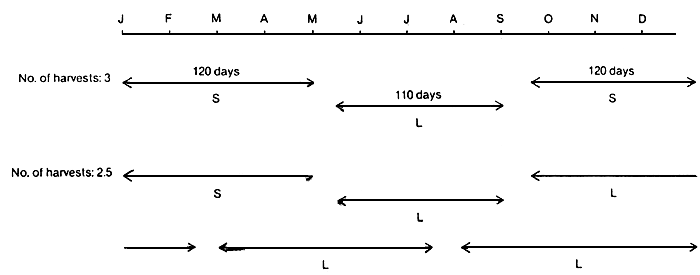
Figure 16. Schedule of pond use by month in the Tungkang area, Taiwan Size of shrimp: S - small (32–35 g); L - large (35–40 g)
Source: Hirasawa, 1985
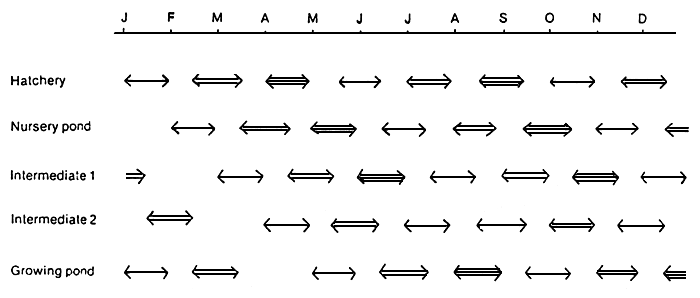
Figure 17. A model of circulating pond use. Individual stocking or crop (as identified by number of horizontal lines) may be followed through the various production phases
Source: Hirasawa, 1985
In Japan, imported P. monodon is mainly used in out-of-home consumption market where it is a substitute for the large white shrimp due to its lower price. The medium size white shrimp is preferred for homo consumption due to its white meat color and cheaper than the large white shrimp. The price of white shrimp in Japan has always been higher than the tiger shrimp (Figure 18).
For culture purposes, beginning at PL10–PL15, the growth rate of the white shrimp was found faster than the tiger shrimp within a 7-day rearing period. Beyond this, it does not pay to continue rearing as the growth rate declines (Figure 19). This means that one rearing cycle of the white shrimp takes only 70 days, thus making 3.4 crops of white shrimp in 240 days (Liao, 1987).
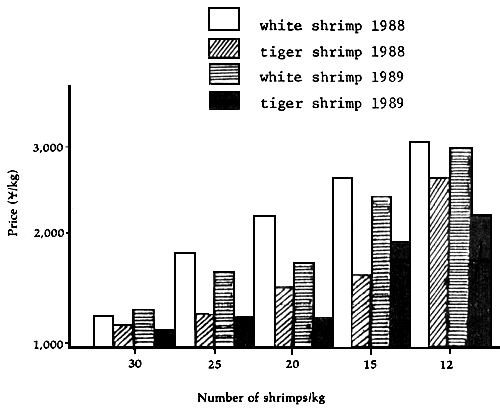
Figure 18. Wholesale prices of shrimps in Japanese market
Source: INFOFISH TRADE, December 1988 and June 1989
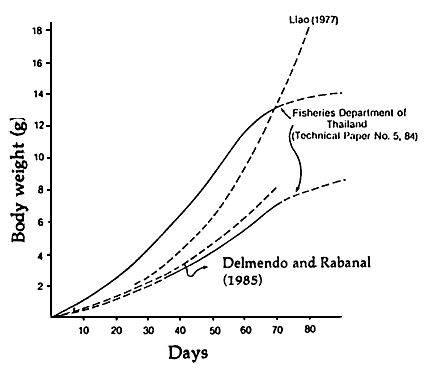
Figure 19. Growth rate of black tiger shrimp,
Penaeus monodon (....) and white
shrimp, P. merguiensis (—)
Source: Hirasawa, 1985
In Thailand, extensive shrimp farming is centered on white shrimp. An economic sampling of white shrimp farming showed a rate of return ranging from 39.5 to 59.8 percent (Table 15). Shrimp fry are abundant in tidal areas which Thai farmers pump into their ponds.
White shrimps lay eggs and spawn in ponds naturally. In the Philippines, only about 10 percent of shrimp seeds collected from the wild consists of tiger shrimp and the rest is made up mainly of the white shrimp species.
It would perhaps be beneficial to grow P. monodon during the wet period of the year when salinity is lower and white shrimp during summer when salinity levels are generally high. This would reduce the cost of pumping freshwater to reduce salinity in the ponds. Massive extraction of underground water for salinity control in intensive ponds could be avoided while at the same time produce a higher quality shrimp species. The fry of white shrimp is relatively easier to collect from the wild.
Table 15. Economic status of white shrimp culture in Thailand (1984)
| Area(ha) | |||||
| 0.8–4.6 | 4.8–9.4 | 9.6–15.8 | 16 | ||
| 1 | Productivity (kg/ha) | 532 | 506 | 472 | 454 |
| 2 | Producer price ( | 648 | 670 | 620 | 765 |
| 3 | Production cost( | 297 | 269 | 375 | 365 |
| 4 | Net profit ( | 351 | 401 | 245 | 400 |
| 5 | Return rate (%) * | 54.2 | 59.8 | 39.5 | 52.3 |
| 6 | Total net profit ( | 187 | 203 | 116 | 182 |
| Number of samples | 11 | 10 | 6 | 7 | |
Source: Thailand Agriculture and Cooperative Ministry, Technical Report No. 1, 1984.
Source: Hirasawa, 1985
5.3.2 Green tiger shrimp
Another species of shrimp with potential for culture is the P. semisulcatus called locally as bulik in the Philippines.
Studies conducted in Taiwan showed that rearing of this species at an initial weight of 0.16 g attained 33.69 g at a stock density of 20/m2 for a period of 315 days. The survival rate was 83.0 percent (Liao, 1987).
Penaeus semisulcatus is widely distributed. and its fry are caught widely in nature in sufficient quantities. It tolerates high salinity and low temperatures. The only constraint is the long rearing period to attain marketable size. It may be possible that at lower stock density, the size at marketable stage may be larger but whether this could be attained within shorter rearing period is something which needs further study.
5.3.3 Penaeus brasiliensis
Penaeus brasiliensis is an introduced species in Taiwan from Brazil. It attains a size of 40 g in one year. The future of this species has to be investigated also like the P. semi-sulcatus.
5.3.4 Penaeus penicillatus
This species is reported to be one of white shrimp species preferred in Europe and the United States. It tolerates low temperature and has a low protein level requirement of feed of 22 percent. Liao (1987) reported that it can be stocked at densities of 100–120/m2. The growth rate is also quite rapid during its early life stages. Figure 20 shows that P. penicillatus attains over 30 g in 120 days.
Of the three species, P. penicillatus is already being produced by Taiwanese farmers. In 1986, 2 000 mt was also produced and prospects for future export of the species is quite optimistic. Liao (1988) reported that P. penicillatus is resistant to low temperature; shows good possibilities for rearing in seawater; spawners are abundant; spawning by natural or induced method relatively easier than P. monodon; larvae has good survival and subsist in natural food in the ponds; low protein requirement and has good growth even at high densities of 100–120/m2; it grows to uniform size.
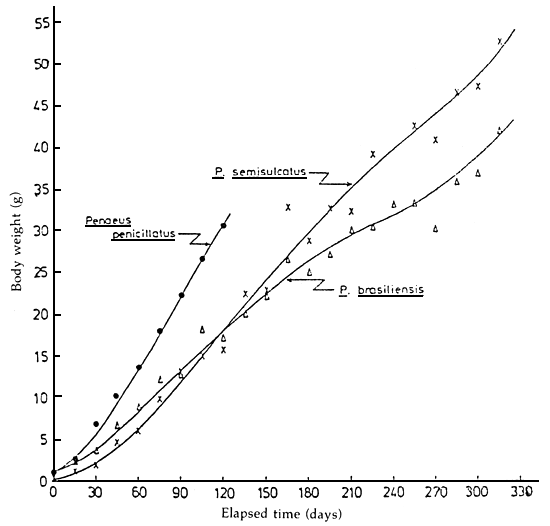
Figure 20. Growth curves comparing maximum growth attained
by individuals of Penaeus semisulcatus, P. brasiliensis and P. penicillatus
Source: Liao, I.C. Contribution No. 74, 18th Annual Meeting of the WAS, Guayaquil, Ecuador, 1987