![]()
![]()
![]()
A total number of 492 farmers were surveyed in the 13 areas. This survey proved to be less helpful than hoped. The extension officers who conducted the survey were well trained in the technical aspects of fish farming, but had not been trained to conduct surveys or in data collection. It is relatively easy to collect information on the sizes and numbers of fish ponds, but more difficult to collect information on the actual management practices. There is often a big difference between what the farmer says he does and what actually takes place, and it soon became clear that much of the data collected during the initial survey was misleading. For example, many farmers answered questions about feeding their fish by saying that they fed 2.4 kg per pond per day of maize bran. The same farmer later said that the major constraint to increased production was the lack of feed; many said it was unavailable. The two statements are contradictory. Many of the responses appeared to be influenced by the surveyor, The person doing the survey was also the person who had been previously responsible for the extension work in the area, and there was perhaps a tendency to make things appear in a more favorable light than was actually the case. It was also obvious that there was a considerable amount of technical embellishment during the survey. For example, when asked about putting manure in the pond, a farmer would respond that yes, he adds manure. How much? The farmer shrugs his shoulders. The interviewer then writes down 30 kg per week.
The most obvious shortfall of the initial survey was the effort of determining the farmers' own conception of his constraints. It was immediately clear that the constraints and problems identified in the survey were almost entirely made by the interviewer. Furthermore each interviewer had his own personal subjective interpretation of what these major constraints might be. The reported problems varied considerably, anywhere from “lack of technological knowledge poor site selection”, to “no outlet for the pond”. The information gathered on the farmers' perception of his own problems was of little value and this information is not included in this report.
The survey did give some background information on the general status of fish farming in each area, but it was not possible to identify highly specific topics for field days in each selected area. The general consensus among the persons doing the initial survey was that the knowledge base of the rural farmers was sporadic at best and much of the course material for the field days was then of a more general nature with the same basic topics given in ail areas.
Finally when the series of field days began, there were significant!)/ more practicing fish farmers attending the field days than were initially surveyed, although this varied from area to area. Many of these farmers were located within the 15 km radius but were previously unknown by the extension officers. This is a demonstration of the multiplier effect with new farmers learning from old ones most of these new farmers had begun fish farming in only the past 1 year. This also shows the limits of the training and visit approach to extension. The results of the initial survey are summarized in Table 1 on the following page
In almost all areas, there were more practicing fish farmers attending the field days than had been included in the initial survey. In the course of the field days, other farmers began constructing fish ponds for the first time. Table II gives the attendance records for each survey area and the number of unknown or new farmers in those areas.
There were a total of 140 field days held in all the 13 areas. Attendance varied considerably from area to area. The total number of possible field days that could be attended in each area was 10 or 11 (with the exception of Kipkelion where only 5 were held).
For the purposes of the survey, it was considered that an attendance of 3 field clays would be necessary to judge if the field day approach had any impact or not. This gives a minimum attendance of 25% to 35%. Table III presents the attendance data in terns of the number of farmers attending 0. 1, 2. or 3 and more field days during the test period.
| Survey area. | Number of Farmers | Average years of experience | Number of ponds | Total pond area m2 | Avg pond size m2 | Polyculture with Clarias number of ponds |
| Bongore | 15 | 0.9 | 15 | 2 580 | 184 | no data |
| Funyula | 28 | 5.5 | 59 | 15 262 | 262 | 45 or 76% |
| Kimilili | 26 | 5,1 | 64 | 15 087 | 235 | 10 or 16% |
| Kipkelion | 15 | 4,2 | 20 | 6 019 | 300 | 4 or 27% |
| Suneka | 52 | 7.5 | 78 | 13 455 | 172 | no data |
| Koibarak | 29 | 1.5 | 29 | 12 220 | 420 | 2 or 7% |
| Kuria | 40 | 4,2 | 58 | 10 324 | 178 | no data |
| Lurambi | 26 | 3,9 | 40 | 11 256 | 281 | 24 or 92% |
| Migori | 59 | 5,5 | 181 | 43 384 | 240 | no data |
| Rangwe | 63 | 4.5 | 87 | 29 758 | 342 | no data |
| Rigoma | 86 | 5,6 | 152 | 31 022 | 204 | no data |
| Sondu | 23 | 0.5 | 47 | 10 046 | 213 | 6 or 26% |
| Yala | 30 | 11.7 | 61 | 12415 | 203 | 20 or 67% |
| Totals: | 492 | 891 | 21,3 ha |
Table II
Summary of Field Day attendance during the 4 month study period
| Survey area | Number of Farmers (initial survey) | Number of unknown/new farmers attending | Total farmers attend in area | Average attendance per day | percent (total farmers) | Total farmer days |
| Bongore | 15 | 31 | 46 | 13 | 28% | 134 |
| Funyula | 28 | 20 | 58 | 23 | 40% | 275 |
| Kimilili | 26 | 26 | 52 | 24 | 46% | 241 |
| Kipkelion | 15 | 0 | 15 | 7 | 46% | 37* |
| Suneka | 52 | 0 | 52 | 10 | 19% | 88 |
| Koibarak | 29 | 35 | 64 | 11 | 17% | 116 |
| Kuria | 40 | 11 | 51 | 11 | 21% | 100 |
| Lurambi | 26 | 31 | 57 | 22 | 38% | 242 |
| Migori | 59 | 9 | 68 | 10 | 15% | 89 |
| Rangwe | 63 | 2 | 65 | 14 | 22% | 136 |
| Rigoma | 86 | 2 | 89 | 14 | 16% | 137 |
| Sondu | 23 | 0 | 23 | 15 | 65% | 150 |
| Yala | 30 | 18 | 48 | 19 | 40% | 231 |
| Totals | 492 | 185 | 677 | 1 976 | ||
| * only 5 field days held in the area, extension officer was ill. | ||||||
Table III
Frequency of Field Day attendance during the 4 month study period
| Survey area | Number of farmers with no attendance | Number of farmers 1 F.D. only | Number of farmers 2 F.D. only | Number of farmers attending 3 or more days |
| Bongore | 1 (2%) | 11 (24%) | 14 (30%) | 41 (89%) |
| Funyula | 5 (10%) | 6 (13%) | 7 (15%) | 31 (63%) |
| Kimilili | 6 (11%) | 4 (8%) | 8 (11%) | 37 (70%) |
| Kipkelion | 1 (7%) | 4 (27%) | 3 20%) | 7 (46%)* |
| Suneka | 23 (36%) | 10 (19%) | 6 (12%) | 13 (25%) |
| Koibarak | 34 (53%) | 11 (17%) | 3 (5%) | 16 (25%) |
| Kuria | 13 (25%) | 14 (27%) | 9 (18%) | 15 (23%) |
| Lurambi | 4 (7%) | 9 (7%) | 10 (18%) | 34 (60%) |
| Migori | 17 (25%) | 25 (28%) | 15 (22%} | 11 (16%) |
| Rangwe | 33 (15%) | 11 (17%) | 4 (6%) | 17 (26%) |
| Rigoma | 37 (42%) | 29 (33%) | 8 (9%) | 15 (17%) |
| Sondu | 2 (9%) | 2 (9%) | 1 (4%) | 18 (78%) |
| Yala | 11 (23%) | 3 (6%) | 6 (13%) | 28 (58%) |
| Totals | 187 (26%) | 139 (20%) | 92 (13%) | 282 (40%) |
* only 5 field days held in the area, extension officer was ill.
On a global basis 3 or more field days were attended by 40 % of the practicing or new farmers. Of these, over 80 % attended half or more. Again using data from all the combined areas, a significant number of farmers (26%) did not attend any field days whatsoever, 20 % only attended 1 field day, and 13 % only attended 2 field days, From Table II, a general average of 32 % of the fish farmers in all areas were attending each field day. This is a reasonable percentage and could serve as a baseline for future work.
It would be most unlikely that ail farmers would be able to attend ail field days. There are several reasons why farmers did not attend more. During the impact survey, interviews were made with 42 farmers who had attended 2 or less field days, and comments were made by at interviewed farmers on field day organization, The most common reason given for missing a field day was that they were not informed in time of the data and venue. Other reasons given varied from being too busy, poor timing of the field days with other activities such as working hours for those employed, field days conflicting with funerals or other events, distance, old age or illness, the farmer was elsewhere and not available, and, finally, a lack of interest. If the main reason for poor attendance was lack of information on the date and venue, a major part of the fault lies with the frequent scheduling of the field days, or 2 or 3 per month. This was done largely due to a shortage of time. A better schedule would be 1 field day a month.
A total of 269 farms were visited, interviews were completed with 265 persons; 182 were made with the farmer himself, 33 with a family member (either a spouse or a child), and 50 were made with a representative of a women's or youth group. It was possible to interview 84 % of those who had attended 3 or more field days (223 farmers). The remaining 42 interviews were made with farmers who had attended no field days (23) and those who had attended 2 or less (19). This allows a comparison between the two groups: those who attended 3 or more field days, and those who did not.
The data collected during the impact survey was far more reliable and informative than that of the initial survey. The team conducting the survey were better trained and well aware of the reasons for the survey and the necessity of collecting accurate data. There was a wealth of detailed information available covering actual management practices and the knowledge level of the farmers. The primary purpose of this paper is to demonstrate the overall impact of the field day approach to fish farming development.
For the purposes of brevity and clarity, this paper only summarizes the most basic information derived from the questionnaire. For example, several questions were asked on manuring a pond what is the source, amount, and frequency of application. This paper only analyzes the fact, easily observable, if there are or are not traces of manure in the ponds. This would logically indicate that the field day had an impact as the farmer is actually practicing better manuring techniques. Information on other field day topics were analyzed by summarizing the responses; for example if the farmer was able to correctly answer the several questions on oxygen in a fish pond, it was considered that he had understood that field day topic and his level of knowledge on fish farming had increased. Finally, the impact can be measured in signs of physical improvement or expansion of the ponds.
There was very clear evidence that the field day approach had made a very favorable impact on the farming community. This positive impact is noticeable in the increase in the number of practicing fish farmers, the physical improvements in existing ponds, and the very high rate of information absorption of those who attended the field days.
3.3.1 Beginning Fish Farmers
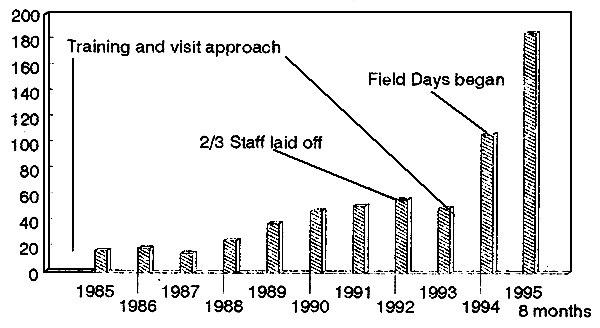
There was the very substantial improvement in the annual rate of increase in new farmers engaging in fish farming for the first time. Prior to the introduction of the field day approach, and for the 5 year period between 1989 and 1993, there was an average of 49 (min 38, max 57) new fish farmers beginning each year within the sampled areas. The field day approach began in 1994. in that year, 107 farmers began fish farming, roughly doubling the previous average. In the 8 months of 1995, or until the date of this paper, 185 new farmers had begun. Extrapolation to a full 12months would indicate that the rate of increase in new farmers had quadrupled over 2 years.
In the same areas there were 379 farmers in 1993 and by the end of the survey in August 1995, there were 671, or a 77% increase in total numbers of active fish farmers in less than 2 years. This is all the more remarkable if one considers that the extension staff was reduced by 2/3 in 1992 (See figure 2).
Figure 2
Fish Farming Concentration Areas
Number Farmers Beginning Fish Farming
3.3.2 Increased Knowledge and Better Management Practices
The poor information derived from the initial survey does not allow a straight forward “before and after” analysis of the impact of the field days on practicing fish farmers. However, given the far better information available from the impact survey, it is possible to compare the level of knowledge, improved management practices, and the physical improvements to the ponds between those farmers who had attended 3 or more field days and those who did not, It was also apparent that there, was a considerable amount of information exchange between farmers, and those who had missed a particular field day were able to get the information later from those who attended.
Table IV (following page) presents these basic summaries of responses to questions on specific field day topics and the physical signs of improved management, The table compares those farmers who had attended no field days, those who had attended that particular field day, and those who attended 3 or more field days, Finally, to demonstrate the inter-farmer exchange of information, the table includes the responses from those farmers who had missed that particular field day but had attended at least 3 other field days in the series.
Table IV demonstrates the very clear differences between those farmers who had not attended the field days and those who did. There is a clear improvement in the knowledge level of the farmers and clear evidence of improved management techniques. From table IV, only 26 % of those farmers who had not attended any field days were manuring their ponds. This percentage increased to 70 % for those who had attended that field day, 67 % for those who had attended 3 field days or more, and to 58 % for those who missed that field day but attended 3 or more others. The same positive trend is clearly visible for all topics.
This analysis is actually rather conservative as several factors make the results appear worse than in fact. Table IV combines the responses of all interviews, yet only 185 were made with the farmer who actually attended the field days, and 33 ware made with a family member who had not. Fifty of the interviews were with a member of either a women's or a youth group, the person being interviewed may not have been the same person who attended a particular field day. Including all responses from all interviews gives a better indication of the general impact of field days, if one reduces the questionnaire database to the 185 farmers who actually attended the field days, the correct response rate for each topic increases to between 87% and 96%.
| Field day topic | Attended no field days | Attended that field day | Attended 3 or more field days | Did not attend that day but 3 or more others | ||||
| Correct responses / visible signs | Yes | No | Yes | No | Yes | No | Yes | No |
| Field day 1: Manure | ||||||||
| Signs of manuring | 26 % | 74 % | 70 % | 30 % | 67 % | 33 % | 58 % | 42 % |
| Field day 2: Compost crib | ||||||||
| Crib present in the ponds | 53 % | 47 % | 81 % | 19 % | 77 % | 23 % | 72 % | 28 % |
| Crib full of compost | 9 % | 91 % | 50 % | 50 % | 53 % | 47 % | 33 % | 67 % |
| Field day 3: Pond maintenance | ||||||||
| Pond full of water | 56 % | 44 % | 82 % | 18 % | 78 % | 22 % | 73 % | 27 % |
| Grass cut | 43 % | 52 % | 90 % | 10 % | 87 % | 13 % | 83 % | 17 % |
| No water weeds in the ponds | 52 % | 48 % | 70 % | 30 % | 68 % | 32 % | 67 % | 33 % |
| Field day 4:Tilapia species | ||||||||
| Able to differentiate species | 17 % | 3 % | 77 % | 23 % | 74 % | 26 % | 73 % | 27 % |
| Field day 5: Clarias | ||||||||
| Conversant with culture/species | 13 % | 87 % | 77 % | 23 % | 60 % | 40 % | 32 % | 68 % |
| Field day 6: Oxygen | ||||||||
| Understands oxygen in fish farming | 43 % | 57 % | 82 % | 18 % | 74 % | 26 % | 24 % | 76 % |
| Field day 7: Record Keeping | ||||||||
| Keeps records | 13 % | 87 % | 79 % | 21 % | 71 % | 29 % | 35 % | 65 % |
| Field day 8: Sampling | ||||||||
| Understands importance | 26 % | 74 % | 78 % | 22 % | 74 % | 26% | 66 % | 34 % |
| Field day 9: Male tilapia | ||||||||
| Understands the subject | 17 % | 83 % | 79 % | 21 % | 40% | 60 % | 49 % | 51 % |
| Wants to try monosex culture | 48 % | 52 % | 71 % | 29 % | 69 % | 31 % | 66 % | 34 % |
| Field day 10: Feeding | ||||||||
| Understands the subject | 65 % | 35 % | 88 % | 12 % | 87 % | 13 % | 87 % | 13 % |
| No attendance | 3 field days or more | |||||||
| Observed by interviewer: | Yes | No | Yes | No | ||||
| Signs of pond expansion | 4 % | 96 % | 30 % | 70 % | ||||
| Signs of pond repairs | 17 % | 83 % | 41 % | 59 % | ||||
Eight out of the 23 farmers who did not attend any field days whatsoever had defaulted on a loan from the project credit scheme, and they avoided any function where they might expect a reminder to repay their loan, These 8 farmers had previously been trained by the project informal courses and were visited monthly by extension officers. Their responses positively influenced the data for farmers who had attended no field days. If these are removed from the data base, the difference between those attending field days and those who did not is even more striking. The remaining farmers had very poor management practices and little idea on the topics discussed, it would be risky, however, to extrapolate from such a limited sample.
Again there were particular situations which negatively influenced the data, The survey team was instructed to mark what was actually taking place at the time of the interview. A farmer constructing a new pond may not have yet built a compost crib, although he will in due course. Another farmers ponds may be empty awaiting restocking and there is, at the time of the survey, an empty crib and no feeding or manuring. Finally, the survey covered farmers from several ethnic backgrounds speaking several different languages. There were a few inevitable misunderstandings or mis-interpretations.
The above factors could ail combine to make the impact of the field days appear more striking. The purpose here is to describe the general impact of field days, and it is still abundantly clear that the field day approach is effective in imparting correct information to large numbers of farmers, and that this information is spread to others. Family members were often capable of answering specific questions, Those farmers who did not attend a particular field day were able to get the information from another, and in surprising detail. There is a considerable amount of inter-farmer, inter-family, and inter-group exchange of information on fish farming techniques,
The fact remains that of the global average of aft farmers in the 13 areas, only 40% of the existing fish farmers attended 3 or more field days. The sample of those who had not attended any field days would indicate that there was little impact on the 60% who did not. There was a considerable variation in attendance between areas (see Table II and HI above). Those who had attended 3 or more days varied from a high of 89% to a low of 16%. The lowest values were in areas with the highest numbers of farmers such as Rigoma, with 89farmers and only 17 % attending 3 or more days, and Migori, with 68 farmers and only 16 % attending 3 or more days. These values negatively skew the global average.
Better attendance was found in the areas where the actual number of practicing farmers was fewer, although there is no clear correlation that would indicate the optimum target number. The principle reasons for low attendance have been given above. There may, however, be a need to review the field day approach in terms of numbers of farmers as well as the radius of the areas where they are located.
The question also arises if there were other, non-project related fish farming development activities going on where farmers could have obtained their information and assistance, Government entities such as the Department of Fisheries and non-governmental organizations such as the Peace Corps, YMCA, CARE, missionaries, and others also promote fish farming in Western Kenya. Undoubtedly, their efforts have had a favorable impact on the overall fish farming development effort, This in no way negates the results presented here. These entities were not active in most areas where the field days were held, and where they were present, Department of Fisheries personnel and representatives of other groups actively participated in the field days organized by the project The questionnaire asked if the farmers had found field days helpful or not. The response was 97 % favorable.
Another question is the role of formal training done prior to the introduction of the field day approach. The previous project had formally trained, in 3 to 5 day residential courses, over 1,300 farmers, women and youth groups in fish farming. These farmers and groups were spread throughout the Western Kenya region, in the areas of the current study, only 12 farmers, or 4.5% had attended such courses before the field days began. Of these 12 farmers, 8 were credit farmers who did not attend any field days, and their lack of correct responses would indicate that the information obtained during the formal courses was not well retained. These are negligible numbers and do not influence the results, Where appropriate, farmers were asked to compare the field days and the forma! courses. The response was unanimous; the field days were far more helpful.
The actual cost of conducting a single field day varied between Ksh 2 200 and Ksh 4 000, irrespective of the number of farmers who attended (Ksh 55 = 1 US$, September 1995), The average cost per field day was Ksh 3 200. This includes staff travel to and from the site of the field day, refreshments, a token payment to the host, and incentive payments made to the staff. This incentive cost represented roughly 2/3 of the total cost per field day, or Ksh 2.000 per field day.
The total cost of the 140 field days held during the study was Ksh 448,000, there were 1 976 farmer-training days, This gives a cost of Ksh 226 / farmer-training day. in contrast, a formal resident training course costs Ksh 1 100 / farmer - training day. For the sake of comparison, if a farmer attends 10 field day courses, the cost of training him is Ksh 2 260, while a resident course of 4 days, teaching the same material, costs Ksh 4 400. The field day approach cost is about half, and there is clear evidence that the field days had more of an impact than the formal courses.
For planning purposes, it is important to note the significant cost of both of the surveys. The initial survey cost Ksh 80 000, the impact survey cost Ksh 280 000. The two represent 80% of the cost of actually holding the field days.
![]()
![]()
![]()