Every business managed as a private enterprise is compelled to trade according to the principles of economics and to make a profit in order to remain competitive and viable. This profit is needed to finance:
- Withdrawals (entrepreneur's remuneration)
- Capital investments
- Payment of interest on capital
- Repayment of credits
- Reserves
- Taxes on profits
The profit is also affected by the company's performance and thus depends on the following parameters:
- Income (Market price of the products)
- Material usage (Material costs)
- Wages and salaries costs
- Miscellaneous fixed and variable costs
Thus profit is achieved not solely by increasing income, since for example the sales volumes and product prices in the market cannot be increased at will, but also by reducing the other costs mentioned above, whose total constitutes the manufacturing costs. These costs must be planned, controlled and monitored in the context of a profit-oriented business management to enable the planned profit target to be achieved within a period of time under review. The determination of the manufacturing costs for a given product or group of products is carried out in the context of the costs calculation and will be discussed in Section 10.1, taking cut timber from coconut wood as an example.
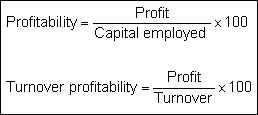
Since absolute values are not very relevant, the important thing is the profit in relation to particular parameters such as the capital employed or the turnover achieved.
The ratio based on these parameters is called the profitability (Figure 109):
Fig. 109: Profitability

When deciding whether or not to carry out a capital investment project, the main thing of interest is how and how successfully the capital that is employed will return again and whether it will be necessary to employ additional capital, e.g. at the start of the project's life, to cover initial losses. Profitability calculations are used to plan and assess capital investment projects. Profitability calculations for capital investments consist of a comparison between the expenditures for investments and for the on-going operation of the investment project (= costs), and the expected income (= proceeds) that are to be achieved through the capital investment project. The comparison of incomes and expenditures is carried out for several periods of time, the surplus (= cash-flow) of proceeds over expenditures being determined for each planning period. The profitability of the capital investment is calculated on the basis of the income surplus.
Table 51: Model of a cash-flow analysis
| Period 1 | Period 2 | Period 3 | Period n | |
| I. | Outgoing payments for investments | |||
| II. | Planned payments for manufacturing of goods and services (manufacturing costs) | |||
| III. | Cash-outflow (I + II) | |||
| IV. | Cash-inflow (Revenues) | |||
| V. | Cash-flow (IV ./. III) | |||
| VI. | Cumulated cash-flow - Period 1-n | |||
| Result: Profitability, e.g. Internal Rate of Return (IRR) | ||||
One measure of profitability is the “Internal Rate of Return”, which expresses how the capita I employed is bearing interest. A detailed explanation of the determination of the internal rate of return must be left to the specialist business economics literature. The advantage of the “internal rate of return method” is that it eliminates the time difference between the payment dates for the investments and the return flows (pay-offs) of capital in the individual periods of the project lifetime by discounting the interest amounts to the start of the planning period (= cash value). This is especially relevant to the result when periods with capital repayment amounts of different sizes are used in the calculation in the overall planning period.
As a rule the cumulative cash-flow in the first periods after the initial investments is negative, i.e. the cash-inflow were so far not able to cover or exceed the cash-outflow. The period in which the “cumulated cash-flow” becomes positive can be described to a first approximation as the amortization period.
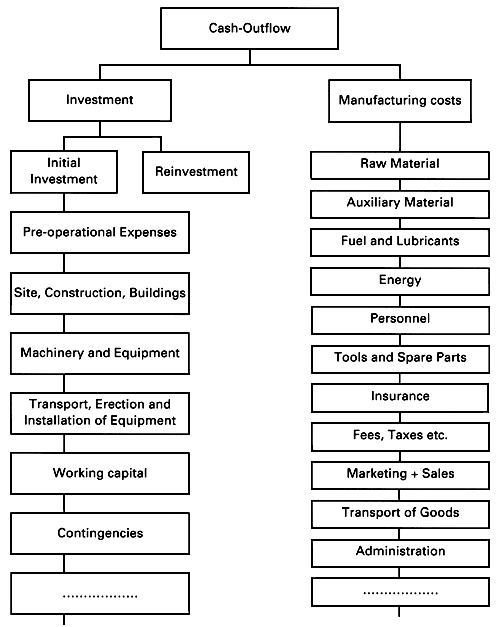
Fig. 110: Composition and structure of the cash-outflow

Section 10.3 describes as an example a cash-flow analysis and internal rate of return for a furniture factory producing furniture from coconut palm wood.
1. Basic data
- Average log length: 4.0 m
- Average log diameter: 250 mm (without bark)
- Average log volume: 0.20 m3 (r)
- Working days per year: 300
- Working hours per day: 1 shift of 8 hours = 480 min
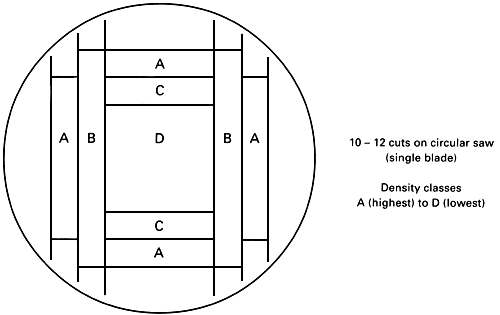
2. Cutting principle sawn timber
Fig. 111: Different density boards cut out of a palm stem

3. Calculation of circular saw capacity
| - Effective production time: 480 min |
| - 60 min standstill time |
| 420 min per day |
- Cutting time per log: 12 min
- Cutting volume per day: 7 m3 (r)
- Cutting volume per year: 2100 m3 (r)
4. Sawn timber output p.a.
| - High density (HD) material (yield 33 %): | approx. 700 m3 p.a. |
| - Medium density (MD) material (yield 12 %): | approx. 250 m3 p.a. |
| Total volume of sawn timber: | 950 m3 p.a. |
| (+ Firewood approx. 300 m3p.a.) |
Table 52: Calculation of manufacturing costs (Output: 950 m3 s.t. p.a.)
| Cost item | Costs p.a. (US $) | Costs p. m3 (US $) |
| 1.0 Raw material | 31,500 | 33.15 |
| 2.0 Auxiliaries | ||
2.1 Electric energy | 7,200 | 7.58 |
2.2 Fuel and lubricants | 1,600 | 1.68 |
2.3 Treatment material | 3,700 | 3.90 |
| 3.0 Personnel | ||
Wages and salaries (incl. social costs) | 32,000 | 33.68 |
| 4.0 Maintenance and saw doctoring | 5,600 | 5.90 |
| 5.0 Spare parts | 5,500 | 5.80 |
| 6.0 Administration and sales | 6,100 | 6.42 |
| 7.0 Insurance etc. | 3,100 | 3.26 |
| 8.0 Interests | 8,000 | 8.42 |
| 9.0 Depreciation | 17,500 | 18.42 |
| (Processing costs pos. 2 – 9) | 90,300 | 95.06 |
| Total manufacturing costs | 121,800 | 128.21 |
Excoursus: Sawing of different products in a single period
If different types of products are sawn in a single review period, and give rise to different inputs for the different products and thus to differing processing costs, then the average processing cost per m3 of sawn timber mentioned above must be allocated according to the cost causation principle.
Example:
Table 53: Processing costs per product type
| Type of product | Proportion by volume | Costs factor based on proc costs | Calculation factor regarding volume and proc. costs | Processing costs per product type |
| Unedged sawn timber | 0.2 | 1.0 | 0.20 | 63.8 |
| Edged sawn timber | 0.5 | 1.5 | 0.75 | 95.7 |
| Construction timber | 0.3 | 1.8 | 0.54 | 114.8 |
| 1.0 | 1.49 |
Subsidiary calculation:

| Important |
| The values of this calculation cannot be transferred to other application cases. They act only as examples. However the methods and systematics of this calculation are generally valid and are transferable! |
The cash-flow plan for the coconut palm wood furniture plant is calculated for a period of 10 years. It is based on the costs and revenues calculated separately. Investment costs as well as re-investment were considered as follows:
Year “0”: Total investment of 4,885 million Indonesian Rp
Year “5”: Re-investment of 340 million Rp for equipment in Period 5 (sales/administration)
All calculations are based on constant price levels, since the anticipation of inflation-related increases in cost and revenues would be highly speculative and it may furthermore be assumed that inflation-related effects would counterbalance each other.
The cash-flow plan shows that, except year “0” (initial investment, no production), no negative cash-flow values (cash-outflows) are to be expected, and that a positive cumulative net cash-flow is achieved already after 3.5 years. This means that the payback period is only 3.5 years. The cumulative cash-flow over the observation period of 10 years shows a result of 10,663 million Rp (2 times the initial investment).
The internal rate of return, i.e. the yield on invested capital amounts to 28 % (see Table 54).
Table 54: Plan for cash-flow analysis and internal rate of return (IRR)
| Period 0 | Period 1 | Period 2 | Period 3 | Period 4 | Period 5 | Period 6 | Period 7 | Period 8 | Period 9 | Period 10 | ||
| I. | Investment | |||||||||||
| Land and buildings | 1,320.00 | |||||||||||
| Equipment and machinery | 3,250.00 | 340,00 | ||||||||||
| Working capital | 315.00 | |||||||||||
| Total Investment | 4,885.00 | 340.00 | ||||||||||
| II. | Manufacturing Costs | |||||||||||
| Materials | ||||||||||||
| Cocowood | 467.25 | 700.88 | 934.50 | 934.50 | 934.50 | 934.50 | 934.50 | 934.50 | 934.50 | 934.50 | ||
| Boards | 67.20 | 100.80 | 134.40 | 134.40 | 134.40 | 134.40 | 134.40 | 134.40 | 134.40 | 134.40 | ||
| Fittings, screws etc. | 78.75 | 118.13 | 157.50 | 157.SO | 157.50 | 157.50 | 157.50 | 157.50 | 157.50 | 157.50 | ||
| Glue | 3.47 | 5.20 | 6.93 | 6.93 | 6.93 | 6.93 | 6.93 | 6.93 | 6.93 | 6.93 | ||
| Laquer, varnishes | 31.61 | 47.41 | 63.21 | 63.21 | 63.21 | 63.21 | 63.21 | 63.21 | 63.21 | 63.21 | ||
| Total material | 648.27 | 972.41 | 1,296.54 | 1,296.54 | 1,296.54 | 1,296.54 | 1,296.54 | 1,296.54 | 1,296.54 | 1,296.54 | ||
| Auxiliaries | ||||||||||||
| Electric energy | 15.60 | 23.40 | 31.20 | 31.20 | 31.20 | 31.20 | 31.20 | 31.20 | 31.20 | 31.20 | ||
| Fuel and lubricants | 2.15 | 3.23 | 4.30 | 4.30 | 4.30 | 4.30 | 4.30 | 4.30 | 4.30 | 4.30 | ||
| Packing material | 4.75 | 7.13 | 9.50 | 9.50 | 9.50 | 9.50 | 9.50 | 9.50 | 9.50 | 9.50 | ||
| Total auxilaries | 22.50 | 33.75 | 45.00 | 45.00 | 45.00 | 45.00 | 45.00 | 45.00 | 45.00 | 45.00 | ||
| Personnel | ||||||||||||
| Wages, Salaries | 286.50 | 286.50 | 286.50 | 286.50 | 286.50 | 286.50 | 286.50 | 286.50 | 286.50 | 286.50 | ||
| Total personnel | 286.50 | 286.50 | 286.50 | 286.50 | 286.50 | 286.50 | 286.50 | 286.50 | 286.50 | 286.50 | ||
| Other costs | ||||||||||||
| Maintenance | 25.30 | 25.30 | 25.30 | 25.30 | 25.30 | 25.30 | 25.30 | 25.30 | 25.30 | 25.30 | ||
| Spare parts | 25.30 | 25.30 | 25.30 | 25.30 | 25.30 | 25.30 | 25.30 | 25.30 | 25.30 | 25.30 | ||
| Fees, Taxes | 15.75 | 23.63 | 31.50 | 31.50 | 31.50 | 31.50 | 31.50 | 31.50 | 31.50 | 31.50 | ||
| Insurance | 45.70 | 45.70 | 45.70 | 45.70 | 45.70 | 45.70 | 45.70 | 45.70 | 45.70 | 45.70 | ||
| Sales promotion | 49.00 | 49.00 | 49.00 | 49.00 | 49.00 | 49.00 | 49.00 | 49.00 | 49.00 | 49.00 | ||
| Total other costs | 161.05 | 168.93 | 176.80 | 176.80 | 176.80 | 176.80 | 176.80 | 176.80 | 176.80 | 176,80 | ||
| III. | Cash-Outflow II + II) | 4,885.00 | 1,118.32 | 1,461.58 | 1,804.84 | 1,804.84 | 2,144.84 | 1,804.84 | 1,804.84 | 1,804.84 | 1,804.84 | 1,804.84 |
| IV. | Cash Inflow (Revenues) | |||||||||||
| Local markets | 1,225.00 | 1,312.50 | 1,750.00 | 1,750.00 | 1,750.00 | 1,750.00 | 1,750.00 | 1,750.00 | 1,750.00 | 1,750.00 | ||
| Export markets | 525.00 | 1,312.50 | 1,750.00 | 1,750.00 | 1,750.00 | 1,750.00 | 1,750.00 | 1,750.00 | 1,750.00 | 1,750.00 | ||
| Total Cash Inflow | 1,750.00 | 2,625.00 | 3,500.00 | 3,500.00 | 3,500.00 | 3,500.00 | 3,500.00 | 3,500.00 | 3,500.00 | 3,500.00 | ||
| V. | Cash-Flow (IV ./. III) | -4,885.00 | 1,163.42 | 1,163.42 | 1,695.16 | 1,695.16 | 1,355.16 | 1,695.16 | 1,695.16 | 1,695.15 | 1,595.16 | 1,695.16 |
| VI. | Cum. Net Cash-Flow | -4,885.00 | -3,721.58 | -2,558.16 | -863.00 | 832.16 | 2,187.32 | 3,882.48 | 5,577.64 | 7,272.80 | 8,967.96 | 10,663.12 |