![]()
![]()
![]()
Chan Sinath1
1. Introduction
Cambodia is bordered by Thailand in the west and by Lao PDR and Thailand in the north, by Viet Nam in the east and by the Gulf of Thailand in the south. The total land area of Cambodia is 181 035 km2, consisting of 24 provinces, including two municipalities and 172 districts. The forest area comprises 67 percent of the country, equal to 12.1 million ha. The cultivated area is approximately 21 percent, equal to 3.78 million ha (Table 1). The rice cultivated area in 1999 amounted to 2.08 million ha or 91.2 percent of the total cultivated area (Table 2).
Table 1. Irrigated agriculture and land uses in Cambodia
| Land Use Group | Area (ha) |
| Natural Area | |
| Forest | 12 300 200 |
| 1. Mainly evergreen forest | |
| a. Broad leafed forest | 6 283 400 |
| • Dense broad leafed forest | 4 816 000 |
| • Flood evergreen forest | 361 700 |
| • Mangrove forest | 61 400 |
| • Mosaic of evergreen or deciduous forest and secondary vegetal formations | 528 900 |
| • Mosaic of flooded forest, swampy vegetation, fallow land | 157 200 |
| • Secondary vegetal formations | 358 200 |
| b. Pine forest (P. merkusii) | 9 800 |
| 2. Deciduous forest | 6 007 000 |
| Other vegetation | 1 529 200 |
| • Thickets | 95 600 |
| • Scrub, brushwood | 102 600 |
| • Grass savannah | 129 000 |
| • Grassland susceptible to flooding | 822 900 |
| • Swampy vegetation | 379 100 |
| Cultivated area | 3 785 000 |
| • Paddy field | 1 377 100 |
| • Paddy field with palm trees | 1 309 200 |
| • Mosaic of upland crops and secondary vegetal formations | 839 400 |
| • Mosaic of field crops and fruit garden/rural area in the lowlands | 174 400 |
| • Plantation (rubber) | 84 900 |
| Other land uses | 539 100 |
| • Bare land and sandy banks | 51 500 |
| • Open water areas, rivers | 487 600 |
| Total | 18 153 500 |
Source: Statistics of the Irrigated Agriculture Department, MOWRAM.
Table 2. Rice cultivated areas by rice ecosystems and calendar
|
Rice Type |
Harvested Area (ha) |
Sow |
Harvest |
Yield (t/ha) |
Production (t) |
|
I. Wet season |
|||||
| 1. Upland |
48 138 |
May |
October |
1.4 |
67 393.2 |
|
2. Rainfed lowland: |
|||||
|
• early |
371 553 |
May |
end October |
1.6 |
594 484.8 |
|
• medium |
838 237 |
May/June |
December |
1.8 |
1 508 827 |
|
• late |
529 495 |
June/July |
January |
1.7 |
900 141.5 |
| 3. Deepwater |
56 569 |
April/May |
Feb./March |
1.3 |
73 539.7 |
|
II. Dry season |
|||||
|
• Irrigated and |
Jan./Feb. |
April |
|||
|
• Recession |
233 000 |
December |
February |
3.04 |
708 320 |
|
Total |
2 076 992 |
3 852 706.2 |
Source: Statistics of the Irrigated Agriculture Department, MOWRAM.
The country’s current population is 13 million, which has been growing at an annual rate of 2.8 percent with a population density of 51 persons per km2. It is notable that there is a sex imbalance, undoubtedly because of two decades of conflict: 52.2 percent of the population comprises females, and there is a high proportion of youth. The current per capita GDP of US$290 is considered one of the lowest in the world. The agriculture sector in Cambodia has been the top earner of the national economy contributing about 45 percent of the GDP in 1994 and accounting for 75 percent of employed persons. Cambodia is a typical rice producing and exporting country with favourable natural conditions for paddy cultivation.
Thirty-six percent of the population is estimated to be below the poverty line now and the overall goal of the Royal Government of Cambodia (RGC) is poverty eradication through socio-economic development. Strategies for the attainment of this goal focus on, among other things, improved access to public services, the provision of safe drinking water supplies and sanitation, particularly in rural areas, improved infrastructure (especially irrigation systems) and increased agricultural productivity to achieve food security (in particular, large rice cultivation based on irrigation systems). The water sector makes an important contribution to the country’s development in a number of ways.
2. Objectives
Specific objectives of this paper are to:
3. Agricultural development and water resources management
Soil and agronomy
The soils in many irrigation systems, particularly the more successful recession cropping systems, are suitable for rice (especially large rice cultivation) but not for other crops. Generally, the limitation for other crops arises because of poor drainage or flooding. In these areas it is, therefore, unlikely that substantial areas of diversified cropping will be possible.
There are also good soils for both rice and other crops in areas away from the Mekong/Tonle Sap/Bassac flood plains. The development of these areas will generally involve new water storage to enhance water resources and allow double cropping. The cultivation of non-rice crops in these areas would improve the economics of irrigation development projects, providing that the market conditions allow the sale of cash crops at reasonable and predictable prices.
Cropping patterns and yields
There are three irrigated and three non-irrigated cropping patterns practised in Cambodia, and the irrigated cropping is almost exclusively for rice. The irrigated cropping patterns are:
The remaining non-irrigated cropping patterns are:
Average rice yields in Cambodia are only about 2 tonnes/ha. However, in special project areas where water control and agricultural practices are enhanced, rice yields can be 3.0 to 3.5 tonnes/ha. Conversely, rainfed yields may be as low as 0.7 to 0.8 tonnes/ha and crop failures as a result of inadequate rainfall are frequent.
Some 86 percent of Cambodia lies within the catchments of the Mekong River. Rising in China, the river passes through or borders Myanmar, Lao PDR, Thailand and Viet Nam before discharging to the South China Sea. With a drainage area of 810 000 km2 and a total length of 4 425 km, the Mekong is one of the major rivers of the world. The mean annual discharge entering Cambodia is in excess of 300 000 million m3, and it is estimated that with the contributions of downstream tributaries some 500 000 m3 discharge to the sea annually (Table 3).
Table 3. Hydrological characteristics of Mekong River tributaries
|
Tributary |
Catchment (km2) |
Annual (million m3) |
Discharge (m3/s) |
Annual runoff (mm) |
Natural low flow (m3/s) |
| Se Kong |
28 500 |
32 200 |
1 368 |
1 310 |
40 |
| Se San |
17 100 |
17 300 |
547 |
1 010 |
28 |
| Sre Pok |
29 450 |
29 800 |
942 |
1 010 |
118 |
| Prek Preah |
1 510 |
760 |
24 |
505 |
3 |
| Prek Krieng |
2 450 |
1 240 |
29 |
505 |
5 |
| Prek Kanpi |
1 150 |
580 |
18 |
505 |
2 |
| Prek Te |
4 170 |
2 530 |
80 |
610 |
10 |
| Preg Chhlong |
5 750 |
2 910 |
92 |
505 |
3 |
| Stung Chinit |
4 130 |
1 360 |
43 |
330 |
3 |
| Stung Sen |
14 000 |
6 190 |
196 |
440 |
8 |
| Stung Staung |
1 900 |
840 |
27 |
440 |
1 |
|
Stung Chickreng |
1 030 |
450 |
14 |
440 |
1 |
| Stung Streng |
3 210 |
1 140 |
36 |
355 |
1 |
| Stung Sisophon |
4 310 |
1 900 |
60 |
440 |
2 |
|
St. Mongol Borey |
2 700 |
1 980 |
63 |
730 |
3 |
|
Stung Battambang |
2 135 |
1 960 |
62 |
920 |
3 |
| Stung Pursat |
4 480 |
1 660 |
52 |
370 |
1 |
| Prek Thnot |
5 050 |
1 560 |
49 |
310 |
1 |
|
Mekong at Kratie |
646 000 |
441 600 |
13 974 |
680 |
1 750 |
Source: Mekong River Commission, 1994.
An important feature of the Mekong system in Cambodia is the Tonle Sap. During the wet season, as the water level in the Mekong rises, the flow in the Tonle Sap River draining the lake to the Mekong reverses and the lake fills, reducing the discharge downstream of Phnom Penh. By September/October, the level of the lake may have risen by 3 to 4 metres and the area extended to 10 500 km2. As the level of the Mekong falls, the water starts draining back, enhancing downstream dry season flows, and the lake eventually shrinks to about 2 600 km2 and less than 2 m in depth in the dry season. The annual rise in the Mekong causes extensive flooding downstream of Phnom Penh.
Climate
The climate of Cambodia is a tropical monsoon climate which has two seasons: a wet season, from May to October, resulting from the southwest monsoon, and a dry season, from November to April, resulting from the northwest monsoon. Usually, the wet season is disrupted by a short dry spell during two weeks in July or August. The annual average rainfall is 1 200 to 1 500 mm and the annual average air temperature 21 to 35×C. The relative humidity ranges from 65 to 70 percent in January and February to 85 to 90 percent in August and September. The annual evaporation is 2 000 to 2 200 mm, being highest in March or April at 200 to 240 mm/month, and the lowest in September or October at 12 to 150 mm/month. The monthly average evapotranspiration is 90 mm during the wet season to 120 mm for the dry season.
4. The needs of irrigation systems for large rice cultivation in Cambodia
The Royal Government of Cambodia (RGC) determined that producing more water for irrigated agriculture was important as it would help meet the needs of the government’s priority areas for poverty alleviation and economic growth by enabling an increase in the production of irrigated agriculture products for commercialization. Previously, the government’s proposals for public sector investment allocated about 22 percent of projected investment funds to the irrigation sector, but today the government has allocated about 35 percent of the total national budget to the irrigation sector for producing more water for agriculture.
The objective of the government’s investment in irrigation is to increase the total agricultural production, in particular in the large rice cultivation areas. When Cambodia has enough water for agriculture, the production may be raised by increasing yields and double cropping. Broader development objectives in the irrigation sector are economic growth and poverty alleviation. The above objectives can be achieved by enhancing and the country’s reservoirs, by catchment area planning, and by institutional strengthening.
5. Irrigation development in Cambodia at present
Following independence, between 1953 and 1960, eleven major schemes were undertaken with the assistance of the United States of America, including partial rehabilitation of the Baval reservoir, damaged during World War II, and of a number of other schemes built during the French colonial period. New projects included 13 000 ha of irrigation based on the largest of the Angkor reservoirs, Barai Occidental, and more than 50 colmatage canals in Kandal and Kompong Cham, bringing the area served to some 17 000 ha. With completion of these projects, the area under formal irrigation amounted to 74 000 ha.
The first stage (5 000 ha) of the multipurpose Prek Thnot project in Kompong Speu was started in the late 1960s. The project included construction of a dam to provide ultimately year-round irrigation of 70 000 ha, but with the start of the war, was left unfinished.
Events during the Khmer Rouge regime (1975–1979) period have had a major impact on agricultural systems throughout Cambodia. Recognizing the importance of irrigation, the government organized the construction of diversion works, bunded reservoirs and other structures, supplying a rectangular grid of canals across a large part of the rainfed area. Up until now, the irrigated areas comprise 407 000 ha (Table 4). Table 5 identifies the means used to reach the irrigated areas. Table 6 presents a classification of the principal rice soils of Cambodia.
Table 4. Total rice harvested and irrigated areas
|
Province |
Harvested Area, 1 000 ha |
Irrigated Area 1 000 ha | ||
|
Wet Season |
Dry Season |
Total | ||
|
Banteay Mean Chey |
140.2 |
0.3 |
140.5 |
36 |
| Siem Reap |
181.08 |
10.0 |
191.08 |
25.5 |
| Preah Vihear |
16.911 |
– |
16.911 |
0.3 |
| Stung Treng |
13.466 |
– |
13.466 |
0.8 |
| Ratanakiri |
17.618 |
– |
17.618 |
0.2 |
| Mondulkiri |
6.180 |
– |
6.180 |
0.2 |
| Kratie |
20.617 |
6.0 |
26.617 |
12 |
| Kompong Thom |
99.164 |
1.8 |
100.964 |
37 |
| Battambang |
168.571 |
1.2 |
169.771 |
52 |
| Pursat |
71.950 |
0.1 |
72.05 |
26 |
|
Kompong Chhnang |
83.066 |
9.9 |
92.966 |
22 |
| Kompong Cham |
167.243 |
30.0 |
197.243 |
30 |
| Svay Rieng |
162.318 |
9.0 |
171.318 |
20 |
| Prey Veng |
240.225 |
57.0 |
297.225 |
40 |
| Kandal |
42.674 |
45.0 |
87.674 |
20 |
| Takeo |
173.131 |
58.0 |
231.131 |
40 |
| Kompong Speu |
84.303 |
1.0 |
85.303 |
22 |
| Koh Kong |
7.272 |
– |
7.272 |
0.6 |
| Kompot |
133.107 |
2.5 |
135.607 |
19.3 |
| Kompong Som |
9.5 |
– |
9.5 |
|
| Phnom Penh |
5.396 |
1.2 |
6.596 |
3.1 |
|
Total |
1 843.992 |
233 |
2 076.992 |
407 |
Source: Statistics of the Irrigated Agriculture Department, MOWRAM.
Table 5. Implemented irrigation methods of Cambodia
|
Method |
Irrigated Area, ha | |
|
Wet season |
Dry season | |
| Gravity |
87 800 |
119 700 |
| Pump station |
19 350 |
23 650 |
| Mobile pump |
73 850 |
47 850 |
|
Traditional lift |
23 000 |
11 800 |
|
Total |
204 000 |
203 000 |
Source: Statistics of the Irrigated Agriculture Department, MOWRAM.
Table 6. Principal rice soils of Cambodia
|
Group |
Soil type |
Area (ha) |
|
Young alluvial soils |
Alluvials |
1 706 400 |
|
Leached acid soils on old alluvium |
Alluvials | included above |
|
Poorly drained lowland soils |
Cultural hydromorphics |
1 289 600 |
|
Imperfectly drained lowland soils |
Brown hydromorphics |
670 100 |
|
Acid sulphate soils |
Alluvials | 278 200 |
Source: Statistics of the Irrigated Agriculture Department, MOWRAM.
An inventory of irrigation systems carried out between 1993 and 1994 by the Mekong Secretariat listed some 950 schemes totaling 310 000 ha in the country (Appendix A). In rainfed lowland systems, the distinction between irrigated and rainfed area is not, however, well-defined; although not supplied through a formal distribution system, much of the rainfed crop receives water additional to direct precipitation. Irrigation of crops other than rice is largely confined to gardens.
In the wet season, supplementary irrigation may be through direct run-of-river diversion, pumping or by release of stored surplus run-off. In the dry season, when in the majority of rivers there is little flow, irrigation is only possible from storage, or by lifting water, either by pumping or by traditional methods, from residual flows, floodwater or, on a small-scale, from groundwater. Pumping from the dry season flows from canals and streams connected to the Mekong or Bassac Rivers is becoming a popular and productive dry season farming system in Takeo and Prey Veng Provinces.
Development opportunities
Gravity irrigation: The development options for irrigation offering the greatest scope for extensive development in Cambodia are exploitation of the abundant wet season river and stream flows to provide supplementary irrigation for the wet season rice crop, and provision of storage facilities to allow carryover for wet season run-off or flood water for irrigation in the dry season. At the other extreme, the areas which can be supplied from the smaller streams may be only a few hectares. In the dry season, flows, where they occur, are sufficient to irrigate only a minimal area. Gravity diversion has low operating costs and reduced reliance on mechanical equipment which, unless properly maintained, is prone to breakdown. Where channels are incised, however, diversion structures may be needed to gain command. There is also a need to safely pass flood flows, which can be very much larger than the flows which can be usefully diverted.
Pump stations: Pumped abstraction is appropriate where provision of the work necessary for gravity diversion would not be practical, or in terms of the quantity diverted, excessively costly. However, experience in Cambodia with fixed pump schemes has been disappointing, for a number of reasons, including: inadequate water source or siltation; over-dimensioning or over-sophistication of the pump; use of fuel-inefficient Soviet-designed pumps; technically unsound irrigation schemes; and lack of maintenance. Pumped schemes are vulnerable to poor maintenance. Whereas capital costs of pumped abstraction tend to be less than for gravity diversion, annual operation and maintenance costs are significantly higher: about US$80/ha/year for pump schemes as against US$20 to 25/ha/year for gravity irrigation schemes in the case of Cambodia.
Mobile pumps: Averaging 3 hp, mobile pumps are used during the wet season to supply supplementary irrigation water from a convenient source to small areas of adjacent land that are out of command. In the dry season, they provide water for irrigation of the recession crop, where they are replacing traditional pedal pumps and scoops. They are used to a lesser extent to provide water from residual river flows and water stored in canals for irrigation of a second crop on the terrace lands, and for irrigating vegetable and fruit gardens.
Shallow bunded reservoirs: Storage for wet season supplementary and dry season irrigation is provided by bunded reservoirs storing water at a depth of 1 to 3 m. There are 2 800 such reservoirs countrywide. The water stored may be derived either from upstream runoff or from impoundment of flood water from rivers. In the wet season, reservoirs commanding terrace lands, as well as providing storage, serve also as diversion structures. The area supplied is reported as 200 000 ha in the wet season, and 65 000 ha in the dry season. Dry season irrigated areas generally range from 20 to 30 ha, to several thousand hectares, with the large areas being flood recession areas.
Colmatage canals: The colmatage or warping canals are cut to bring silt laden floodwater to the low-lying land behind the levees of the Mekong and Bassac Rivers. Set at a relatively high level, the canals are closed off from the river by a temporary bund until mid-August to allow harvesting of the previous season’s crop. The canals are then filled on the rising flood land and, when the flood recedes, water is retained at the level of the canal, allowing recession cropping. In some cases, a head gate is provided, allowing water to be retained at a higher level. Recession crops are grown on the lower land. The canals also serve an important fishery function as they permit passage of broodstock on to the flood plain.
Development process
Irrigation and drainage — To expand the irrigated area from 20 percent to 50 percent of the total cultivated area by the year 2010 (it is possible to expand it a further 1 667 300 ha after that) so as to enhance rural food security and income generation MOWRAM needs to do the following:
Control and abatement/reduction of the effects of floods and other hazards — To prevent damage to large rice cultivation that may occur from floods, drought, watershed degradation, erosion and sedimentation, and to protect aquatic and fish resources, it is necessary to:
Policy, legal and institutional strategies — To realize integrated water resources management and development (IWRMD) it is necessary to:
6. Tools and means for sustaining the large rice-based irrigation system
6.1 Reform to facilitate participatory irrigation management and development (PIMD)
The former Director-General of Irrigation, Hydrology and Meteorology established a national policy, called Circular No. 1 on the implementation policy for sustainable irrigation systems. This was done without testing and development as, at that time, there were no financial resources to do these things. In 1999, the Ministry of Water Resources and Meteorology (MOWRAM) was established and the Ministry collected all the reactions to Circular No. 1 from farmers and NGOs, and then organized two workshops (a regional workshop in Battambang for the northwest provinces and a national workshop in Phnom Penh). The purpose of these workshops was to explore the participants’ ideas and experiences of participatory irrigation management and sustainable development in the irrigation sector and to develop Circular No. 1 and another two documents that supported Circular No.1. Later, MOWRAM established a steering committee that included all concerned technical senior officers of MOWRAM as its members. The steering committee was chaired by the Under Secretary of State of MOWRAM. The steering committee carefully reviewed the appendix attached to Circular No. 1, and the two supporting documents to improve transparency and to ensure they were suitable for dissemination to all related stakeholders. After that, these documents were submitted to the Minister of MOWRAM for official endorsement and for approval to create Prakash (Declaration) 306. Currently, the Prakash 306 has been endorsed, approved, issued and used for the formation of farmer water user communities (FWUCs).
FWUCs are to be established to manage irrigation schemes. They will be empowered to collect an irrigation service fee (ISF) to cover the cost of service delivery and operation and maintenance. Circular No. 1 states that the FWUC is intended to:
Circular No. 1 also states that the management committee of each of the FWUCs has the following responsibilities:
6.2 Institutional framework for adopting participatory irrigation management and development (PIMD)
In order to ensure effective adoption and implementation of this PIMD policy, it is essential that the following organizations are formed and gain the capacity to perform the roles described below.
FWUCs
The FWUCs are to be a legal corporate bodies of farmer water users who share the use of water and take responsibility for drainage of water within a single irrigation system. The FWUC will be responsible for operating, maintaining, rehabilitating and financing the overall management of the irrigation system. Before a new irrigation system is developed, an FWUC will be established to guide the process of development.
All water users of an irrigation system will be required to become members of the FWUC and will be required to pay irrigation service fees of a sufficient amount so as to finance the proper maintenance of the irrigation system and to ensure sustained functionality of the infrastructure. Irrigation systems with sub-units such as tertiary blocks that consist of several farmers may form FWUC groups as small primary units within the FWUC. Larger irrigation systems may form three or more levels within the FWUC. In all cases, there should be a scheme-level FWUC to ensure the principle of one irrigation system, one system of management.
6.3. Irrigation management transfer, agreement and provisions of support services to FWUCs
Once the FWUC has been legally established and registered with a statute, by-laws and elected leaders, the FWUC support team will provide further intensive on-the-job training and monitoring for one irrigation season. During this period the FWUC will prepare, approve and implement an irrigation service plan. After this season the FWUC support team and FWUC officers will prepare an official document that is an agreement between the provincial government (represented by the governor), the FWUC (represented by its elected officers) and the village government (represented by the village leader).
This agreement will describe the responsibilities and tasks of the FWUC, roles and tasks of the provincial and district government (for capacity building, regulation and provision of support services), procedures for dispute resolution, protocol for external relations of the FWUC and an official acknowledgement of the authority of the FWUC. Ownership of large irrigation structures at the headworks or main canals of large-scale irrigation systems, which have been built with manufactured materials by the government, will not be transferred to the FWUC. In these cases, it is only the rights to operate, use and maintain these structures that will be transferred to the FWUC. In all other cases, ownership of irrigation infrastructure will be transferred to the FWUC (as mutually agreed by the FWUC and government).
After the irrigation management transfer or certification of management authority agreement has been signed by the parties concerned, all future technical, financial or managerial services provided to the FWUC must be provided on the basis of the principle of partnership, which is realized through formal agreements, cost sharing and mechanisms to ensure accountability between parties to the agreement. After the irrigation management transfer or certification of management authority agreement is signed, any government staff assigned to the system will either be transferred to other assignments or will be deputed to the FWUC to continue irrigation management functions under the supervision of the FWUC (only by agreement with the FWUC).
Information on irrigation systems in Cambodia
National irrigation management agency: Ministry of Water Resource and Meteorology (MOWRAM)
|
General information on irrigation systems in Cambodia | ||||
|
Physical scale of rice-based irrigation system |
<500 ha |
500 to 5 000 ha |
>5 000 ha |
All scales |
|
Number of systems |
300 |
350 |
300 |
950 |
|
Annual water diversion (MCM) |
||||
|
% of agriculture water use |
95 | |||
|
% of domestic water use |
4 | |||
|
% of other water use |
1 | |||
|
Designed irrigation area (ha) |
||||
|
Effective irrigation area (ha) |
||||
|
Rice irrigation area (ha) |
407 000 ha | |||
|
Vegetable and orchard area (ha) |
||||
|
Other crops irrigation area (ha) |
||||
|
No. of beneficiaries — farmers |
11 million | |||
|
No. of beneficiaries — city residents |
2 million | |||
|
Wetland areas supported (ha) |
2.5 million | |||
|
Information on the largest rice-based irrigation system | |
|
Name |
Kamping Pouy |
| Location |
Bannon District, Battambang Province |
|
Construction period |
1966–1977 |
|
Designed irrigation area |
30 000 ha |
|
Functional irrigation area |
12 000 ha |
|
Annual water diversion (MCM) |
|
|
% of agriculture water use |
95 |
|
% of domestic water use |
4 |
|
% of other water use |
1 |
|
Rice irrigation area (ha) |
20 000 ha |
|
Vegetable and orchard area (ha) |
5 000 ha |
|
Other crops irrigation area (ha) |
5 000 ha |
|
Water supply per ha of irrigated rice field |
13 000 m3 |
|
Output (US$) per m3 of water supply |
|
|
No. of beneficiaries — farmers |
40 000 |
|
No. of beneficiaries — city residents |
10 000 |
|
Wetland areas supported (ha) |
40 000 |
1 Deputy Director General for Technical Affairs, Ministry of Water Resources and Meteorology (MOWRAM), Cambodia.
Dwi Kristianto and A. Tommy M. Sitompul
1. Background information on large rice-based irrigation systems
Irrigation has been practised in Indonesia for hundreds of years; yet current irrigation management is still encumbered by several problems, mostly related to the disparity between the modern concept of irrigation management and the traditional practice of the rural population.
As in many other developing countries, Indonesia’s irrigation development plan has been based primarily on a pragmatic technological approach. As a result, the far more difficult problems of long-term implementation and appropriate water management at farm level have been neglected.
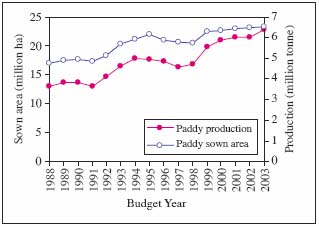
With Indonesia being an agrarian-based country, irrigated agriculture has always been highly important for its development and has been a priority in the Indonesian Government’s five-year development plans from 1969 to 1994 (REPELITA 1 to REPELITA 5). Figure 1 shows that in the 1970s farming still dominated the island of Java, though the plans have tried to expand farming to other islands.
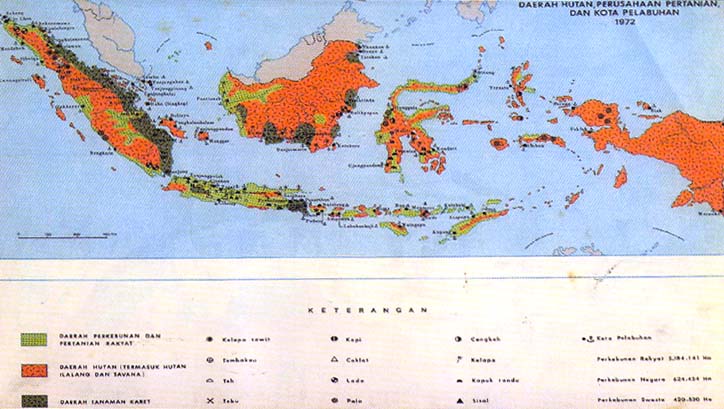
Figure 1. Map of Indonesia and plot utilization
The government’s irrigation programme consisted of rehabilitating existing irrigation systems and developing new irrigation systems. Within about sixteen years (1969 to 1985), a significant addition to the existing irrigation areas in Indonesia had been achieved. Table 1 presents a comparison between irrigation areas before and after the rehabilitation and new development programme within the period of 1966 to 1989.
From the figures presented in Table 1, it is evident that besides new irrigation development, much of the simple irrigation was transformed to technical irrigation. The irrigation profiles also changed significantly between 1985 and 2005, as shown in Annex 1. The figures show the latest irrigation profiles in terms of classifications of system type (technical, semi-technical and simple), service area (<1 000 ha, 1 000 ha to 3 000 ha, >3 000 ha), and management responsibilities (district, province, and national responsibility).
Table 1. Irrigation in Indonesia in 1966 and 1989
|
Irrigation Scheme |
Java and Madura (ha) |
Other islands (ha) |
Total (ha) |
|
Technical irrigation: |
|
|
|
|
Semi technical irrigation: |
|
|
|
|
Simple irrigation |
|
|
|
|
Total |
|
|
|
Source: Gany (1993).
Irrigation areas less than 1 000 ha are considered small irrigation areas and are the responsibility of the district authorities. Irrigation areas in the range 1 000 to 3 000 ha (medium size) and transdistrict irrigation areas are the responsibility of the provincial authorities. Irrigation areas greater than 3 000 ha and transprovince irrigation areas are the responsibility of the national government. The management responsibility covers primary and secondary systems, whereas the tertiary systems are the responsibility of water users associations.
In line with the irrigation reform agenda, the government set the goal of effective and efficient irrigation water management and irrigation performance became an important indicator of an irrigation system’s success. However, as irrigation reform is still under way, irrigation systems have not been nationally evaluated and current performance figures are not yet available.
However, a performance evaluation was carried out in 2004 for five irrigation areas: Guguk Rantau (West Sumatra); Mandika (South Kalimantan); Kasinggolan (North Sulawesi); Sesaat (West Nusa Tenggara) and Panewon (East Java). The performance figures for these irrigation areas are presented in Table 2.
Table 2. Evaluation of irrigation performance
|
Aspect and weight |
Water delivery |
Irrig. Facilities |
Irrig. mgt. |
Organi-zation |
Farming |
Total (category) |
|
Irrigation area (province) |
30% |
27% |
18% |
15% |
10% |
|
|
Guguk Rantau (West Sumatra) |
67 |
87 |
80 |
100 |
95 |
82.49 |
|
Mandika (South Sulawesi) |
49 |
93 |
54 |
100 |
76 |
72.13 |
|
Kasinggolan (North Sulawesi) |
90 |
73 |
55 |
78 |
48 |
73.11 |
|
Sesaat (West Nusa Tenggara) |
55 |
63 |
89 |
86 |
93 |
76.23 |
|
Penewon (East Java) |
70 |
100 |
81 |
88 |
99 |
85.68 |
Source: DGWR (2004).
Another study was conducted in Yogyakarta by Arif (2004) using “fuzzy logical analysis”. According to Arif (2004), of the 12 irrigation areas evaluated in Yogyakarta, i.e. Pengasih, Mejing, Donomulyo, Penjalin, Simo, Papah, Karang Ploso, Blawong, Sapon, Pendowo, Pijenan and Kali Bawang, only one irrigation system fell within the “good” category, whereas the others were within the “moderately good” category. Thus, from the two studies, it can be concluded somewhat crudely that irrigation performance in Indonesia tends to be in the “moderately good” category.
The government policy in irrigation is to achieve effective and efficient irrigation management through increased reliance on institutional strengthening and effective interagency coordination. Among the approaches that are being pursued to attain sustainable irrigation operation and maintenance, at least four have received high priority:
| (1) |
encouraging a sense of belonging, of participation and of responsibility; |
| (2) |
increasing the sources of funding needed for more reliable operation and maintenance; |
| (3) |
a judicious programming, budgeting, and control system with systematic financial control; and |
| (4) |
a special maintenance programme. |
Besides attaining a sufficient supply of food, irrigation development also aims to promote rural development through developing agricultural commodities. Some irrigation developments were intended to support the country’s transmigration programme in Kalimantan and Sulawesi etc.
2. Trend of agriculture development and water resources management
Present irrigation projects in Indonesia, with a few exceptions, are all aimed at increasing food supplies through extending and intensifying rice cultivation, whereas elsewhere in the world, irrigation mostly has been intended to support commercial farming commodities. Yet agricultural in Indonesia also plays a very important role in the economy of the country.
According to Gany (1993), in the 1950s to early 1960s the rate of growth of Indonesia’s agricultural production was the slowest amongst the Asian countries, even slower than many countries in Africa and Latin America.
By the 1970s, however, a remarkable acceleration in agricultural development started in Indonesia. The increased role of agriculture in the economy was even more striking against the background of remarkable improvements in international trade. As shown in Table 3, in 1973 the agricultural sector contributed about 40 percent of the gross domestic product. However the trend decreased to 23.33 percent in 1987, 24.07 percent in 1988 and 23.45 percent in 1989.
Table 3. Comparison of gross domestic product of Indonesia for selected years
|
Economic sector |
Gross domestic product | ||||||
|
1939 (%) |
1960 (%) |
1963 (%) |
1973 (%) |
1987 (%)* |
1988 (%)* |
1989 (%)* | |
| Agriculture |
61 |
54 |
52 |
41 |
23.33 |
24.07 |
23.45 |
| Industry |
15 |
8 |
9 |
9 |
13.83 |
12.08 |
13.06 |
| Mining |
– |
4 |
4 |
9 |
16.95 |
18.49 |
18.33 |
| Others |
24 |
34 |
35 |
41 |
45.89 |
45.36 |
45.16 |
Source: Gany (1993).
* Central Bureau of Statistics (1990).
In the same period, however, about 65 percent of Indonesian citizens were directly engaged in agricultural activities (with a slight reduction in the following years). This indicates that the per capita income from the agricultural sector was relatively low compared to the non-agricultural sectors.
These conditions have stimulated a change in how people view agricultural activities. In some regions, especially Java and some other provinces, there is a trend for young people in particular to view agricultural activities somewhat negatively. This is a consequence of the low market price for agricultural commodities, especially rice.
Working in industry is preferable for them as they feel they will earn a secure income even if it is at the minimum rate. Rural to urban migration is also common in many places and as a result only elderly people are active in agriculture.
According to the government regulation concerning irrigation, farmers can, with some exceptions based on national food demand, choose to cultivate any agricultural commodity. This means farmers can choose to cultivate high value agricultural commodities.
As an agrarian country, a good income from agricultural activities is very important and is something expected by Indonesians. However, it is not easy to realize and needs comprehensive measures to be taken including market price interventions and arrangements to ensure that the price is sufficient to enable farmers to earn a profit. The farmers themselves have to adopt modern agricultural practices (including irrigation modernization) and a market orientation.
Given the current economic conditions, including the frequent industrial layoffs, the government should promote agricultural activities to absorb the young labour force whose dream of earning money from working in urban industries is becoming more and more difficult to realize. Irrigation water should be managed democratically with the aim being effective, efficient and sustainable irrigation. It is easier when the reservoir water is used exclusively for agricultural purposes. Where the reservoirs serve other purposes, an agreement should be made to give priority of water allocation to irrigation.
On the other hand, as most of the water delivery systems have been designed for single uses, they need to be adapted for multiple uses. The increasing competition for water from the urban, agricultural, industrial and environmental sectors will require comprehensive improvement of water management. Integrated water resources management should therefore be introduced along with irrigation modernization.
3. New requirements for large rice-based irrigation systems
Most water delivery systems in Indonesia are designed for agricultural purposes and the water allocation mechanisms rarely change. If irrigation water is to be managed democratically, effectively, efficiently and sustainably, then comprehensive improvements will be needed to all components of the system to enhance system operation and management.
The most likely problems to arise as a result of current conditions are problems concerning sustainability and conflict of interest. Increasing competition over water from the urban, agricultural, industrial and environmental water sectors will occur everywhere. Addressing these problems will require the redesign of the irrigation infrastructure, including its appurtenance structures and management. We can identify at least four areas which need to be addressed:
(1) Infrastructure readiness
Water should be reliably distributed to all water users. The water conveyance systems, the measurement structures, the regulatory structures should be able to ensure reliable water allocations. Supporting technologies will be required, i.e. prediction method of dependable water, operation method, and standard operation procedures. As accountability is also important, the infrastructure should be calibrated, especially the measurement structures.
(2) Management readiness
The management, including institutional arrangements, should be able to manage and run the system as appropriately as possible. All management personnel should clearly understand their jobs and responsibilities. Human resources capability and an established system of management are the keys to success. The management should also be able to anticipate changing situations, conditions and policies and have an understanding of conflict management.
(3) Financial improvement
Sufficient financial support will enable the management plan to be implemented as envisaged. Management should be able to generate funds from the water users.
(4) Policy
National and regional policies should support efforts to achieve effective, efficient and sustainable irrigation.
Many district authorities do not make irrigation a high enough priority. They focus first on other infrastructures such as roads and buildings. Moreover, land conversion from farm land to housing and industrial estates is still occurring in many places.
4. Measures undertaken to ensure reliability of water allocation
Improving irrigation infrastructures through rehabilitation, upgrading and special maintenance are measures that should be undertaken to ensure reliability of water allocation. The limited budget available for these measures results in long delays in making the infrastructure technically reliable and ready.
Management improvement measures are faced with late regeneration programmes and human resources development is not well-prepared. In this time frame the number of irrigation engineers retiring is greater than the number of new irrigation engineers replacing them. As a result, the regeneration work can not be done properly. There is a gap of expertise between the senior engineers who are about to retire and the junior engineers who are not yet ready to replace them. Training and education programmes need to be conducted.
Participatory irrigation management can be introduced to the farmers to generate a sense of belonging, of participation and of responsibility. This will result in farmers being willing to pay an irrigation service fee. There are now 47 648 WUA in Indonesia. Establishing water users associations (WUA) at the systems where they are still absent should become a national programme. After their establishment, a strengthening programme addressing organizational, technical, administrative, farming and financial issues should be introduced.
5. Case study of Tarum irrigation system
Tarum irrigation system is within Jatiluhur Multipurpose Scheme. The scheme is intended for electricity, industry, tourism, irrigation and domestic use. As shown in Figure 2, the Tarum irrigation system consists of three subsystems namely West Tarum canal (WTC), North Tarum canal (NTC) and East Tarum canal (ETC). The service area of West Tarum canal is 68 000 ha, whereas the North Tarum canal is 78 000 ha and the East Tarum canal is 90 000 ha. Apart from conveying water for irrigation, the West Tarum canal also supplies domestic water for Jakarta. Figure 3 shows the distribution structure and a tertiary canal.
With regard to large rice-based irrigation system performance, the Tarum irrigation system is facing classical problems. However, the problems seem to be getting more and more complicated.
(1) Land conversion
Land conversion from irrigated paddy fields to industrial estates and housing has transformed thousands of hectares of potentially irrigated paddy field within the service area of Tarum irrigation system (Figure 4). The farmland area has been reduced, but on the other hand a significant additional regional income can be generated from tax payments from the industries that have located there. This fast growing industrialization has in turn stimulated a process of urbanization and the need for housing is increasing.
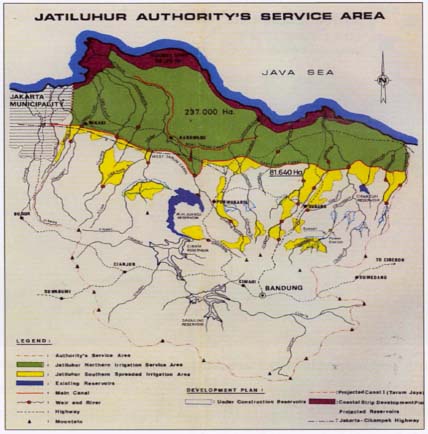
Figure 2. Map of Jatiluhur
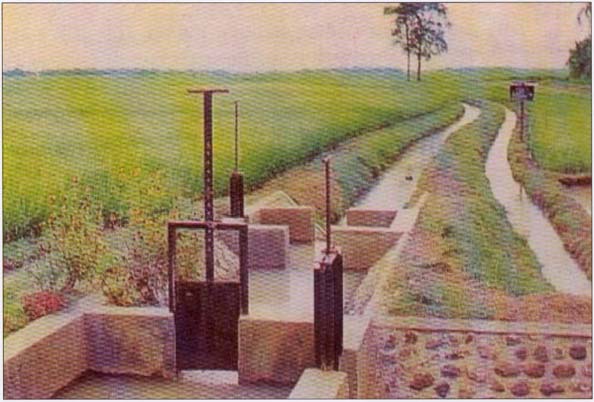
Figure 3. Distribution structure and tertiary canal
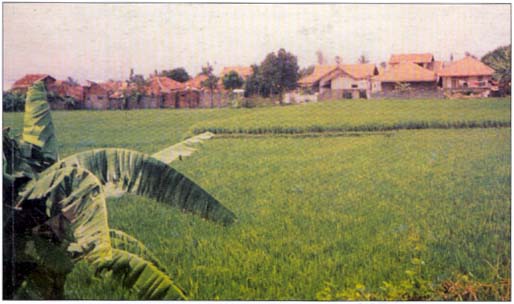
Figure 4. Farm land waiting to be converted to housing or industries
(2) Conflict of interest
All water users want to be given first priority for water delivery.
(3) Environment
Waste from industries and housing often result in environmental deterioration.
(4) Reducing services capacity
The main reason for the reduction in services capacity is the limited budget allocation. Proper operation and maintenance are being hindered by lack of funds. As a result, one can readily observe sedimentation in the canals, weeding in the unlined canals (as shown in Figure 5) and structural deterioration. The end result is that irrigation water is flowing below the required discharge rate.
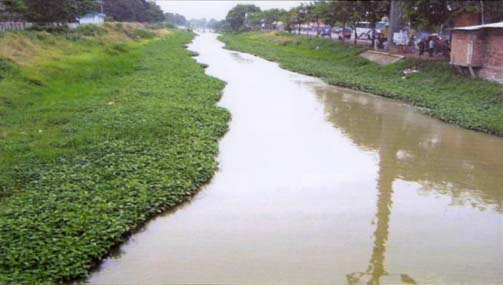
Figure 5. Weeds in unlined canal
6. Conclusions
References
Arif, Jabir dan Bahaduri. 2004. Analisis kesiapan daerah irigasi dalam proses penyerahan pengelolaan irigasi dwengan memekai logika kekaburan (fuzzy logic), Unpublished. UGM (Master’s thesis).
Central Bureau for Statistics. 1990. Statistical year of Indonesia 1990, BPS, Jakarta.
Direktorat PSDA. 2005. Kumpulan data irigasi di Indonesia. Unpublished.
Direktorat PSDA. 2005. Kumpulan data P3A di Indonesia. Unpublished.
Ditjen SDA. 2004. Pengkajian kinerja manajement organisasi petani dalam pengelolaan jaringan irigasi, Study report. Unpublished.
Ditjend Pengairan. 1999. Proceedings of the seminar on farmer’s participation in water management in Jatiluhur irrigation system. Unpublished.
DOI-I. 1989. Rekap inventarisasi sistim irigasi seluruh Indonesia. Inventory Report. Unpublished.
Gany, A. 1993. The irrigation based transmigration programme in Indonesia. Manitoba University, Canada (Ph.D. Dissertation).
Harsono, Djenen & Harjono. 1982. Atlas buana. Intermesa, Jakarta.
POJ. 1984. Profile of Jatiluhur Authority Public Company. POJ, Purwakarta.
Annex 1. Information on irrigation systems in Indonesia
National irrigation management Agency: Department of Water Resources, Ministry of Public Works
|
General information on irrigation systesm | ||||
|
Physical scale of rice-based irrigation systems |
<10 000 ha |
10 000 to 100 000 ha |
>100 000 ha |
All scales |
|
Number of systems |
1 |
|||
|
Annual water diversion (MCM) |
7.5 billion m3/year |
|||
|
% of agriculture water use |
6 500 million (86.7%) |
|||
|
% of domestic water use |
626 million (8.3%) |
|||
|
% of other water use |
5.0% |
|||
|
Designed irrigation area (ha) |
304 724 ha |
|||
|
Effective irrigation area (ha) |
242 585 ha |
|||
|
Rice irrigation area (ha) |
231 105 ha* |
|||
|
Vegetable and orchard area (ha) |
46 226 ha |
|||
|
Other crops irrigation area (ha) |
– |
|||
|
No. of beneficiaries — farmers |
4 806 million |
|||
|
No. of beneficiaries — city residents |
5 590 million |
|||
|
Wetland areas supported (ha) |
200 ha |
|||
* Palawija
|
Information on the largest rice-based irrigation system | |
|
Name |
Jatiluhur irrigation scheme |
|
Location |
Subang, Bekasi, Karawang, Purwakarta, Indramayu (West Java) |
|
Construction period |
1957–1967 |
|
Designed irrigation area |
Technical irrigation system |
|
Functional irrigation area |
Rice |
|
Annual water diversion (MCM) |
7.5 billion m3/year |
|
% of agriculture water use |
6 500 million m3/year (86.7%) |
|
% of domestic water use |
626 million m3/year (8.3%) |
|
% of other water use |
5% |
|
Rice irrigation area (ha) |
231 105 ha |
|
Vegetable and orchard area (ha) |
46 266 ha |
|
Other crops irrigation area (ha) |
– |
|
Water supply per ha of irrigated rice field |
13 165 m3/ha/season |
|
Output (US$) per m3 of water supply |
US$0.0075 (Rp. 75) |
|
No. of beneficiaries — farmers |
4 806 million |
|
No. of beneficiaries — city residents |
5 990 million |
|
Wetland areas supported (ha) |
200 ha |
Résumé of irrigation area in Indonesia by province
|
No. |
PROVINCE |
<1 000 ha |
(1 000 to 3 000 ) ha |
>3 000 ha |
TOTAL |
Total Area > 3000 & Trans Prov. | |||||||||
|
FULLY KAB/KOTA |
TRANS KAB/KOTA |
TRANS PROV. |
TOTAL. |
FULLY KAB/KOTA |
TRANS KAB/KOTA |
TRANS PROP |
TOTAL. |
FULLY KAB/KOTA |
TRANS KAB/KOTA |
TRANS PROP |
TOTAL. | ||||
|
1 |
2 |
3 |
4 |
5 |
6 |
7 |
8 |
9 |
10 |
11 |
12 |
13 |
14 |
15 |
16 = 5 + 9 + 11 + 12 + 13 |
|
1 |
NANGGROE ACEH DARUSSALAM* |
186 608 |
306 |
0 |
186 914 |
74 376 |
3 138 |
0 |
77 514 |
112 953 |
20 260 |
0 |
133 213 |
397 641 |
133 213 |
|
2 |
NOTH SUMATRA* |
206 948 |
3 865 |
0 |
210 813 |
128 088 |
2 846 |
0 |
130 934 |
88 646 |
6 300 |
0 |
94 946 |
436 693 |
94 946 |
|
3 |
WEST SUMATRA |
157 205.91 |
6 275.00 |
0 |
163 481 |
32 633 |
0 |
0 |
32 633 |
74 570 |
3 193 |
0 |
77 763 |
273 877 |
77 763 |
|
4 |
RIAU* |
64 386 |
0 |
0 |
64 386 |
168 315 |
0 |
0 |
168 315 |
61 558 |
0 |
0 |
61 558 |
294 259 |
61 558 |
|
5 |
JAMBI* |
19 401 |
0 |
0 |
19 401 |
19 733 |
0 |
0 |
19 733 |
172 338 |
0 |
0 |
172 338 |
211 472 |
172 338 |
|
6 |
SOUTH SUMATERA* |
53 159 |
0 |
0 |
53 159 |
85 091 |
0 |
0 |
85 091 |
539 153 |
0 |
0 |
539 153 |
677 403 |
539 153 |
|
7 |
BENGKULU |
45 451 |
0 |
0 |
45 451 |
12 733 |
514 |
0 |
13 247 |
18 657 |
0 |
0 |
18 657 |
77 355 |
18 657 |
|
8 |
LAMPUNG* |
122 458 |
250 |
0 |
122 708 |
20 559 |
3 601 |
0 |
24 160 |
111 506 |
94 547 |
8 100 |
214 153 |
361 021 |
214 153 |
|
9 |
KEPULAUAN BANGKA BELITUNG* |
8 240 |
0 |
0 |
8 240 |
8 595 |
0 |
0 |
8 595 |
3 108 |
0 |
0 |
3 108 |
19 943 |
3 108 |
|
10 |
WEST JAVA* |
97 339 |
6 964 |
947 |
105 250 |
64 339 |
8 720 |
0 |
73 059 |
47 701 |
114 136 |
242 523 |
404 360 |
582 669 |
405 307 |
|
11 |
CENTRAL JAVA T* |
456 069 |
21 787 |
1 189 |
479 045 |
61 553 |
25 682 |
61 |
87 296 |
131 431 |
145 885 |
49 204 |
326 520 |
892 861 |
327 770 |
|
12 |
YOGYAKARTA S.P.* |
39 382 |
4 541 |
40 |
43 964 |
14 716 |
0 |
0 |
14 716 |
0 |
5 158 |
0 |
5 158 |
63 838 |
5 198 |
|
13 |
EAST JAVA* |
434 401 |
22 271 |
537 |
457 209 |
144 833 |
20 341 |
0 |
165 174 |
142 870 |
142 094 |
0 |
284 964 |
907 347 |
285 501 |
|
14 |
BANTEN* |
87 075 |
1 359 |
0 |
88 434 |
13 673 |
5 442 |
0 |
19 115 |
14 560 |
51 104 |
0 |
65 664 |
173 213 |
65 664 |
|
15 |
BALI |
64 893 |
0 |
0 |
64 893 |
7 450 |
0 |
0 |
7 450 |
0 |
0 |
0 |
0 |
72 343 |
0 |
|
16 |
WEST NUSA TENGGARA |
82 833 |
0 |
0 |
82 833 |
56 625 |
0 |
0 |
56 625 |
33 802 |
0 |
0 |
33 802 |
173 260 |
33 802 |
|
17 |
EAST NUSA TENGGARA |
29 631 |
0 |
0 |
29 631 |
37 353 |
0 |
0 |
37 353 |
36 071 |
0 |
0 |
36 071 |
103 055 |
36 071 |
|
18 |
WEST KALIMANTAN* |
107 325 |
0 |
0 |
107 325 |
77 766 |
0 |
0 |
77 766 |
119 680 |
0 |
0 |
119 680 |
304 771 |
119 680 |
|
19 |
CENTRAL KALIMANTAN* |
71 108 |
0 |
0 |
71 108 |
99 168 |
0 |
0 |
99 168 |
68 602 |
0 |
11 531 |
80 133 |
250 409 |
80 133 |
|
20 |
SOUTH KALIMANTAN* |
120 050 |
0 |
0 |
120 050 |
93 425 |
0 |
0 |
93 425 |
115 063 |
0 |
0 |
115 063 |
328 538 |
115 063 |
|
No. |
PROVINCE |
<1 000 ha |
(1 000 to 3 000 ) ha |
>3 000 ha |
TOTAL |
Total Area > 3000 & Trans Prov. | |||||||||
|
FULLY KAB/KOTA |
TRANS KAB/KOTA |
TRANS PROV. |
TOTAL |
FULLY KAB/KOTA |
TRANS KAB/KOTA |
TRANS PROP |
TOTAL. |
FULLY KAB/KOTA |
TRANS KAB/KOTA |
TRANS PROP |
TOTAL. | ||||
|
1 |
2 |
3 |
4 |
5 |
6 |
7 |
8 |
9 |
10 |
11 |
12 |
13 |
14 |
15 |
16 = 5 + 9 + 11 + 12 + 13 |
|
21 |
EAST KALIMANTAN* |
39 891 |
0 |
0 |
39 891 |
38 766 |
0 |
0 |
38 766 |
4 000 |
0 |
0 |
4 000 |
82 657 |
4 000 |
|
22 |
NORTH SULAWESI* |
31 532 |
0 |
824 |
32 356 |
11 866 |
0 |
0 |
1 866 |
13 181 |
0 |
0 |
13 181 |
57 403 |
14 005 |
|
23 |
GORONTALO |
7 838 |
425 |
0 |
8 263 |
5 545.54 |
2 263.00 |
0 |
7 809 |
0 |
0 |
0 |
0 |
16 072 |
0 |
|
24 |
CENTRAL SULAWESI* |
52 728 |
0 |
0 |
52 728 |
34 139 |
0 |
0 |
34 139 |
17 568 |
0 |
0 |
17 568 |
104 435 |
17 568 |
|
25 |
SOUTHEAST |
27 768 |
0 |
0 |
27 768 |
32 303 |
0 |
0 |
32 303 |
22 671 |
0 |
0 |
22 671 |
82 742 |
22 671 |
|
SULAWESI* |
|||||||||||||||
|
26 |
SOUTH SULAWESI* |
227 741 |
0 |
0 |
227 741 |
99 502 |
5 016 |
0 |
104 518 |
285 032 |
51 977 |
0 |
337 009 |
669 268 |
337 009 |
|
27 |
WEST SULAWESI* |
28 210 |
0 |
5 500 |
33 710 |
2 800 |
0 |
0 |
2 800 |
40 082 |
0 |
0 |
40 082 |
76 592 |
45 582 |
|
28 |
MALUKU* |
7 499 |
0 |
0 |
7 499 |
37 157 |
0 |
0 |
37 157 |
12 500 |
0 |
0 |
12 500 |
57 156 |
12 500 |
|
29 |
NORTH MALUKU |
4 802.43 |
0 |
0 |
4 802 |
3 708.40 |
0 |
0 |
3 708 |
0 |
0 |
0 |
0 |
8 511 |
0 |
|
30 |
PAPUA |
1 700 |
0 |
0 |
1 700 |
4 700 |
0 |
0 |
4 700 |
3 450 |
0 |
0 |
3 450 |
9 850 |
3 450 |
|
TOTAL |
2 883 673 |
68 043 |
9 037 |
2 960 753 |
1 491 511 |
77 563 |
61 |
1 569 135 |
2 290 753 |
634 654 |
311 358 |
3 236 765 |
7 766 653 |
3 245 863 | |
Note: Old data (26 Jan. 2005).
* Revised data.
Central Java --> revised data need further checking; Yogyakarta --> Kab. Sleman need confirmation.
Source: Directorate of Water Resources Utility (2005).
Phalasack Pheddara2
1. Background information on large rice-based irrigation systems
Lao PDR is located in the heart of peninsular Indochina. It is located between 14 to 23 degrees north latitude and 100 to 108 degrees east longitude. It is a landlocked country and shares a 505 km border with China to the north, 435 km border with Cambodia to the south, 2 069 km border with Viet Nam to the east, a 1 835 km border with Thailand to the west, and a 236 km border with Myanmar to the northwest. The country stretches 1 700 km from north to south, with an east-west width of over 500 km at its widest point and only 140 km at the narrowest point. The Lao PDR covers a total of 236 800 square kilometres. Most of the country is mountainous and thickly forested and the Mekong River forms a large part of the western boundary with Thailand.
The government of Lao PDR began decentralizing control and encouraging private enterprise in 1986. The results, starting from an extremely low base, were striking — growth averaged 6 percent between 1988 and 2004. Agriculture accounts for half of GDP and provides 80 percent of total employment.
The economy will continue to benefit from international assistance and from new foreign investment. The major contribution from various sectors to the GDP of Lao PDR is: agriculture 49.5 percent, industry 27.5 percent, and services 23 percent (2004 estimates).
Lao PDR’s significant natural resources, proximity to large external markets, and potentially strategic position for trade are unexploited assets.
Agriculture has been a relatively dynamic sector with increases in cultivated land and yields for rice and maize as well as increasing production of cattle, pigs and chickens. Over the past twenty years paddy yields have doubled.
Lao PDR has three types of agricultural production: low land irrigated, low land non-irrigated, and upland slash and burn agriculture. The government has an explicit goal of increasing the amount of irrigated land and decreasing slash and burn agriculture. The country has many small rivers and agriculture lands are irrigated by river water.
Pumps are used to take water from rivers to the fields. The level difference of water in the river between maximum and minimum is 10 to 12 metres. Pump sets are installed in a float which requires low investment and is easy to maintain.
Rice is the predominant crop and a staple food. Principal non-rice crops include cardamom — sometimes considered a forestry product — coffee, tea, corn, cotton, fruit, mung beans, peanuts, soybeans, sugarcane, sweet potatoes, tobacco, and vegetables. The only crop produced for export in substantial quantities is coffee. The total area planted with these crops is small relative to the area planted to rice. Although the increase in part reflects the drop in rice production during the drought years, it also demonstrates some success in the government’s push toward crop diversification. Despite increasing agricultural output, however, Lao PDR is still an importer of food.
The Department of Irrigation (DOI) is under the Ministry of Agriculture. DOI is involved in developing and implementing irrigation systems in all the provinces of Lao PDR. All the existing irrigation systems in the country are implemented by DOI and were handed over to farmers’ communities for operation and management (O&M). DOI is guiding the farmers toward the effective utilization of water, based on the amount of water needed for each crop.
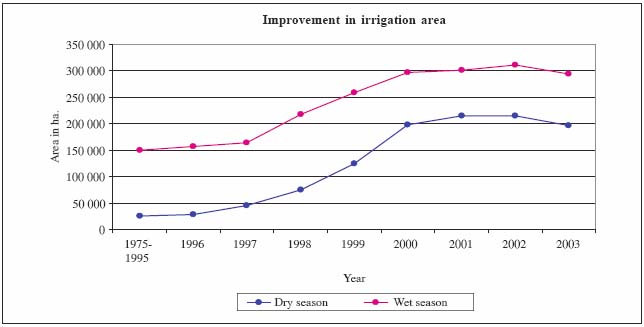
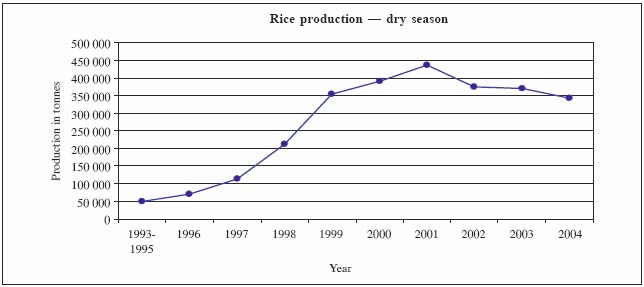
In the past, the country used to import rice from neighbouring countries to meet the domestic requirement but achieved self-sufficiency in rice production in 2000. Rice cultivation in the dry season has gone up to 436 000 tonnes from 50 000 tonnes in 1995. Dry season irrigated area has gone from 25 000 ha in 1995 up to 210 000 ha in 2002.
At present, Lao PDR has two crops in a year. Dry season crops are mainly dependent on pumping irrigation and reservoirs.
Wet season crops are mainly dependent on nature and irrigation systems are used as a supplementary source of water. Natural calamities like floods affect agriculture fields in the wet season.
The government of Lao PDR carried out major development activities from 1996 till 2000 but could not continue because of lack of funds. The government is encouraging the farmers to cultivate alternative crops after they have sufficient rice. This will help to reduce poverty and will improve the lives of the farmers.
The thematic approach to irrigation set down in the government strategy is based on the following policies:
|
(i) |
allocation and provision of water on a sustainable basis for agroforestry systems in the uplands and for existing and new agricultural areas in the lowlands; |
|
(ii) |
diversification of water resources for irrigation and management for sustainable use; |
|
(iii) |
improvement of water resource-based productivity; |
|
(iv) |
improvement of the maintenance of irrigation systems and strengthening of O&M arrangements; |
|
(v) |
maintenance of watersheds and mitigation of environmental degradation; |
|
(vi) |
alleviation of rural poverty; and |
|
(vii) |
acceleration of cash crop production for export, and for import substitution. |
The national strategy related these policies to outputs through specific strategies and programmes. The specific strategies are to:
|
(i) |
continue to focus investment on the most economically viable irrigation systems and to consolidate and expand irrigation areas; |
|
(ii) |
continue to strengthen community participation and initiative in project planning, works and maintenance; |
|
(iii) |
encourage beneficiary financing in development and in O&M of irrigation systems; |
|
(iv) |
strengthen farmer driven extension focus on cash crops, marketing and improve market access; and |
|
(v) |
target rural development on “focal sites” within watersheds/river basins. |
Programmes and priorities resulting from these strategies are:
|
(i) |
water resources use planning for sustainable irrigation development and management; |
|
(ii) |
improvement of irrigation technology through the use of various irrigation innovations; |
|
(iii) |
continued promotion of irrigation management transfer and of community managed irrigation programmes which include active participation in planning construction and O&M; and |
|
(iv) |
consolidation and expansion of training programmes for farming communities and farmers in irrigation system management in O&M, watershed preservation, and improved and diversified farming systems. |
The expected outputs identified by the national strategy are:
|
(i) |
major consolidation and expansion of community-managed small-scale irrigation systems; |
|
(ii) |
accelerated increases in upland farming systems diversification, particularly in dry season irrigated agriculture; |
|
(iii) |
full irrigation management transfer to local communities; and |
|
(iv) |
sustainable irrigation systems where management and operational costs are borne by the irrigator farmers. |
Fundamental to this national strategy for irrigation development are five national strategic plans. These plans, derived from the list of programmes outlined above focus on:
|
(i) |
water resources planning; |
|
(ii) |
irrigation technology; |
|
(iii) |
irrigation management transfer; |
|
(iv) |
community managed irrigation; and |
|
(v) |
training and extension. |
The strategy focuses on community management of irrigation, irrigation management transfer, and consolidation of past achievements. Construction of new irrigation systems will be deferred until these stated priorities are attended to.
2. Trends of agriculture development and water resources management
Lao PDR appears to have an abundance of water. This abundance, be it real or perceived, has led to a somewhat cavalier attitude to the management of the resource. While key officials are aware of the need for resource management, there are higher development priorities for the country. The people of Lao PDR do not have far to look to see the problems that arise as a result of poor management of water resources. The neighbouring Northeast region of Thailand and Yunnan Province of China are two shining examples of the need for effective resource management.
Throughout the country, river and stream behaviour is changing as catchments are deforested with resulting degradation. Silt loads, particularly in the wet season are increasing and this is creating a problem in all subsectors using surface water. Suspended matter in the water creates a greater rate of component wear on pumps and turbines and increases filtration problems in any situation requiring clean water. Sedimentation of irrigation infrastructure provides an ongoing maintenance problem in an environment where attention to maintenance is not given a high priority. This is only part of the problem resulting from catchment degradation. Apart from the obvious localized problems resulting from catchment degradation, flow in all streams from minor streams to the Mekong River are being effected with increasingly lower dry season flows being experienced over a longer period of time. Wet season flows are becoming increasingly higher, with high flows experienced over a shorter period of time. Small streams which once ran year-round, although with low dry season flows, are now drying up during the dry season.
In Lao PDR, the indiscriminant use of water continues. Gravity fed irrigation schemes are designed for a headworks requirement of 4.5 litres per second per hectare. Elsewhere in the world, the figure adopted is 1.8 litres per second per hectare. It is easier to provide more water than to control water loss as a result of poor distribution infrastructure and poor management. In urban water supplies the percentage of non-revenue water is very high. In remote villages with piped water supplies gravity fed from springs, it is common to see faucets either full on, or removed from the standpipe. The water is not entirely wasted as it is then available for duck raising and other livestock and usually ends up in a communal pond. Apart from wasting the resource, a considerable sanitation problem is created in the meantime. Hydropower systems have been designed with scant attention to downstream users, although this lack of concern appears to be changing.
Little attention has been given to the exploitation of groundwater, however this is likely to change. In line with this change, an increasing need for groundwater investigation will be necessary both to maximize investments and to protect the resource. Experience in the adjoining Northeast region of Thailand, suggests that groundwater conditions in the flat areas of the southern provinces are likely to be complex and fragile. It is most important to avoid the problems experienced in this neighbouring region of Thailand, particularly with regard to salinity and diminishing availability.
Hydropower sales to Thailand are likely to increase considerably, and sales to Viet Nam are likely to commence as Lao PDR pursues its policy of pursuing export earnings in order to boost foreign exchange. In pursuit of the same goals it is likely that the sale of water to neighbouring Thailand will soon commence. The sale of water to Thailand need not involve the physical transfer of water. Instead, a holistic view of the Mekong River flow should be considered. Under the multilateral agreement framed by the Mekong River Commission, member countries have agreed on the amounts of water that each might withdraw from the Mekong River. Instead of physically transferring water from Lao PDR to Thailand, it would be sufficient for Lao PDR to reserve a certain flow from one of its prolific southern rivers and guarantee availability of an amount of water similar to what Thailand might extract elsewhere on the Mekong. In this manner, the amount of water available downstream in Cambodia and Viet Nam would be in line with the multilateral agreement. Thailand would pay Lao PDR for the water thus reserved without the cost of expensive infrastructure to physically transfer water from one country to the other. Thailand would extract water from the Mekong close to the point of requirement.
3. New requirements for large rice-based irrigation systems
New requirements for large rice-based irrigation systems are:
4. Case Study: Nam Suang irrigation project
Location
Nam Suang irrigation project is located about 42 km from Vientiane city, which covers the cultivated area of three districts namely:
The project is bordered by the Nam Ngum River in the east and the Phouphanang mountain chain in the west.
Background/History
In order to implement the government’s policy on rice self-sufficiency the following activities have been carried out:
Storage capacity
Canals (rehabilitation needed)
Structures
Organization
Members
Headwork, main and secondary canals are under the overall management of the Nam Suang Centre for Irrigation and Agriculture Development.
Financial
Justification
Rehabilitation/improvement programme
Budget requirement
Total US$5.98 million
Expected outputs:
Information on irrigation systems in Lao PDR
National irrigation management Agency: Department of Irrigation (DOI)
|
General information on irrigation systems | ||||
|
Physical scale of rice-based irrigation systems |
<10 000 ha |
10 000 to 100 000 ha |
>100 000 ha |
All scales |
|
Number of systems |
24 000 |
0 |
0 |
24 000 |
|
Annual water diversion (MCM) |
6 200 |
0 |
0 |
6 200 |
|
% of agriculture water use |
97% |
0 |
0 |
97% |
|
% of domestic water use |
2% |
0 |
0 |
2% |
|
% of other water use |
0.5% |
0 |
0 |
0.5% |
|
Designed irrigation area (ha) |
310 000 |
0 |
0 |
310 000 |
|
Effective irrigation area (ha) |
214 000 |
0 |
0 |
214 000 |
|
Rice irrigation area (ha) |
110 000 |
0 |
0 |
110 000 |
|
Vegetable and orchard area (ha) |
80 000 |
0 |
0 |
80 000 |
|
Other crops irrigation area (ha) |
24 000 |
0 |
0 |
24 000 |
|
No. of beneficiaries — farmers |
300 000 |
0 |
0 |
300 000 |
|
No. of beneficiaries — city residents |
1 200 000 |
0 |
0 |
1 200 000 |
|
Wetland areas supported (ha) |
20 000 |
0 |
0 |
20 000 |
|
Information on the largest rice-based irrigation system | |
|
Name |
Nam Suang Irrigation Project |
|
Location |
Naxaythong District, Vientiane City |
|
Construction period |
1978–80 |
|
Designed irrigation area |
4 500 ha |
|
Functional irrigation area |
2 350 ha |
|
Annual water diversion (MCM) |
62 MCM |
|
% of agriculture water use |
98% |
|
% of domestic water use |
1% |
|
% of other water use |
1% fish pond |
|
Rice irrigation area (ha) |
2 350 |
|
Vegetable and orchard area (ha) |
50 ha |
|
Other crops irrigation area (ha) |
None |
|
water supply per ha of irrigated rice field |
DS 23 000 m3; WS 10 000 m3 |
|
Output (US$) per m3 of water supply |
12.5 |
|
No. of beneficiaries — farmers (family) |
1 340 |
|
No. of beneficiaries — city residents (family) |
3 000 |
|
Wetland areas supported (ha) |
30 |
2 Director, Operation and Maintenance Division, Department of Irrigation, Lao PDR.
Mohd Abdul Nassir Bin Bidin and Natalia Puspa Dewi3
1. Background information on large rice-based irrigation systems
Malaysia covers an area of 336 000 sq. km and is located between 1 degree and 7 degrees north latitude and 100 degrees and 119 degrees east longitude. It consists of eleven states in the peninsular part of the country and the insular states of Sabah and Sarawak, which are separated by the South China Sea in the east. The total population is about 20 million and nearly 80 percent lives in the west side of the country.
The total land used for agriculture in Malaysia is about 22 percent. Townships, mining activities and other uses take up another 10 percent, leaving 68 percent under forest cover. Half of the agriculture lands are cultivated with perennial crops. The other half is taken up by annual crops, mixed horticulture, shifting cultivation and, to a much lesser extent, fishponds.
The total physical paddy area in Malaysia is estimated to be 598 483 hectares of which 379 469 hectares are located in Peninsular Malaysia with the remaining in Sabah and Sarawak. Wet paddy constitutes 85 percent of the total paddy area in the country and the remaining 15 percent consists of non-irrigated paddy areas, which include rainfed paddy fields, hill or upland paddy concentrated mainly in Sabah and Sarawak. In Peninsular Malaysia, 76 percent of the area is provided with extensive irrigation and drainage facilities whereas only 15 percent of the area in East Malaysia is irrigated. Most of the irrigated paddy areas in Peninsular Malaysia are located in the eight designated granary areas totalling approximately 212 000 hectares.
The remaining irrigated areas comprise 924 small irrigation schemes, 74 of which cover 28 000 hectares and are classified as mini granary areas. The location of granary and mini granary areas is given in Figure 1 and Figure 2.
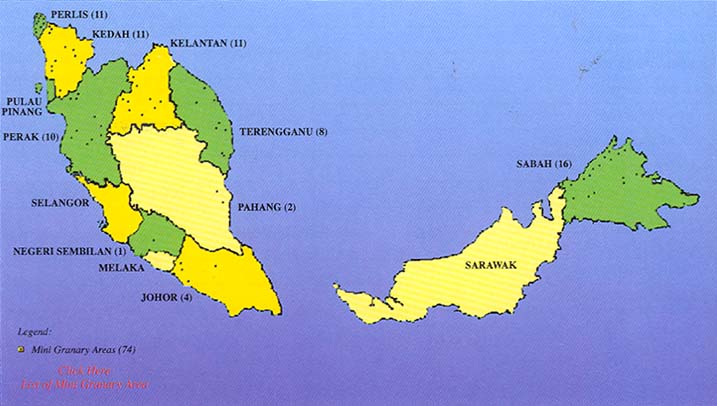
Figure 1. Granary areas in Malaysia
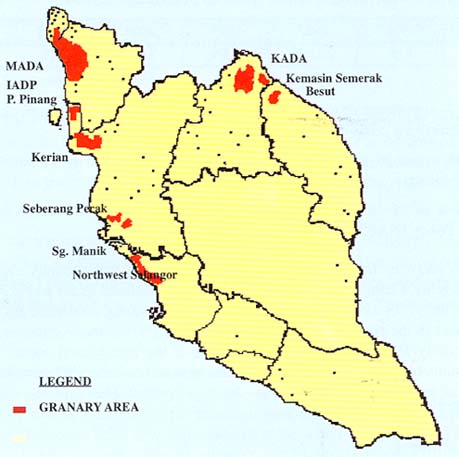
Figure 2. Mini granary areas of Malaysia
The paddy sector has been considered a strategic sector and has always been accorded special treatment by the Malaysian Government. These efforts reflected the concern of the government on issues relating to food security as well as other socio-economic considerations. As Malaysia faces a production deficit, rice is considered as a security commodity. Hence, the national policy is to maintain a prudent level of self-sufficiency at a minimum level of 65 percent.
In addition, support to the sector is justified to enhance the incomes of small paddy farmers, many of whom are poor. Government intervention is extensive — from production to distribution and marketing. Massive public investment in infrastructure development and support services is accorded to the industry. Price and fertilizer subsidies are among the various subsidies that help support the sector.
2. Trends of agriculture development and water resources management
2.1 Evolution of the agriculture sector
In the decades following independence, agriculture was the main earner for the country. The sector was the main contributor to the national economy and was the driving force behind the economic growth of the country. Agriculture was used to finance the development of the country and thus laid the foundation of its industrialization.
However, rapid industrialization during the last decade has led to the decline in the sector’s relative contribution to national income, export earnings, employment and investment. The change in the country’s economic policy brought forth issues and challenges in the agricultural sector, in particular acute labour shortages, limited availability of suitable land and the ever increasing cost of production arising from intersectoral competition for resources as well as intense competition in the global market resulting from trade liberalization.
The contribution of rice to the national economy is small and declining. The declining trend is largely a result of negligible gains in productivity, increases in production costs and decreasing profitability. Table 1 presents the contribution of agriculture sector in percentage of GDP from 1957 to 2004.
Table 1. Contribution of agriculture sector as percentage of GDP
| 1957 | 1970 | 1985 | 1995 | 2000 | 2003 | 2004 |
| 46% | 30% | 20.8% | 13.9% | 8.6% | 9.4% | 9.7% |
The agricultural sector had over those past decades contributed strongly to the country’s economy, employment, social and political stability. Changes in policy to liberalize the agricultural sector and to stress industrialization in the second half of the 1980s saw the agricultural sector facing strong disadvantages in policy terms, thus losing its attractiveness in the competition for resources. The first National Agricultural Policy (NAP) was promulgated in the early 1980s to initiate liberalization of the agricultural sector. The policy stressed productivity and sustainable growth. The emphasis then was to continue with new land development and consolidation of economic farm sizes through in situ development. However, the rapid expansion of the manufacturing sector changed the relative importance of the agricultural sector. To address the issue of productivity, efficiency and competitiveness and to build linkages with other sectors of the economy, the second NAP (NAP2, 1992–2010) was introduced. Efforts to further liberalize the agricultural sector were intensified.
The rapid and sudden changes in the domestic and international economy highlighted the flaw in the national economic policy and the NAP formulation. NAP2 (1992–2010) lacked focus on priority areas of agricultural development, a plan of action and mechanisms for its implementation. To improve competitiveness as well as to ensure continuing growth of Malaysian agriculture, NAP3 (1998–2010) was then formulated. The aim is to ensure the maximization of income of the agricultural sector through efficient and optimal utilization of existing resources. Currently, the agriculture sector has been re-entrusted as an important sector “the third engine of growth” in the national development agenda.
2.2 Recent and future challenges
The rapidly changing national and international scenarios raised new issues and challenges for further development of the agricultural sector. One of the many challenges facing the agricultural sector is to improve the efficiency and effectiveness in the utilization of resources, land, water and labour. These challenges, if not adequately addressed, will definitely affect the agricultural sector’s sustainability. There is a strong need to improve the agricultural sector delivery system all along the process and production chain. One of the functions and roles of irrigation and agricultural drainage is to bring about improvement in land, water and labour productivity.
Much of the country’s arable land has been brought under cultivation. Further agricultural development will have to be developed vertically or on land that is marginal and requires expert handling and higher development cost. Ironically, the existence of substantial idle agricultural land and abandoned holdings is still an issue. It has been and remains a great challenge to resolve land issues.
Water use efficiency requires policy, infrastructural, institutional as well as managerial interference. Although too much water is a problem for agricultural production, water scarcity on the other hand can seriously affect agricultural production. It is a challenge in itself to promote water productivity and water use efficiency in the agricultural sector unless water can be considered as an economic good, which could be a reality in the future.
The issue of labour shortages has been tormenting the agricultural sector since the second half of the 1980s. Mechanization, however, is a well-known solution to the issue of labour productivity; but after twenty years the mechanization programme is still an issue. Currently, labour productivity in agriculture is only about 60 percent of the labour productivity in the manufacturing sector. The challenge is how to bring about mechanization to the whole chain of agricultural activities in the shortest time possible.
2.3 Infrastructure investment outlook
Farm investment in the form of irrigation canals, farm roads and other on-farm infrastructure has been instrumental in changing the paddy production situation in the country. The success of double cropping has been realized predominantly by the provision of irrigation facilities. Such facilities have been responsible for the achievement of an average of 180 percent cropping intensity for the eight rice-granary areas in the country.
The development of the irrigation infrastructure has been the sole responsibility of the government, even before independence, when a substantial amount of budget was allocated for the purpose as reflected in the First and Second Malaya Plans (1956–1960 and 1961–1965). In these, about 16.8 percent and 23.2 percent, respectively of the total budget for the agricultural sector were devoted for drainage and irrigation facilities (Table 3).
Table 2. Development expenditure for drainage and irrigation
|
Malaysia Plan |
Period |
Total agriculture (RM million) |
Irrigation and drainage | |
|
Amount (RM million) |
Percentage (%) | |||
|
First Malaya Plan |
1956–1960 |
227.5 |
38.3 |
16.8 |
|
Second Malaya Plan |
1961–1965 |
467.9 |
108.5 |
23.2 |
|
First Malaysia Plan |
1966–1970 |
1 114.1 |
342.6 |
30.8 |
|
Second Malaysia Plan |
1971–1975 |
7 100.3 |
271.1 |
3.8 |
|
Third Malaysia Plan |
1976–1980 |
4 666.2 |
554.8 |
11.9 |
|
Fourth Malaysia Plan |
1981–1985 |
7 671.3 |
396.6 |
5.2 |
|
Fifth Malaysia Plan |
1986–1990 |
7 325.0 |
200.3 |
2.7 |
|
Sixth Malaysia Plan |
1991–1995 |
8 215.2 |
844.6 |
10.3 |
|
Seventh Malaysia Plan |
1996–2000 |
8 139.3 |
1 929.9 |
23.7 |
|
Eighth Malaysia Plan |
2001–2005 |
7 860.0 |
2 170.2 |
27.6 |
Source: National five-year development plans.
The pace continued in the First Malaysia Plan (1966–1970) where RM342.6 million was allocated for a similar purpose, which constituted about one third of the total agricultural development budget. It was during this period that the MADA irrigation scheme, the largest scheme in Malaysia, was constructed and completed in 1973. The allocation for drainage and irrigation was substantially reduced in the Second Malaysia Plan to the Fifth Malaysia Plan where the budget was reduced to less than 10 percent of the total for agriculture (except in the Third Malaysia Plan where it was 11.9 percent). Since the Sixth Malaysia Plan, the allocation had steadily increased to the current level of about 28 percent, an equivalent of RM2.17 billion, in the Eighth Malaysia Plan.
3. New requirements for large rice-based irrigation systems
3.1 The need for modernization
The most important factor to a sustainable agriculture sector is to remain competitive and be relevant in the context of national development. To remain competitive, the agriculture sector needs to go beyond the model of the earlier successes and must transform itself to enable an increase in its productivity as much as to match market demand in terms of quality and quantity. The agriculture sector must be transformed radically in terms of its processes, technology and culture. It must be able to quickly respond to the ever-changing needs in terms of quantity and quality while keeping pace with social and environmental needs. The immediate strategy is to modernize.
3.2 The need for irrigation infrastructural transformation
The recent trends in investment suggest that it is unlikely that the past high rates of infrastructural development for irrigated agriculture will continue. The main reason is the unfavourable economic outlook for new irrigated infrastructural projects. Rising capital costs, low returns on capital, problems of operation and maintenance, low efficiency of water use, low level of water charges and revenues, environmental impacts of dams and degradation of natural resources are reasons to suggest the slower growth for irrigated infrastructural development.
Future irrigation development will mainly be targeted at exploiting the full potential of increased cropping intensities and crop yields through rehabilitation, modernization and management review of existing irrigation systems. The main aims would be to ensure that irrigated agriculture is able to make a difference in the livelihoods of its beneficiaries through the provision of efficient delivery systems, paving opportunities for improving cost competitiveness as well as minimizing the investment risk of the sector.
3.3 The Need for technology and knowledge transformation
Knowledge and technology are the fundamentals of organizations of the future. The agricultural sector is no exception and it needs to move beyond the existing production system through a systematic process of information sharing and knowledge development. A new approach in the agricultural sector needs to be intensified and developed with concerted effort through collaborative national and international networks. Information sharing is a prerequisite in promoting efficient and quality decision-making. An effective delivery system is dependent on good decision-making, which in turn is based on quality data through a systematic information sharing mechanism. The online benchmarking information system is one good example of an information sharing mechanism.
The highest potential for change and growth in the agricultural sector is towards improving efficiency, effectiveness, quality and productivity of the sector through research and knowledge development. Knowledge in the agricultural sector is very much localized and locked within the individual farm community. The rapid appraisal process (RAP) is a knowledge development and sharing mechanism for irrigation system development.
Most of the knowledge in the agricultural sector is in the form of tacit knowledge — knowledge that is locked within the individual in the form of experience. The agriculture sector should make radical changes in its outlook towards knowledge by focusing on the process of converting tacit knowledge to explicit knowledge. The emphasis placed on tacit knowledge will give rise to a whole different view of an organization — not as a machine for processing information, but as a living organism that produces knowledge. It gives rise to a whole new view of how learning should be achieved — not only through the mind, but both body and mind.
4. Past and present measures
4.1 Performances of granary areas
Malaysia produces about 2.2 millions metric tonnes of paddy, 84 percent of which is produced in Peninsular Malaysia. The national average yield is about 3.2 metric tonne/ha, averaging 3.6 tonne/ha in Peninsular Malaysia against 1.6 metric tonne/ha and 3.2 metric tonne/ha in Sarawak and Sabah, respectively. A summary of the performance of the sector is depicted in Table 3. The eight main granaries consistently contribute about 70 percent of the national rice production. The MADA scheme on average contributes about 55 percent of total granary production, followed by KADA, Kerian-Sg. Manik and Barat Laut Selangor (each at about 10 percent), Pulau Pinang and Seberang Perak (each about 5 percent) and Besut and Kemasin Semerak (each about 1 percent).
Table 3. Planted area, production and yield of paddy, by main production area, 1985 to 2002
|
Region |
1985 |
1990 |
1995 |
2002 |
|||||||||
|
Plantedarea |
Production |
Yield |
Plantedarea |
Production |
Yield |
Plantedarea |
Production |
Yield |
Plantedarea |
Production |
Yield | ||
|
(’000 ha) |
(’000 Mt) |
(Mt/ha) |
(’000 ha) |
(’000 Mt) |
(Mt/ha) |
(’000 ha) |
(’000 Mt) |
(Mt /ha) |
(’000 ha) |
(’000 Mt) |
(Mt/ha) | ||
|
Peninsular Malaysia |
|||||||||||||
|
Main granary |
336.8 |
1 122.4 |
3.33 |
373.6 |
1 297.9 |
3.47 |
383.1 |
1 527.7 |
3.99 |
382.4 |
1 492.8 |
3.90 | |
|
• MADA |
186.1 |
701.0 |
3.77 |
189.7 |
724.9 |
3.82 |
193.8 |
862.2 |
4.45 |
192.5 |
820.3 |
4.26 | |
|
• KADA |
37.9 |
108.2 |
2.85 |
46.3 |
163.7 |
3.54 |
51.7 |
181.2 |
3.50 |
47.2 |
121.4 |
2.58 | |
|
• Kerian-Sg. Manik |
47.2 |
144.1 |
3.05 |
51.1 |
128.7 |
2.51 |
48.6 |
163.0 |
3.35 |
56.8 |
174.2 |
3.07 | |
|
• Barat Laut Selangor |
34.2 |
97.4 |
2.85 |
35.7 |
142.0 |
3.98 |
35.6 |
146.7 |
4.12 |
37.2 |
177.1 |
4.76 | |
|
• Pulau Pinang |
16.0 |
31.7 |
1.98 |
21.8 |
35.9 |
1.65 |
19.3 |
62.7 |
3.25 |
17.4 |
80.04 |
4.60 | |
|
• Seberang Perak |
9.4 |
20.5 |
2.18 |
17.1 |
70.5 |
4.12 |
17.1 |
56.9 |
3.33 |
16.7 |
74.5 |
4.46 | |
|
• Ketara |
6.0 |
19.5 |
3.25 |
8.0 |
25.5 |
3.19 |
9.5 |
35.3 |
3.71 |
10.2 |
38.8 |
3.80 | |
|
• Kemasin Semerak |
– |
– |
– |
3.9 |
6.5 |
1.67 |
7.5 |
19.7 |
2.63 |
4.4 |
6.4 |
1.47 | |
|
The rest |
118.9 |
332.4 |
2.80 |
120.4 |
326.9 |
2.72 |
113.4 |
310.6 |
2.74 |
126.3 |
359.2 |
2.84 | |
|
Sub total |
455.7 |
1 454.6 |
3.13 |
494 |
1 624.6 |
3.29 |
496.5 |
1 838.3 |
3.70 |
508.7 |
1 852.0 |
3.64 | |
|
Sabah |
38.0 |
79.1 |
2.08 |
54.8 |
94.8 |
1.73 |
53.1 |
143.5 |
2.70 |
42.7 |
137.0 |
3.21 | |
|
Sarawak |
161.2 |
211.7 |
1.31 |
131.8 |
165.6 |
1.26 |
123.1 |
145.4 |
1.18 |
127.1 |
208.4 |
1.64 | |
|
Malaysia |
654.9 |
1 745.4 |
2.67 |
680.6 |
1 885.0 |
2.77 |
672.7 |
2 127.4 |
3.16 |
678.5 |
2 197.4 |
3.24 | |
In Malaysia, designating paddy production areas is one of the major strategies to enhance rice production. The eight granary areas comprise MADA, KADA, Kerian, Barat Laut, Seberang Perai, Seberang Perak, Ketara and Kemasin Semerak. These areas have been designated as permanent paddy producing areas to realize a minimum self-sufficiency level for rice of 65 percent. Currently they cover only 36 percent of the total physical paddy land but constitute 57 per cent of the total area planted and produce 72 percent of the total national rice production.
MADA is the largest rice granary area in Malaysia. Thus, the performance of MADA is extremely important as it influences the overall performance of the rice industry. During the 1982–2002 period, the planted area remained almost constant, between 96 000 to 97 000 ha for both the main and off-season. Average main season paddy yield fluctuated but was about 4 tonne/ha for most of the production periods. The growth rates in production were 1.9 percent and 4.6 percent per annum for the main and off-season respectively. However, the bulk of the growth was registered during the 1982–1990 period, against the more recent 1991–2002 period. In fact, in the main season of the period 1991–2002, there was negative growth, brought about by similar negative growth in planted area and productivity. The planted area grew by less than 1 percent for both seasons, with lower growth in the 1991–2002 period. Nevertheless, as a whole MADA could still be considered as a stable rice granary area. An overall negative growth in the main season is a cause of great concern though. Overall, the performance in the 1982–1990 period was better than that in the 1991–2002 period.
Past national agricultural policies (NAP) introduced various strategies to ensure sustainability of the paddy and rice industry. The current NAP3 (1998–2010) calls for the gradual but effective transformation of agriculture and includes measures to promote efficiency, competitiveness, and sustainability throughout the food value chain within the socio-political framework. For the paddy sector, the NAP3 outlines six major strategic thrusts toward ensuring the competitiveness of the rice industry. First is rationalizing resource use by designating the eight granary areas as permanent paddy producing areas. Commercial paddy production by the private sector will be promoted, especially in Sabah and Sarawak. Increasing efficiency and productivity is heavily emphasized. To ensure a competitive return from rice farming, large production units are supported.
4.2 Irrigation modernization
Irrigation modernization is an important step in Malaysia’s next major effort towards upgrading irrigation services in the country. Under the Seventh Malaysia Plan, an irrigation modernization programme has been formally established, aiming at further improvement to the irrigation infrastructure, but addressing at the same time other aspects (managerial, institutional and technological development) that would support the targeted rice production with good stewardship over resource inputs including water, labour, finance and the environment. It is recognized that much effort is needed at farm level with respect to infield improvement, water delivery and management with higher precision, improved agricultural practices in crop varieties, seeding rate and fertilizer input, workability of farm machinery, farmers’ organization and involvement, farm management efficiency, and pest, disease and weed control that are effective and environmentally friendly, etc.
In line with the policy of confining the future thrust in rice production to the eight designated granary areas, the irrigation modernization programme is focused on these areas. The irrigation modernization programme, especially the water management aspect, is geared towards improving the timeliness of activities and improved management productivity. The following key areas for improvement were studied and respective improvement plans formulated:
| a) |
system infrastructure improvement; |
| b) |
infield infrastructure improvement; |
| c) |
water management improvement; |
| d) |
land consolidation; |
| e) |
acceleration of mechanized farming; |
| f) |
improvement of agriculture (farming practices); |
| g) |
strengthening of farmers’ organizations; and |
| h) |
environmental management. |
Each of these is elaborated on in the following sections.
4.2.1 System infrastructure improvement
The improvement plan for system infrastructure aims at ensuring adequacy in irrigation and drainage facilities in terms of capacity, delivery and drainage efficiencies and water control. Lining of canals and additional regulators are proposed. Drainage facilities have to be provided to improve machine workability. To facilitate modern mechanized farming, farm roads need to be upgraded, especially along tertiary canals.
4.2.2 Infield infrastructure improvement
Direct seeding is the way forward for paddy production in Malaysia and to support this the infield conditions must be able to facilitate good water level control and even distributions and timeliness of water application. It also should facilitate effective weed control. The infield infrastructure development comprises land leveling and construction of infield channels and control boxes. This will be a combined effort between the Department of Agriculture DOA (40 percent) and the private sector (60 percent). The Areal Farmers Organization (AFO) will be encouraged to undertake the work. Infield channel density target is 150 m/ha and two control boxes are proposed for each consolidated plot.
4.2.3 Modernization of water management system
The proposed water management system is being planned and will be operated with the aid of computers. Water level data for main and secondary canals together with rainfall data will be collected with telemetric facilities. A crop water requirement/water balance/hydrological model will be used to determine the amount of water available, required and being distributed.
4.2.4 Irrigation water management system (IWMS) and irrigation monitoring and feedback system (IMFS)
The IWMS is a computer model determining daily irrigation requirement and distribution and aims at effective use of irrigation water, better water management to support higher paddy production, as well as cost saving and labour saving in operation and management. It is proposed that the IMFS be integrated into the control station for each granary and so as to provide updated information on irrigation status and progress of farm activities so that the farmers can respond in good time to take the necessary preparatory steps and adhere to schedules. The system will also provide useful information to the O&M and agriculture extension field staff.
4.2.5 Irrigation performance assessment
As part of the operation of the modernized water management system, a standardized irrigation performance assessment is to be conducted based on three performance indicators namely relative water supply (RWS), cropping intensity (CI) and water productivity index (WPI). The proposed targets are: RWS at 1.65 (equivalent to 60 percent irrigation efficiency), CI at 190 percent, and WPI between 0.3 and 0.5 kg/m3.
4.2.6 Land consolidation
Land consolidation aims at integrating adjacent lots to form one larger operating plot of 3 to 5 ha each through removal of field bunds. The proposed land consolidation requires intensive promotion to get the consensus of the land owners. Ideally, it should be performed concurrently with the infield infrastructure development works.
4.2.7 Acceleration of mechanical farming
Previously, major farming works such as the land preparation, harvesting and transportation were carried out rather efficiently using agricultural machines. However, other farming works like seeding, and fertilizer and chemical applications were mostly done manually or with “walking” machines. Such work efficiency is low and it is labour intensive and more costly. The recommended farm mechanization system for land preparation both for wet seeding and dry seeding is tractor plus rotavator.
4.2.8 Agriculture improvement
Cropping intensity
The granary areas have the potential for supporting paddy plant growth with a high yield of about 5 to 6 tonne/ha. In order to attain a stable double cropping with 190 percent cropping intensity, adherence to cropping schedule is important and water resources adequacy is crucial to meet this requirement.
Farming practices
Farm operations need to be practised in an optimal manner. This includes the land preparation method and procedure, amount and timing of fertilizer application, seeding rate, and weed, pest and disease control methodology. Precision water management is needed to maximize effectiveness of the above. The IMFS should serve well for smooth farming operations.
4.2.9 Strengthening of farmers’ organization
Farmers’ groupings are based on social/cultural background and are not that suitable for efficient operation of the irrigation water management system. Research confirmed the intended move by the Division of Irrigation and Agricultural Drainage and other agriculture agencies to reorganize the farmers according to irrigation system boundary. The main purpose of the reorganized farmers’ groups, now widely referred to as water users groups (WUGs), is to implement proper water management in their respective areas. At the same time, the WUGs will also serve other farming functions such as farm mechanization, fertilizer management, pest/disease and weed control, and marketing. Farmers’ understanding and cooperation are required for successful WUG development, and this plan should be implemented with seminars and training programmes using the facilities of the National Water Management Board.
4.2.10 Environmental management
Adverse impact on water quality in adjacent waterways is identified as the most critical environmental issue of the granary development. Therefore, a water quality monitoring system should be established to check the quality of drainage water from the paddy fields. Water sampling should be carried out in main drains in each granary area, and at pumping stations which recycle water for irrigation. When any excessive use of agrochemicals is detected, appropriate management actions must be administered immediately. The integrated pest management (IPM) of the Department of Agriculture promotes use of biological agents to control pests and weeds in agricultural practices as well as effective use of pesticides with readily decomposable chemicals.
4.3 Precision farming
Precision farming is currently generating interest in the rice granary areas after the successful application of micro-irrigation technology. In rice cultivation, precision farming also has the similar aim of applying the right amount of irrigation water at the right time and place. This indefinitely enhances the use of information technology in future irrigation water management and agricultural practices. Some examples of precision farming application in rice cultivation are soil and water mapping, yield prediction, evapotranspiration estimation using satellite data and GIS with the automation of water control and measurement facilities.
5. Further options to respond to the changing requirements
Radical structural transformation
The agricultural sector has to face many forces and challenges: political, social, technological, economic and, in the larger context, environmental forces. The performance of the agricultural sector greatly depends on its willingness and ability to cope with the changing environment. It must be able to change and adapt to the needs and demands of these forces with speed and agility.
In this respect, the agricultural sector must improve its system’s flexibility, accountability and efficiency. That would then generate a system that would be effective and productive. This will in turn ensure quality and encourage investment. The way forward is to restructure the working mechanism in order to improve the delivery systems. Currently, the system is too heavy and bulky, making it inflexible, lacking in focus and slow in responding to changes. There are far too many agencies in the decision-making process and far too many levels to negotiate before a decision can be implemented. Utilization of resources is as a consequence inefficient and ineffective. There is a strong need to involve the beneficiaries in the decision-making mechanism as in the case of the involvement of WUGs in irrigation management.
The agricultural sector must undergo a radical transformation of the whole organizational structure in order to improve its delivery system. Recently, some restructuring was carried out but was not radical enough. In fact, to a certain degree, it further reinforced the old bureaucratic system. The latest restructuring, which involved the shifting of the Department of Irrigation and Drainage to another ministry and changing the name of the ministry to the Ministry of Agriculture and Agro-based Industries, is the kind of radical change needed by the agricultural sector to make it more focused.
Radical cultural and identity transformation
The agricultural sector has been recognized widely for its culture of subsidy, as the “poor man’s sector”, as being “traditional”, “dirty”, “rural”, “inefficient”, the “sunset industry”. These negative stereotypes must go.
Cultural and identity transformation is definitely tough to achieve but could be most effective if successfully carried out. It requires a change of mind-set and effort from all parties. The way forward is to transform from within, meaning the people involved in the sector must be committed and proud to be involved in the agricultural industry. There is a need to promote a new image, which will gradually remove the old negative stereotype. A drive for a sector that is modern, productive, efficient, knowledge based with a slogan of “we feed the world” is just an example that can be taken up to start the change.
6. Conclusions
To remain competitive and relevant in the context of national development, the agriculture sector must transform itself to enable an increase in its productivity as much as to match market demand in terms of quality and quantity. In the current global environment, there is a need to go beyond the model of the earlier successes. The agriculture sector must be transformed radically in terms of its structure, processes, technology and culture, becoming a sector that is more customer focused, process centred, output driven and knowledge based.
Information on irrigation systems of Malaysia
National irrigation management agency: Irrigation and Agricultural Drainage Division
|
General information on irrigation systems | ||||
|
Physical scale of rice-based irrigation systems |
<10 000 ha |
10 000 to 100 000 ha |
>100 000 ha |
All scales |
|
Number of systems |
4 |
4 |
– |
8 |
|
Annual water diversion (MCM) |
892 |
2 897 |
– |
3 789 |
|
% of agriculture water use |
95 |
95 |
– |
95 |
|
% of domestic water use |
5 |
5 |
– |
5 |
|
% of other water use |
– |
– |
– |
– |
|
Designed irrigation area (ha) |
30 599 |
175 806 |
– |
206 405 |
|
Effective irrigation area (ha) |
26 624 |
165 999 |
– |
192 623 |
|
Rice irrigation area (ha) |
26 624 |
165 999 |
– |
192 623 |
|
Vegetable and orchard area (ha) |
– |
– |
– |
– |
|
Other crops irrigation area (ha) |
– |
– |
– |
– |
|
No. of beneficiaries — farmers |
24 577 |
186 875 |
– |
211 452 |
|
No. of beneficiaries — city residents |
nil |
nil |
– |
nil |
|
Wetland areas supported (ha) |
nil |
80 000 |
– |
80 000 |
|
Information of the largest rice-based irrigation system | |
|
Name |
Muda irrigation project (MADA) |
|
Location |
State of Perlis and Kedah, Malaysia |
|
Construction period |
1965–1990 |
|
Designed irrigation area |
97 257 |
|
Functional irrigation area |
96 474 |
|
Annual water diversion (MCM) |
908 |
|
% of agriculture water use |
95 |
|
% of domestic water use |
5 |
|
% of other water use |
– |
|
Rice irrigation area (ha) |
96 474 |
|
Vegetable and orchard area (ha) |
– |
|
Other crops irrigation area (ha) |
– |
|
water supply per ha of irrigated rice field* |
4 703 m3 |
|
Output (US$) per m3 of water supply |
0.154 |
|
No. of beneficiaries — farmers |
100 000 |
|
No. of beneficiaries — city residents |
nil |
|
Wetland areas supported (ha) |
nil |
References
Ghazalli, M.A. & Nassir bin Bidin, M.A. 2005. Malaysian agricultural sector as the 3rd engine of growth — The irrigation perspective. Second Southeast Asia Water Forum, Bali, Indonesia. August 29–September 3, 2005.
Government of Malaysia. 1996. Rancangan Malaysia keenam 1996–2000, Jabatan Percetakan Negara, Kuala Lumpur (Sixth Malaysia Plan 1996–2000).
Keat, I.T.S. 2000. Irrigation modernization in Malaysia. Department of Irrigation and Drainage, Ministry of Agriculture. Kuala Lumpur.
Ministry of Agriculture. 1998. Third national agricultural policy (1998–2010). Ministry of Agriculture, Kuala Lumpur.
Ministry of Agriculture. 2004a. Agriculture statistical handbook, 2004. Ministry of Agriculture, Kuala Lumpur.
Ministry of Agriculture. 2004b. The review of paddy and rice industry in Malaysia, Kuala Lumpur.
3 Ministry of Agriculture and Agro-based Industry Malaysia. Wisma Tani, Lot. 4G1, Presint 4, Level 4, Pusat Pentadbiran Kerajaan Persekutuan, 62624 Putra Jaya, Malaysia.
Maung Maung Naing4
1. Introduction
Agricultural development is given priority in Myanmar’s socio-economic development as it is seen as essential in its own right and as the basis of the other sectors of the economy. The agriculture sector contributes 43 percent of GDP; 41 percent of export earnings; and employs 63 percent of the labour force.
The population in Myanmar reached 53 million in 2003. It has an annual population growth rate of 2.02 percent and it is estimated that it will reach 61 million by 2010 and 86 million by 2025. More and more food will be necessary for the country’s growing population. Rice is the main food for the people of Myanmar and it is also a principle crop in the agriculture sector. Thus, the Ministry of Agriculture and Irrigation (MOAI) has laid down the objective to achieve a surplus in paddy production so as to meet the needs of the country. Other objectives are to achieve self-sufficiency in edible oil and to set up the production of exportable pulses and industrial crops.
In this connection, irrigation plays a major role in the development of Myanmar’s agriculture sector. Small and medium scale irrigation projects have been constructed throughout the country, especially for year-round cultivation of paddy and in conjunction with other crops. These irrigation systems can improve the traditional farming practices and can adjust to the local hydrological characteristics. Furthermore, they can also contribute to the rural environment, rural life, biodiversity and the recycling of energy functions.
2. Resources
2.1 Potential land for cultivation
The total area of Myanmar is 67.71 million hectares and an area of only about 10 million hectares is cultivated for paddy and other crops. Myanmar has great potential to extend its cultivated area with few adverse environmental consequences by using cultivable waste lands that still cover about eight million hectares.
2.2 WaterMyanmar has three distinct seasons: the rainy season, the hot (summer) season and the cold (winter) season. Ninety percent of the annual rainfall in different regions of Myanmar is received during the rainy season from May to October. Precipitation varies countrywide (Table 1).
Table 1. Rainfall distribution in Myanmar
|
Region |
Annual rainfall (mm) |
|
1. South and western coastal strip |
5 000 |
| 2. Delta | 2 000–3 000 |
|
3. North and eastern hilly regions |
1 300–3 000 |
|
4. Central dry zone |
760 |
Myanmar has an abundance of high potential water resources. The drainage area is spread widely over the country endowing it with an annual water volume of 1 082 cubic kilometres flowing in its many rivers. The Ayeyarwady River and its tributaries such as the Chindwin, Mu, Panlaung, Zawgyi, Myitnge, Mone, Man, Salin and the Sittoung River and its distributaries of the Bago and others rivulets mainly contribute water to the agriculture sector, especially for paddy irrigation. In addition, a large potential groundwater resource is found in the Ayeyarwady River Basin and could be very useful for irrigating agriculture (Table 2).
Table 2. Potential water resources in Myanmar
|
River basins |
Surface water |
Groundwater | ||
|
(km3) |
(%) |
(km3) |
(%) | |
|
Ayeyarwady River Basin |
455.13 |
42.07 |
303.42 |
61.33 |
|
Sittoung River Basin |
81.15 |
7.50 |
28.40 |
5.74 |
|
Other River Basins |
545.61 |
50.43 |
162.89 |
32.93 |
| Total |
1 081.89 |
100.00 |
494.71 |
100.00 |
3. Paddy fields and irrigation systems
Myanmar’s paddy fields can be found mostly in the delta and central dry zone areas (Figure 1). About 60 percent of the delta region, including the Ayeyarwady, Bago and Yangon region of Lower Myanmar, is cultivated with rainfed paddy. Irrigated paddy is cultivated mainly in the Mandalay, Sagaing and Magway regions which are located in the central dry zone of Myanmar.
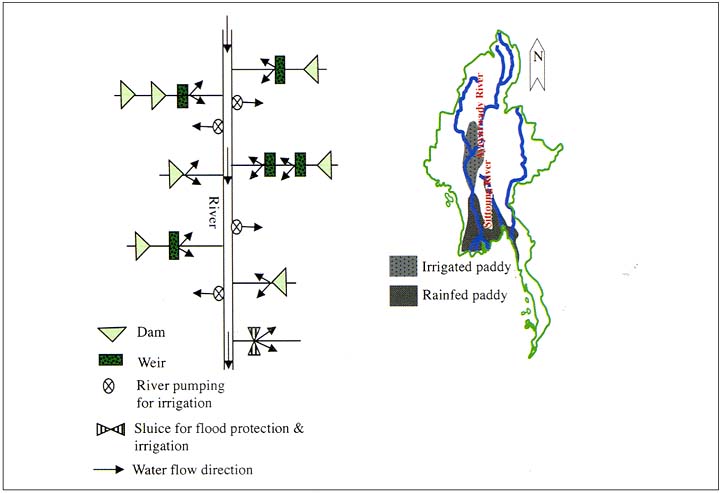
Figure 1. Paddy fields and irrigation systems in the Ayeyarwady and Sittoung River Basins
Different type of irrigation systems and projects were developed mostly along the two major river basins (Figure 1) and are connected to where the paddy field is located. The Irrigation Department, a governmental organization established to coordinate the development and management of water resources for irrigation, has constructed about 200 irrigation projects which are of dam, weir and sluice types. A surface water runoff of about 15 460 million cubic metre (MCM) has been stored in the constructed reservoirs and can irrigate an area of about 1 million hectares (Figure 2).
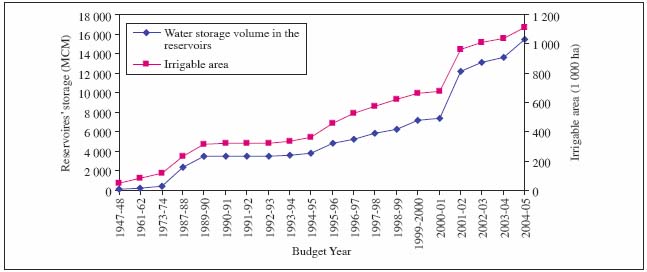
Figure 2. Annual progress of water storage in the reservoirs and irrigable area
Various groundwater and river pumping projects have been implemented by the Water Resources Utilization Department for crop irrigation and rural drinking water.
4. Water consumption
A total water volume of about 3 200 MCM comprising both surface water (91 percent) and groundwater (9 percent) was used to meet the demand for irrigation, domestic and industrial water supplies (Figure 3). Water consumption is divided among the agriculture sector (89 percent), the domestic sector (10 percent) and the industrial sector (1 percent). Groundwater is mostly used for domestic purposes.
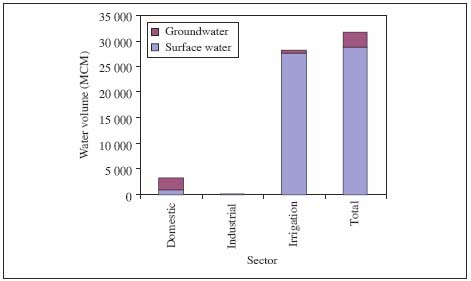
Figure 3. Water consumption in the different sectors of Myanmar, 2001
5. Production of crops using the irrigation systems
The irrigation projects in Myanmar mainly supply water for paddy cultivation. Paddy production has been increased by dry season paddy cultivation, which has followed rainy season paddy cultivation since 1992. Paddy is currently cultivated under a total area of 6.48 million hectares, comprising 4.86 million hectares in the rainy season and 1.62 million hectares in the dry season. Supplemental irrigation is supplied for the rainy season paddy cultivation in the central dry zone, where the rainfall is not sufficient for the crop water requirement. Other upland crops are cultivated there in the dry season also using irrigation. The dry season paddy is mostly cultivated in Lower Myanmar using irrigation. Thus, crop production is being increased by the irrigation projects. Cultivation of paddy has increased from 4.78 million hectares in 1988 to 6.54 million hectares in 2003 (Figure 4). The production has also increased from 12.96 million tonnes to 22.79 million tonnes over the same period. Thus, rice exports have increased to 1 million tonnes in 2004. In accordance with national planning targets, the sown area of paddy will be expanded to a total area of 7.29 million hectares with the further expansion of 0.81 million hectares in the rainy season. To generate increasing production of paddy, high yielding varieties are being grown, including the introduction of hybrid rice varieties.
Among other upland crops, pulses and oilseed crops are also major crops in Myanmar and they participate in the main cropping pattern of the irrigation projects along with paddy. Pulses are cultivated for export and the cost of cultivation is relatively inexpensive. As a result of the increasing demand for domestic consumption and export, the cultivation of pulses has increased substantially from 0.73 million hectares in 1988 to 3.31 million hectares in 2003 and the production has also increased from 0.5 million tonnes to 3 million tonnes over the same period (Figure 5). Around one million tonnes of pulses are now being exported. The major oilseed crops are groundnut, sesame and sunflower and cultivation of these crops increased to 2.78 million hectares in 2003.
|
Figure 4. Sown area and production of paddy |
Figure 5. Sown area and production of pulses |
6. Operation and maintenance
6.1 Management of the facilities
The Irrigation Department mainly maintains and operates the facilities such as main dams, headworks, main canals and secondary units. The farmers have to maintain and operate the terminal units such as field ditches and watercourses.
6.2 Water tariffs
The water tariff in the gravity dam irrigation systems of the Irrigation Department is very cheap for irrigation and it does not recover the cost for the maintenance work. The annual budget for the maintenance and repair of the facilities is mostly paid by the government (Table 3).
However, the water tariff in the river pumping systems of the Water Resources Utilization Department is higher than that of the dam projects (Table 3). The water prices for paddy cultivation of the dam systems are 150 and 300 times less than those of the electric and diesel types of river pumping systems, respectively (Table 4). As a result of the lower water price being less of a burden, the farmers use water without caring about water shortages or water losses.
Table 3. Ratio of the maintenance cost of the irrigation facilities between the government and farmers
|
Budget year |
Government’s subsidy (%) |
Farmers’ contribution (%) |
|
1993 |
95.24 |
4.76 |
|
1994 |
96.32 |
3.68 |
|
1996 |
95.27 |
4.73 |
|
1998 |
97.28 |
2.72 |
|
1999 |
97.6 |
2.40 |
|
2000 |
97.68 |
2.32 |
Table 4. Difference of irrigation tariff among the systems (ratio)
|
Crops |
Dam systems |
River pumping systems | |
|
(Electric type) |
(Diesel type) | ||
| Paddy |
1 |
150 |
300 |
| Other crops |
1 |
75 |
150 |
6.3 Farmer participation and water user associations
Water users associations (WUAs) and water users groups (WUGs) fundamentally play an important role in water management. However, the functional associations and groups are more useful for implementing irrigation works. WUGs have been established in the projects under the guidelines of the Irrigation Department. These are organized only for terminal units and they do not function well. Integrated systems have been organized too, but they do not function well either.
In some of the projects the farmers improve the terminal units such as watercourses and field ditches. And maintenance works are performed differently even in the same projects. In the Ngamoeyeik Project, the farmers are all equally involved in creating a maintenance fund when before the irrigation season they meet to determine and collect maintenance fees based on acreage. That fund is used for their terminal units. In the Swa Chaung Project, farmers have to repair and maintain that portion of the watercourse connected to their areas. Generally, WUGs and WUAs organized in Myanmar still do not function well and they need to be modified and good water management needs to be promoted.
6.4 Multipurpose water resources management
In conjunction with paddy irrigation, the isolated and multireservoir system projects have been constructed for multipurposes: water supply for hydroelectric power generation, domestic use and environmental conservation. As the project includes multisite reservoirs, different river basins and multiwater user sectors, it becomes a complex system (Table 5). The operation and management of its water supply is also complicated.
Conventional practice is currently adopted for water supply in the simple water resources projects. However, a complex solution for operation and management of the multipurpose and multireservoirs system projects is a major issue for the Irrigation Department and other related agencies. Such a complex solution requires much greater engineering and technical sophistication than do traditional and conventional practices. Thus, to be able to achieve efficient water use and good water productivity, the project engineers and water managers have to adopt more appropriate ways for operation and management.
Table 5. Characteristics of water resources projects in Myanmar
|
Project type |
Single/multisite |
River basin |
Water supply |
Operation and Management |
|
1) Isolated reservoir and single purpose |
Single site |
same |
Single purpose |
Simple |
|
2) Isolated reservoir and multipurpose |
Single site |
same |
Multipurpose |
Not simple |
|
3) Multiple-reservoirs and multipurpose |
Multisite |
same |
Multipurpose |
Complex |
|
4) Multiple-reservoirs and multipurpose |
Multisite |
different |
Multipurpose |
More complex |
7. Competition and stress
7.1 Cropping pattern
The agriculture service has proposed a multicropping pattern in the projects to increase productivity and raise farm and family incomes through improving farming on the basis of irrigation. Different kinds of cropping patterns, including rainfed and irrigated paddy, rainfed with supplementary irrigation, irrigated upland crops such as pulses and oilseed crops, are being cultivated in the projects. The proposed cropping pattern for the Ngamoeyeik Project is presented in Table 6 and includes multicrops of different varieties and over different periods within the system. Thus, complex adjustment of social, biophysical and economic factors is required. However, the possibilities of water security for these purposes should be considered from the viewpoint of hydrological characteristics also. If water supply for the other sectors is considered for the multipurpose projects, such a condition needs to be carefully adjusted in terms of both technical and institutional possibilities.
Table 6. Proposed cropping patterns and calendar in the Ngamoeyeik Project, Lower Myanmar to increase farm incomes
|
Cropping pattern |
Cropping calendar | ||
|
First crop |
Second crop |
Third crop | |
|
1) rice-food legume-rice |
Rainy season rice (130–135 days varieties) mid-May to mid-October |
Black gram (70 days varieties) mid-September to November (Relay) |
Dry season rice (130–135 days varieties) mid-December to March (Transplanting) |
|
2) rice-food legume-rice |
Rainy season rice (115–120 days varieties) mid-May to mid-September |
Black gram (70 days varieties) 4th wk September to 1st December (Tillage) |
Dry season rice (100–105 days varieties) mid-December to March (Direct seeding) |
|
3) rice-food legume-oilseed |
Rainy season rice (115–120 days varieties) June to mid-October |
Green gram (70 days varieties) mid-October to December |
Sesame (70–80 days varieties) second week January to first week April |
| 4) rice-rice |
Rainy season rice(130–135 days varieties) June to October |
Dry season rice (115–120 days varieties) mid-November to March (Direct seeding) |
– |
7.2 Labour force
The continuous cultivation of paddy and other crops in Myanmar leads to agriculture labour force shortages. Land preparation, transplanting and harvesting, unlike in a traditional farming system, need to be finished in a short period of time so that the cropping seasons allow year-round cultivation. Thus, the farmers are faced with labour shortages, especially for these periods and have no time to rest. Only 30 percent of farmers utilize tractors for land preparation.
7.3 Investment
Because of the continuous irrigation for double or triple cropping, the paddy fields are less fertile and more fertilizer has to be used to get a good yield. Thus, most farmers have problems with the high investment needed for fertilizers. On the other hand, the rice price always falls when the paddy is harvested. The farmers cannot wait until the price rises again and they have to sell their paddy to be able to invest in the next crop. It is a serious problem, especially for farmers with no off-farm job. To address this, a suitable marketing and trade system should be introduced for the farmers.
8. New requirements
8.1 Facilities
The downstream irrigation facilities in the existing projects have to be developed to promote agriculture production and efficient water uses. The main canals should be rehabilitated for sufficient water supply in these specific periods when it is required. Off-farm facilities such as watercourses, field ditches, land consolidation and a proper irrigation and drainage network for farm productivity should also be developed. From the viewpoint of future farm mechanization, a reasonable plot size should be consolidated for workability and good water control. At the same time, ecological and environmental aspects also should be considered together with paddy irrigation improvement.
8.2. Technical subjects
Based on traditional and conventional techniques, the operation and management of the facilities must be technically improved to achieve the objectives of the sectors in the projects. The systems should be closely monitored and evaluated for future development. The better modified techniques should replace the old ones.
8.3 Institutional subjects
Water user associations, farmer organizations and water user groups should be recognized and modified to establish well-organized and functional groups. The related sectors should train farmers so that they have basic knowledge of relevant subjects such as rice sciences, hydraulics and hydrology and other institutional knowledge.
8.4 Water pricing
To reduce the government’s burden on the operation and maintenance, the participation of farmers should be improved and irrigation tariffs should be increased up to a reasonable price. Rules, regulations and principles should be improved to ensure equitable and efficient water use and allocation.
9. Improvement of water management techniques
The Irrigation Department has implemented the Irrigation Technology Center (ITC) Project (Phase-II) in cooperation with the Japan International Cooperation Agency (JICA) for improvement of water management to foster better paddy production. The main components are off-farm and on-farm facilities development, monitoring and evaluation processes for operation and distribution planning, and conducting water management training. As for irrigation and drainage development, the model farmlands for intensive and extensive types of farming have been consolidated in the Ngamoeyeik Project, and these demonstrate to the farmers and local staff how important water management is for better farm productivity.
9.1 Reservoir operation and system water distribution plan
Based on the practice of water distribution and use in the project, the irrigation system has been developed for more reasonable and efficient operation. A main consideration is to formulate an annual water distribution plan for irrigation, and then to implement this. At the implementation stage, if it is necessary, a periodically revised plan can be used in accordance with the ground conditions such as water availability in the reservoir, canal-wise actual irrigated area, working progress at the planting stage and on-farm level water use. Water distribution should be monitored and evaluated throughout the season and all sectors should be involved in the development work.
9.2. On-farm level water management development
Water management at on-farm level or plot level has a direct relationship with water productivity. To have higher water productivity a farm needs to have reasonable water operation facilities such as irrigation and drainage canals and control shutter gates at these canals for water regulation. Two types of model farmland were consolidated within the project area to study on-farm level water management development. The first is an intensive type, and it has an area of 25 ha including nine farmers, and the second is an extensive type with an area of 134 ha including 38 farmers.
A plot-to-plot traditional irrigation system is demonstrated in the extensive model farmland (Figure 6a). It includes only a main drain system for a group of plots or watercourses. However, it has a reasonable watercourse density for water distribution. According to topographical conditions, watercourses were constructed at intervals of 100 m, 200 m, 300 m and 400 m. A modern irrigation system is set up in the intensive model farmland (Figure 6b), and water can be controlled at any depth for any plot whenever it is necessary. It has a high density of watercourse and drainage canals for water management.
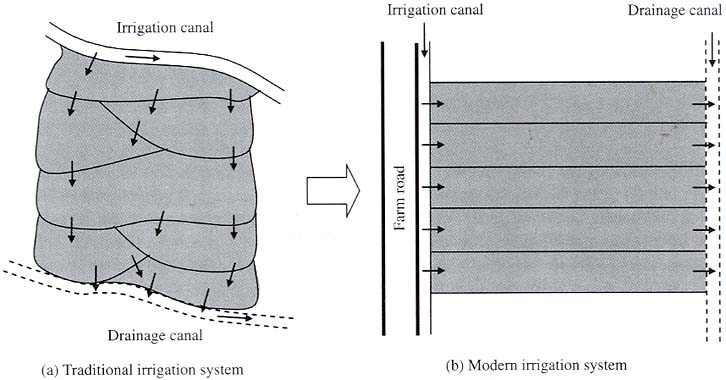
Figure 6. On-farm level water distribution systems: (a) Traditional irrigation system, (b) Modern irrigation system
After constructing these model farmlands, water management at on-farm level was studied there in relation to water attainment time, water consumption at the growing stages and for land preparation, farm workability, nature of water use and management by farmers and farmers’ socio-economic situations before and after the farmland consolidation.
9.3 Water management training
Water management training is one of the major components of the training programme of the Irrigation Department. Its fundamental aims are to contribute knowledge of irrigation water management to farmers, and to improve the technical skills of engineers and the technical staff of the Irrigation Department in this field. This training has been implemented for both on-farm and off-farm level water management development. Fundamental subjects include the setting of irrigation and drainage canals in the land consolidation areas, reservoir operation and distribution planning, operation and management of the facilities, data collection and information management, and calculation of the water requirement. The two model farmlands are also used to help all trainees understand on-farm level water management development. The training courses conducted for these purposes are here presented in Table 7. A master plan for future training programmes in relation to this subject is also being considered.
Table 7. Implementation of water management training in ITC of the Irrigation Department (1999–2005 (Up to October))
|
Training type |
Number of training courses |
Number of participants |
| (1) Farmers |
30 |
903 |
|
(2) Irrigation engineers and staff of Irrigation Department |
19 |
499 |
| (3) Seminars |
16 |
914 |
|
Total |
65 |
2 316 |
9.4 Adoption of the techniques
The Irrigation Technology Center of the Irrigation Department is now implementing the extension project (Intermediate Goal Areas Project) for water management improvement in other areas. The techniques developed in the ITC Project (Phase II) will be adopted and expanded to other areas in one project after another. For the purpose, an implementing committee has been formed comprising members of the research groups, operation and maintenance engineers and agricultural specialists and extensionists.
10. Others
With the cooperation of the United Nations Economic and Social Commission for Asia and the Pacific (UNESCAP) and FAO, the Irrigation Department has launched a programme to develop the Myanmar Water Vision and to coordinate the establishment of a national water coordination agency (NWCA) as an apex body responsible for overall management of water resources of the country in cooperation with both the public and private sectors. Furthermore, it is planned to establish a national level Myanmar Water Resources Committee (MWRC) and formulate a strategic management plan (SMP) to enhance the application of integrated water resources management in the country. In this connection, the Irrigation Department has proposed the following components of IWRM to be studied in the formulation of the SMP:
After the successful establishment of the MWRC and under the leadership of this committee, the SMP can be promoted for the sustainable production of rice and other crops together with the harmonious development of other sectors as well through improving integrated water resources management and water management for paddy field irrigation systems.
Furthermore, the Irrigation Department has a plan to implement a project on “strengthening of farmers’ irrigation management” together with the Myanmar Agriculture Services, Water Resources Utilization Department and the Settlement and Land Records Department with the technical assistance of the Japanese Government. It is aimed at reducing the administrative and maintenance costs of the construction of new irrigation projects as well as those of the existing irrigation system. The resources made available from these adjustments could be utilized in improving the system losses, expanding the area under irrigation, and updating farm-level facilities. The farmers will voluntarily form water users associations, irrigation system management will be enforced and maintenance and repairs of irrigation facilities will be carried out.
11. Conclusions
Myanmar has abundant water resources which can be used to meet the demand for water of the agriculture and other sectors. Agriculture is a major economic sector of Myanmar and irrigation systems, especially rice-based irrigation systems, have been developed to promote agricultural production. These irrigation systems allow crop production throughout the year as they make available water stored in the reservoirs and irrigation systems.
Traditional paddy fields need to be developed into a more systematic farm type for application of farm mechanization and good water control in the paddy fields. This can be achieved through land consolidation and improvement of irrigation and drainage at both off-farm and on-farm locations. This development will allow high cropping intensity with the cultivation of the high yielding varieties.
It is urgently necessary to adopt more appropriate ways for generating complex water resources projects in Myanmar to meet the requirements of all sectors. Both technical and institutional measures are required to be developed to replace traditional and conventional practices, but this should be carried out on the basis of the careful consideration of previous experience, making adjustments where necessary.
A reasonable and functional system of water users groups (WUGs) should be newly established or modified in conjunction with the local characteristics of the farming communities, including their economy, culture and the social background of the respective regions in which they are to be found. They can support the adoption of new measures for better water resources management. A reasonable water pricing system also should be implemented to lessen the government’s burden and to promote the farmers’ participation in irrigation. A suitable marketing and trading system for crops and farm products is necessary for the farmers’ convenience and to bring them sufficient benefits.
Under the leadership of the Myanmar Water Resources Committee, the irrigation systems can contribute to development of multifunctional roles and the sustainable development of the rural environment.
Acknowledgements
The author expresses his gratitude to the Director General of the Irrigation Department, Ministry of Agriculture and Irrigation, Myanmar for his support, and to the Viet Nam Institute for Water Resources Research (VIWRR), Ministry of Agriculture and Rural Development, Viet Nam and the FAO Regional Office for Asia and the Pacific for their cooperation.
References
Euroconsult & UNDP. 1992. Ye-U Irrigation Support Project: feasibility study for the rehabilitation of the Shwebo irrigation system (volume 1), MYA/85/002.
Irrigation Department. 1996. Mu-river basin project (Part-1): Progress report on Kintat diversion dam construction (in Burmese).
Irrigation Department. 2002. Thaphanseik multipurpose dam project: background history (in Burmese).
Irrigation Department. 2003. Study on effective use of drainage water in Shwebo irrigation scheme in Myanmar.
Irrigation Department. 2004a. Outline of the Irrigation Department.
Irrigation Department. 2004b. Report on integrated water resources management in Myanmar.
Irrigation Department. 2005a. Introduction to Irrigation Department (in Burmese).
Irrigation Department (Hydrology branch). 2005b. Water storage development in the reservoirs (in Burmese).
Irrigation Department-ITC Project. 2004. Seminar report on completion of Irrigation Technology Center Project (Phase II), ITC, Irrigation Department.
Irrigation Department-ITC Project. 2005. Technical Book on Ngamoeyeik Irrigation Project, ITC, Irrigation Department.
Kyaw San Win, U. 2002. Multifunctional roles in irrigation system, Paper presented paper at the Third World Water Forum (WWF3) Pre-symposium, Japan.
Maung Maung Naing. 2004. Towards participation in adoption of the technical measures for water resources management, Myanmar Engineering Society, CAFEO–22 paper 628, 01–09.
Ministry of Agriculture and Irrigation. 2004a. Draft on strategic plan of IWRM in Myanmar, Irrigation Department, MOAI, Myanmar.
Ministry of Agriculture and Irrigation. 2004b. Myanmar Agriculture in Brief, MOAI, Myanmar.
Ministry of Agriculture and Irrigation. 2005. Myanmar Agriculture in Brief, MOAI, Myanmar.
Ministry of Information. 2002. Facts and figures 2002, MOI, Union of Myanmar.
Myanmar Water Vision Team, Ti Le-Hu & Thierry Facon. 2003. Report on formulation of national water vision to action (3rd draft), Irrigation Department, Ministry of Agriculture and Irrigation, Myanmar.
Zaw Win, U. 2004a. Agricultural water resources study in Myanmar: water scarcity variations in Myanmar, Myanmar Engineering Society, CAFEO–22 paper 635, 01–038.
Zaw Win, U. 2004b. Water assessment and water sector profile for Myanmar, Irrigation Department.
Irrigation Department, Ministry of Agriculture and Irrigation, Myanmar.
Proceso T. Domingo5
Abstract
Current irrigation development in the Philippines stands at 45 percent of the irrigable area and this is short of the threshold for reaching rice self-sufficiency. The tight financial situation that the government finds itself in has necessitated pruning the annual irrigation development programme. Programme priority, in fact, has shifted to system rehabilitation projects with new construction focused on small-investment small-scale irrigation systems only.
Experience shows that major rehabilitation, although effective in checking system deterioration and dysfunction, fails to improve irrigation performance and services. In response to this experience, the irrigation agency is focused on improving water availability, allocation and regulation as a special part of its irrigation projects. This innovation is intended to address the principal causes of low cropping intensity: low and dwindling water supply and inequitable and wasteful water distribution.
Part of the advocated irrigation sector reform is the release by the irrigation agency to the irrigators’ associations of stewardship over sections of public systems. This has the twin objectives of expanding farmers’ participation and downsizing system offices, both sides benefiting from resultant financial rewards. Monetary incentives received by irrigators associations in taking over system management represent the driving force that keeps them supportive of system policies.
Insufficient collection of irrigation service fees (55±5 percent) keeps funding for system restoration inadequate, resulting in suboptimal maintenance and repairs. Deterioration of water availability and irrigation services ensues from repetition of such a situation, making farmers more unwilling to pay fees. This leads to a devastating cyclic phenomenon in irrigation operations that mere system restoration cannot break. Only major rehabilitation with an enhanced irrigation package is likely to succeed.
Irrigation modernization in the country has started to move forward alongside the implementation of institutional and policy reforms in the irrigation sector. These reforms are intended to elevate the operating performance of the irrigation agency and irrigation systems as essential conditions to the rice self-sufficiency thrust. A particular reform measure adopted is the implementation of a rationalization plan for the irrigation agency that balances irrigation service delivery with agency financial stability.
1. Irrigation development: general description
Construction and rehabilitation of irrigation systems and promotion and adoption of improved farming practices aim to increase annual rice production. Declining water supply, worsening system deterioration and defective water control, however, tend to diminish the irrigated area and irrigation services. Financial distress, caused by low revenues, growing workload and expensive materials, requires deferment of system repairs and stretching of project execution.
(a) System performance
Water management, the main task in system management, aims to deliver correct and adequate amounts of water at every offtake during the irrigation season. Dwindling and fluctuating water supply and inequitable and wasteful water distribution, attributable to deficient water allocation and regulation, restrict success. The irrigated area thus pegs at levels much below the service area and makes cropping intensity (135±5 percent per year) much below potential — signifying poor irrigation services.
Besides deficient water availability and distribution, inferior water allocation and severe system deterioration also contribute to depressing system functioning. Poor irrigation services dissuade an increasing number of farmers from paying an irrigation service fee (ISF), making collections inadequate for the restoration needs. Radicalized farmers’ behaviour, caused by ISF-delinquent perceived role models and the tricks perpetrated by some system staff, also push up the number of ISF non-payers.
(b) Irrigation contribution
Irrigation systems in the Philippines are rice-based, considering that rice is the local staple, with a few of such systems supplying water to banana plantation canals. At the current low levels of irrigation development (45 percent), rice yields and rain-dependent rice areas, domestic rice production remains short of the requirement. Reducing this rice shortage has been the overriding goal of every banner rice-production programme of the government over decades, but success remains elusive.
Increasing rice yield is the primary goal of the said programmes, with the farmers’ use of improved varieties, correct fertilization and preventive pesticides as the strategies. Priority programme beneficiaries are the irrigated areas, in view of the perceived dependability of water supply that reduces risks associated with crop-damaging dry spells. Increasing the irrigated area and cropping intensity, however, remains the essential measures for achieving and sustaining rice self-sufficiency for the country.
(c) Irrigation policies
Management (operation, maintenance and repairs) of large rice-based irrigation systems continues as a mandate of the National Irrigation Administration (NIA). As evolved, NIA handles water management at the canal (primary and secondary) level with NIA earmarking the task at the ditch (farm) level to the farmers. This precursor of farmers’ participation necessitated organizing the farmers in every turnout service area (30 to 40 ha) into irrigators group, then training them.
Although the rotational irrigation method at the ditch level failed to take off, at the canal level it worked with the support of the irrigators associations (IAs).6 This show of potential led to the release by NIA to IAs of selected system management tasks like canal maintenance, water management and ISF collection. Financial incentives derived from executing these tasks provided a needed income source for the IAs — a factor that keeps the IAs active and useful partners of NIA.
2. Agricultural development: national thrusts
Expanding irrigated area outweighs the combined contribution of adopting improved rice varieties and crop nutrition and protection in increasing rice production. Meagre annual increases in irrigation service area, attributable to the reduced scope of irrigation development programmes to match funding constraints, stalls efforts. Reaching rice self-sufficiency thus continues to be the prime aspiration of the nation and it remains as such much longer than expected because irrigation development has fallen behind.
(a) Reaching rice self-sufficiency
Domestic banner agricultural development programmes envisage elevating the Philippines from a persistent rice importing country to a rice self-sufficient one. Besides targeting increasing rice yield, expanding irrigated area and increasing cropping intensity are the strategies designed to increase rice production. Expanding the irrigated area through construction and rehabilitation of irrigation systems remains the more potent initiative in approaching rice self-sufficiency.
Implementation of irrigation projects, however, is constrained by lack of funds, with the number and extent of projects limited by an imposed budget ceiling. Both ongoing foreign-assisted and government-funded projects, in fact, suffer from a trickle of cash support, which results in negative slippage of the implementation period. This situation further prolongs the time for reaching rice self-sufficiency because it inhibits efforts to expand the irrigated area to the known threshold level.
(b) Expanding the irrigated area
Many people both in the rural and urban areas become aware of the importance of irrigation only when devastating droughts and rice insufficiency crises strike. Under a no-crisis situation, many people become oblivious of the necessity for irrigation systems — a factor that exacerbates the effect of the tight financial situation. Current priorities thus have skewed at less expensive system rehabilitation with new construction projects focused only on low-investment small-scale systems.
Past rehabilitation works, however, defied expectations of improved irrigation performance, with irrigated area and cropping intensity kept at the same low levels. Proper judgment of the needs (physical, procedural and social) of and application of innovative measures in system rehabilitation offer hope for a turnaround. Estimated achievable increase in irrigated area out of system rehabilitation would still be short of the requirement to reach the threshold of rice self-sufficiency.
3. Sustainable irrigation: emergent requirements
NIA has embarked on releasing the stewardship over the secondary and tertiary levels of NIA-managed systems to acquiescent and (what are deemed to be) capable IAs. As a means of enhancing inherent IA capability, NIA earmarks in the said programme only those systems that have undergone or will undergo major rehabilitation. A foreseeable attribute of the systems that undergo rehabilitation with an improved package is the reduced incidence of problems of water allocation and distribution.
(a) Protecting system functionality
Income from ISF collections continues to be the main source of funding to meet the costs of operations, maintenance and repairs of the NIA-managed irrigation systems. Such insufficient ISF collections result in suboptimal maintenance and repairs — resulting in worsening of system deterioration and dysfunction. As system performance and irrigation services decline, farmers’ willingness to pay ISF likewise declines, triggering the onset of a worsening cyclic phenomenon.
With the systems engulfed by the said phenomenon, water availability and irrigated areas shrink, with the farmers ending up the principal victims of this remiss. This has driven NIA to impose the controversial “no payment no irrigation” policy, with support from the irrigators groups and IAs, to protect farmers’ interests. Success in the implementation of this policy serves to demonstrate the relevance of organizing and training IAs in mustering farmers’ collective action.
(b) Expanding farmers’ participation
Recognizing the need to tap the capability of IAs and to provide an income source for them, NIA encourages the IAs to take over system management tasks. Programme implementation already has reached a stage whereby many IAs have taken over the management responsibility of their respective jurisdictional areas already. Promotion of irrigation management transfer (IMT) aligns with the national thrusts for farmers’ empowerment and a management modality shift for the systems.
IMT renders particular system staff redundant but NIA could not convince the said staff to retire early because of the unavailability of funding to offer incentives for them to do so. With the redundant staff continuing to receive remuneration, the incentive fees received by the IMT-recipient IAs from NIA represent an added cost to NIA. As IMT coverage expands, NIA now contemplates two possible scenarios: NIA’s relevance may start to dwindle and irrigation services may start to plunge.
(c) Undertaking institutional reform
Compelled by financial difficulties, NIA proposed in 2002 a streamlining plan but lack of funds for personnel retirement incentives stalled implementation. NIA now, along with other agencies in the executive branch of government, is formulating a rationalization plan aimed at improving service delivery and agency finances. NIA is enthusiastic the plan will be pushed through as the government is working on making available adequate funds for the retirement incentives.
A consulting firm, engaged through a grant for the preparation of a proposed system rehabilitation project, would formulate policy reforms in the irrigation sector. Financial strengthening of NIA, repair funds for systems, management improvement of equipment and guidelines enhancement for IMT comprise the concerns. These reforms intend to complement the envisaged enhanced package of system rehabilitation, all aiming at improving agency and system performance.
4. Irrigation operations: management reform
The negligible effect of major rehabilitation on improving irrigation performance obligated NIA to incorporate innovations in the rehabilitation scope of the systems. These innovations comprise water supply augmentation, water flow regulation, operating modality shift, repair fund generation, and agency institutional reform. Improving water availability for the irrigation systems and service area represents the foremost input to increasing irrigated area and improving irrigation services.
(a) Upgrading the development focus
Farmers and NIA staff in irrigation systems that underwent major rehabilitation become frustrated because of its failure to improve irrigation services. Inequitable water distribution, shown by water superfluity in the upper section, water deficit in the middle section and water deprivation in the lower section, persists. Major rehabilitation, via its traditional package, does correct system deterioration and restore functionality but does not improve irrigation performance.
Building on this experience, NIA is now focusing on improving water availability and water distribution in its forthcoming construction and rehabilitation projects. Augmenting water supply, through drainage water reuse and intermediate water storage systems, and improving discharge regulation are the new measures. An envisaged innovation is the delivery of flowrates quantified using design-based water allocation, and controlled and measured using appropriate structures.
(b) Tackling emergency repairs
Current levels of ISF rates are just enough to offset the costs of system operation, maintenance and repairs but the low collection levels cause problems. Resultant limited funding, aggravated by high and rising costs of construction materials and equipment fuel, constrain execution of maintenance and repairs. Trickling and diminishing government appropriations for repair works have somehow provided relief to NIA, but the current tight financial situation threatens cessation of the said subsidy.
Floods caused by typhoons often devastate irrigation facilities, many of which are so critical that if not repaired immediately would imperil standing crops. Widespread and critical system devastation has happened already almost every year and NIA, in many instances, has had to defer repairs because of lack of funding. To correct such an image-damaging situation and to support IMT-recipient IAs, NIA now advocates the establishment of a fund for emergency system repairs.
Table 1. General information on rice-based irrigation systems in the Philippines
|
Parameter |
Physical scale | ||||
|
<10 000 ha |
10 000 to 100 000 ha |
>100 000 ha |
All sizes | ||
|
1. Number of systems |
|||||
|
a. |
National irrigation system |
183 |
13 |
– |
196 |
|
b. |
Communal irrigation system |
6 702 |
– |
– |
6 702 |
|
c. |
Private irrigation system |
4 001 |
– |
– |
4 001 |
| Total |
10 886 |
13 |
10 899 | ||
|
2. Annual water diversion, MCM |
31.50 | ||||
|
a. |
% for agriculture water use |
100 | |||
|
b. |
% for domestic water use |
– | |||
|
c. |
% for other water uses |
– | |||
|
3. Design irrigation area, ha |
|||||
|
a. |
National irrigation system |
453 857 |
236 382 |
– |
690 239 |
|
b. |
Communal irrigation system |
537 304 |
– |
– |
537 304 |
|
c. |
Private irrigation system |
174 200 |
– |
– |
174 200 |
| Total |
1 165 361 |
236 382 |
1 401 743 | ||
|
4. Effective irrigation area, ha |
|||||
|
a. |
National irrigation system |
– |
– |
– |
140±5%/yr |
|
b. |
Communal irrigation system |
– |
– |
– |
130±5%/yr |
|
c. |
Private irrigation system |
– |
– |
– |
130±5%/yr |
| Wt. mean |
134±5%/yr | ||||
|
5. Irrigation area, % of (3) |
|||||
|
a. |
Rice |
100% in WS | |||
|
b. |
Vegetable and orchard |
5% in DS | |||
|
c. |
Other crops (banana) |
nil | |||
|
No. of beneficiaries — farmers |
|||||
|
a. |
National irrigation system |
434 844 | |||
|
b. |
Communal irrigation system |
301 035 | |||
|
c. |
Pump irrigation system |
134 540 | |||
| Total |
870 419 | ||||
|
No. of beneficiaries — city residents |
No info | ||||
|
Wetland areas supported, ha |
– | ||||
5 Administrator, National Irrigation Administration (NIA), EDSA, Diliman, Quezon City, Philippines.
6 IAs cover about 750 hectares, at the initial stage, composed of several irrigators groups and their formation is intended to facilitate resolution of water-related conflicts and enforcement of operating policies and irrigation programmes.
Chawee Wongprasittiporn7
1. Background information on large rice-based irrigation systems
In Thailand, most of the agricultural land is paddy field, therefore most irrigation schemes supply water to paddy.
Four of the main large rice-based irrigation systems in Thailand are described below.
2. Trends of agriculture development and water resources management
On the basis of the national socio-economic development trends, the Royal Irrigation Department reviewed its vision, missions, objectives, and strategies in 2005 to serve the country’s development.
The Department’s vision is articulated as supplying sufficient water to support agricultural production to raise farmers’ incomes and sustain the economy.
Its missions are:
Its objectives are:
Its strategies are:
Because of the drought crisis of last year, the government has emphasized small scale water resources development countrywide in order to enable all people to have access to water. Therefore, a list of numerous small and medium scale projects countrywide has been proposed.
The expansion of the irrigation area will increase the irrigation area over the rainfed area in order to reduce the risks of water shortage for farmers. This will lead to more secure revenue for farmers.
In the existing irrigated area, the policies are aimed at increasing irrigation efficiencies and improving water management. With this strategy, the same amount of water should be utilized for more agricultural production.
Land resources and water resources utilities will be integrated to achieve higher production to serve the larger population and fewer agricultural lands expected in the future. Normally in the dry season or in rainfed areas, farmers migrate to the main cities, but the expansion of irrigation in rainfed area as well as more effective use of water will increase cropping intensities and agricultural labour will be needed throughout the whole year.
Moreover, if some existing agricultural lands are provided with irrigation facilities there will be less land invasion in the forest preserve areas. This will help achieve the country’s environmental conservation goals.
3. New requirements for large rice-based irrigation systems
In recent years, the paddy price has increased (almost double the price of ten years ago in 1995), farmers have responded by increasing the paddy area. This is most obvious in the dry season.
In some irrigation areas farmers have also developed their own water resources such as shallow tube-wells for conjunctive water uses which they manage by themselves.
Three crops per year are available in some areas and this indicates that if water is sufficient, farmers will make more concentrated uses of agricultural land.
As the higher paddy price is a powerful incentive for farmers, their behaviour and practices are also reflected in irrigation management in some projects in terms of:
These changes need to be closely monitored and assessed and water management needs to be adjusted to conform to farmers’ changing practices.
It is necessary for more people to participate in water management in order to catch up with demand and supply side potentials and constraints and to open up opportunities for consultation between both sides for concentrated land and water resources use.
4. Measures undertaken
The 2005 vision, missions, objectives and strategies mentioned earlier in Section 2, introduced some new foci in water management to provide good quality services. These are countrywide service delivery based on the principle of equity and not focusing only on potential irrigated area but also on people’s participation.
4.1 People’s participatory irrigation management (PIM)
Some strategic measures such as the project promoting people’s participatory irrigation management (PIM) were implemented first in the form of pilot projects assisted by the Asian Development Bank (ADB). After the pilot projects were completed, the Royal Irrigation Department applied the PIM approach to its routine tasks at provincial level using its own annual budget.
In spite of budget limitations, the PIM approach is still practised and there is good consultation between irrigators and farmers. Before each irrigation season starts, there will be a meeting of the provincial irrigators, provincial agriculturists and farmers groups in the province. Irrigators will inform the meeting about water availability and the irrigation starting date (after canal maintenance), the agriculturists will give information about the trend of the agricultural market, and farmers will inform the meeting of their planned crops. The amount of water, potential planting area, type of crop and marketing will be discussed to fine tune among needs, availability and constraints so as to establish the cropping pattern and irrigation schedules. Additional meetings will be established in case of a mid-season crisis or significant changes in plans.
These new practices (increasing the level of people’s participation) were implemented one or two years after completion of the ADB supported pilot projects. In the past, farmers got to know about the irrigation schedule by asking a zone-man in the field. With some projects, there was a notice board nearby the irrigation canal informing farmers of the irrigation schedules. However, this is one-way communication that allows farmers to receive information but not give information about their needs.
By allowing farmers to participate in water management, complaints and disputes are fewer and farmers can better plan their production processes. The direction is moving towards demand-side management using the full potential of resources, but it still faces some constraints. Equitable land and water resources utilization is discussed and encouraged in the participation meeting.
4.2 Conjunctive uses of water
As the price of paddy is high, dry season paddy areas have been much greater than the potential area based on irrigation water availability. In some areas, three paddy crops were cultivated throughout the whole year.
These three crops are possible because of the large numbers of alternative sources of water, namely private shallow tubewells, developed by farmers.
In the Phitsanulok Irrigation Project, daily water use in paddy fields was measured. It was found that in the tail-end area where irrigation water is not very reliable, shallow tubewell water accounts for about 80 percent of the water supplied, whereas in the head-end area irrigation water is still the main source of water. This affects the planning of water management and irrigation schedules.
As the water requirement is much higher, irrigation scheduling has changed from continuous flow according to design criteria to rotation flow. The operation of cross regulators for abrupt flow changes in rotation schedules causes sliding of earthen canals. The trapezoidal shape of earthen canals has changed to a large U-shape. Water flow is quite slow and the hydraulics of slow flow complicates irrigation management.
4.3 Water management for development and the environment
At present, under the technical assistance of the Government of Spain, the Royal Irrigation Department is undertaking a study of irrigation improvement for the Phitsanulok Project. The content of the study is to apply an appropriate mathematical hydraulics model to determine the most suitable water management regime.
The potential of utilizing groundwater is being studied and the participation of water user groups in water management is also included in the study.
In the south, a large paddy irrigation project — the Pak Panang Project — is a water management system that was designed not only to achieve a development target but also to mitigate any adverse impact from the project. The operation of a set of gate regulators is meant to store fresh water for the dry season, to mitigate flooding in the rainy season, and to protect the agricultural area from salinity intrusion. Later on, additional study was conducted to mitigate some environmental impacts such as water pollution downstream of the gate in the dry season, to allow brackish water to act as a buffer zone between fresh and sea water for the sake of brackish water animals and to divert acidic water from an upstream large acidic swamp out to a by-pass canal to prevent the flow of highly acid water to a fishery site downstream.
Multi-objective water management for large scale paddy fields is the most complicated type of water management in Thailand as the people in the project area have different occupations leading to differences in water uses. Farmers need fresh water in the dry season for a second paddy crop (dry season paddy) while fisherman and shrimp ponds need brackish water and want to fully open the regulator gates. To solve this problem, the provincial governor, the provincial government agencies concerned with irrigation, fisheries, agriculture, and resource persons from universities, non-government organizations and representatives from each district have had continuous meetings to formulate a plan to be agreed by all sectors. The management alternatives proposed by one of the meetings were taken to create a simulation exercise to predict the results and bring them up for discussion at the next meeting. The meeting ended with the agreement that water management will not have adverse impacts on the farmers. The gates of the main regulator will be operated conforming to the sea water level to enable the brackish water zone to travel up to some control point during the wet season to allow the nursing of shrimp in natural water. The other regulators will be operated in conjunction with the main regulators to protect the paddy fields from salinity intrusion.
5. Further options to meet the changing requirements
In the Pak Panang Project, water management now includes socio-environmental considerations. After the new gate opening was agreed, the people’s participation meeting also recognized the impact of the new changes, therefore a monitoring team was set up to follow up with a monitoring programme. The place and period of monitoring was discussed in the participation meeting. The monitoring team includes members from all stakeholders such as local people, irrigators, environmental NGOs and staff of universities.
With regard to the conjunctive use of shallow tubewells in the Phitsanulok Irrigation Project, there is now recognition of the additional sources of water that are managed by farmers. There are some relevant studies in the Phitsanulok irrigation area such as the study of GIS of shallow tubewell potential, measurement of water level in some representative shallow tubewells, study of water recharge rate to shallow tubewells. The studies were undertaken to find out an appropriate water management regime to improve water allocation to serve the demand and to solve the problem of sliding of the earthen canal. In the near future, the water management will be changed to some extent to conform with the current situation.
Information on irrigation systems in Thailand
National irrigation management Agency: Royal Irrigation Department
|
General information on irrigation systems | ||||
|
Physical scale of rice-based irrigation systems |
<10 000 ha |
10 000 to 100 000 ha |
>100 000 ha |
All scales |
|
Number of systems |
10 536 |
85 |
10 621 | |
|
Annual water diversion (MCM) |
4 787 |
29 642 |
||
|
% of agriculture water use |
||||
|
% of domestic water use |
||||
|
% of other water use |
||||
|
Designed irrigation area (ha) |
2 611 700 |
2 668 160 |
||
|
Effective irrigation area (ha) |
2 611 700 |
2 668 160 |
||
|
Rice irrigation area (ha) |
||||
|
Vegetable and orchard area (ha) |
||||
|
Other crops irrigation area (ha) |
||||
|
Beneficiaries — farmers |
||||
|
Beneficiaries — city residents |
||||
|
Wetland areas supported (ha) |
||||
|
Information of the largest rice-based irrigation system | |
|
Name |
The Greater Chao Phraya Irrigation Project |
|
Location |
Central Plain |
|
Construction period |
1958–1972 |
|
Designed irrigation area |
1 200 000 |
|
Functional irrigation area |
1 200 000 |
|
Annual water diversion (MCM) |
22 972 |
|
% of agriculture water use |
80 |
|
% of domestic water use |
|
|
% of other water use |
|
|
Rice irrigation area (ha) |
|
|
Vegetable and orchard area (ha) |
|
|
Other crops irrigation area (ha) |
|
|
Water supply per ha of irrigated rice field |
|
|
Output (US$) per m3 of water supply |
|
|
Beneficiaries — farmers |
|
|
Beneficiaries — city residents |
|
|
Wetland areas supported (ha) |
|
7 Royal Irrigation Department, Bangkok, Thailand.
Nguyen Dinh Ninh8
Abstract
Viet Nam has a gross area of 330 991 km2 with a population of about 80 million (2004), a population density of 242 people/km2. Over 75 percent of Vietnamese people live in rural areas. Agriculture accounted for 22 percent of the gross domestic product in 2003.
In recent years, Viet Nam’s economic growth has been stable at the rate of 7.5 percent per year. Growth in agriculture constantly increased at a rate of 4 to 4.5 percent per year. Viet Nam is a major exporter of agricultural products (rice, coffee, rubber, pepper, cashew etc.). Agricultural development in recent years has not only contributed to national income growth, food security and poverty reduction but also has contributed to social stability and environmental protection.
However, the country’s integration into the international economic system has brought many challenges to Viet Nam’s agriculture sector. To ensure sustainable agricultural development, issues of markets, pricing, competition of agricultural products and water must be addressed.
Viet Nam is located in the tropical monsoon zone and, potentially, has abundant water resources. Annual runoff is about 844 billion cubic metres, of which 323 billion cubic metres are generated inside the country, and 521 billion cubic metres are generated from outside the country. Groundwater resources have a dynamic potential of about 1 500 m3/s. However, water distribution is uneven in both space and time. From 75 to 80 percent of annual runoff is concentrated in three to four months of the mid-rainy season and 5 to 8 percent is concentrated in three months of the mid-dry season. Therefore, water shortage, drought and water logging often happen in most of areas of the country with serious consequences for farmers. Over the previous decades, water resources development and management have been a serious concern of the state and the people of Viet Nam. Water resources development has contributed significantly to the economic and social development of Viet Nam, especially in terms of agricultural production.
In the coming decades, Viet Nam’s economy will undergo a high rate of growth to achieve the country’s goals of industrialization and modernization, and the population growth of the country will continue to increase, with a forecast of 88 to 89 million people in 2010. Therefore, the demand for water for socio-economic development in general and for sustainable agriculture in particular will seriously challenge the water sector. This must be met with success.
1. Key water management and development problems and challenges
1.1. Some features of water resources in Viet Nam
Viet Nam is under the influence of two monsoon systems — the northeast and the southwest monsoons. Thus, the rainfall is distributed unevenly both in space and time. The rainy season usually starts in May or June and finishes in October or November, which normally provides 75 to 80 percent of the entire annual rainfall. The rainfall in the dry season is very low, many areas have no rain for months. As for space, the rainfall distribution is affected by the topography: in some areas, the rainfall may reach up to 3 000 to 5 000 mm/year whereas for other areas, the rainfall is as little as 1 000 mm/year.
In the rainy season, the water flow module can be from 60 l/s/km2 to 80 l/s/km2 while in the dry season, the water flow module is just 10 l/s/km2. As for time, the water flow in the rainy season accounts for 75 to 80 percent of the annual water flow. The water flow in the lowest month is just 1 to 2 percent of the total water flow in the year. The difference between the high flow year and the low flow year can be two to three times.
According to a national-level survey, the total amount of water which flows in Viet Nam is estimated at about 844 billion m3 per year (approximately 271 000 m3/s), including 323 billion m3 from the internal flow of Viet Nam accounting for 37 percent and 521 billion m3 from the external flow.
Besides surface water resources, Viet Nam also has groundwater resources with the total amount of 50 to 60 billion m3 (equivalent to 1 513 m3/s). It is estimated that the maximum exploitable capacity is only 10 to 12 billion m3.
One of the characteristics of Viet Nam is that drought and water shortages occur every year in different areas with different degrees of seriousness. In the rainy season, flood and inundation are very common. In recent years, Viet Nam has been faced with calamities of historical proportions: the drought in 1998 caused great losses for the economy, more than three million people lacked water for domestic use; two successive floods occurred in the central provinces in November and December 2000 and in 2001; the flood in the Mekong Delta this year is the biggest in the last 70 years. At the beginning of 2002, there were serious droughts in the central highlands, the south central provinces and the Mekong Delta.
Given the facts stated above, Viet Nam’s water resources must be used efficiently and effectively and at the same time the adverse effects of too much or too little water must be mitigated.
1.2. Achievements of investment in irrigation systems development
1.2.1 Investment achievement of water supply and drainage development
Up to now the country has had 75 large irrigation and drainage schemes, 800 large and medium dams, over 3 500 reservoirs with capacity higher than 1 million m3 and heights over 10 m, 5 000 large sluices, and over 2 000 big pumping stations and thousands of medium-scale and small-scale water works. All schemes have irrigated fully 3.3 million hectares and partially over 1 million hectares. They have drained 1.4 million hectares, prevented salt intrusion in 0.77 million hectares and improved 1.6 million hectares of acid sulphate soil. They have also supplied 5 billion m3 of water for domestic and industrial uses. Irrigated areas of paddy, upland crops, vegetables and short-term industrial trees have been constantly increased as shown in the diagram below.
In 2000, the water works irrigated 0.718 million hectares of upland crops, vegetables and industrial trees, 5.973 million hectares of paddy (of which there were 2.45 million hectares of winter-spring paddy, 1.82 million hectares of summer-autumn paddy and 1.703 million hectares of late autumn paddy) and drained 1.596 million hectares of cultivated land.
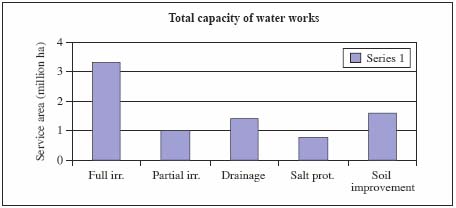
1.2.2 Investment achievements in flood protection and mitigation
The existing flood protection works systems consist of 5 700 km of river dykes, 2 000 km of sea dykes, 23 000 km of embankment rings and thousands of sluices, and hundreds of kilometres of revetment. The dyke systems are now strengthened, improved to a higher standard for flood protection, especially for the Red, Thai Binh, Ma and Ca Rivers.
1.3. Investment benefits of irrigation systems development
1.3.1. Rapid increase and stabilization of the paddy cropped area, yield and production
Because the irrigation water supply was increased and its quality services were improved, the paddy cultivated area has increased from year to year in line with cropping pattern changes. In 2000, 7.67 million hectares of paddy were cultivated (in 1986 it was 5.68 million ha). Especially, the winter-spring paddy area increased to 3 million ha (in 1986 it was 1.8 million ha) and the summer-autumn paddy increased to 2.33 million ha (in 1986 it was 0.9 million ha). The increased paddy area was mostly in the Cuu Long River Delta, from 2.58 million ha to 3.97 million ha. The gross food production of the country rapidly increased and stabilized from 16 million tonnes (1986) to 32.5 million tonnes (2000). This was a very great achievement of the agriculture sector. It not only ensured national food security, but over 3 million tonnes of rice were exported also with a value over 800 million USD.
1.3.2. Crop diversification development
The food upland crops, for example maize, increased its cultivated area from 460 000 ha (1986) to 700 000 ha with the total production of 1.93 million tonnes. The planted area and production of annual and long term commercial trees and orchards also increased. Annual average production (1986–2000) was much higher in comparison with the previous five years, for example, groundnut increased 1.64 times, sugarcane increased three times, soybean increased 1.67 times, rubber increased five times, coffee increased 2.5 times. The fruit trees such as longan, lichee, rambutan etc. also increased both in terms of planted area and production. In 1995 the planted area was 37 600 ha and 223 000 tonnes were produced, in 2000 the planted area was 149 000 ha and 719 000 tonnes were produced.
The agriculture value per hectare of the cultivated land increased from 13.5 million VND/ha (1995) to 17.5 million VND/ha (2000), typically, but some places gained over 100 million VND/ha because irrigation and drainage services were good and investment in new varieties and agricultural materials was higher.
1.3.3. Water supply for domestic use and industries
Providing services for domestic and industrial uses is becoming more important in water resources development. Up till now, hundreds of water works have supplied over 5 billion m3 for domestic uses and industries. The proportion of the rural population supplied with water is increasing, especially in remote provinces in mountainous areas and the Cuu Long River Delta (42% of rural population).
1.3.4. Water for fisheries development
Fisheries development, especially in brackish water areas, has had a very high rate of growth. The improved water works have ensured fresh water sources for fish farming and facilitated increase of the fish farming area in saline and brackish water from 342 000 ha (2000) to 585 000 ha (2001).
1.3.5. Development of solutions for drainage and flood control
The development of solutions for drainage and flood control has brought very big benefits. Tens of millions of people and millions of hectares of cultivated land within the delta that frequently is threatened by floods have been protected by water works. Loss of people’s lives and property caused by floods and typhoons is not only much reduced but the ecology, people’s living environment, and sanitation have been improved, diseases have been prevented and economic activities have been maintained also, even when heavy rains and high flooding occur. This facilitates sustainable socio-economic development.
1.3.6. Contribution of water resources development to social improvement
Water resources development creates good opportunities for increasing land intensity (in the Red River Delta, the land intensity increased from 1.4 up 2.3), creating new jobs for farmers, reducing labour in agricultural production (by using water transport in canals as well as land transport on canal banks), improving habitat arrangements for flood evacuation (especially in the Mekong Delta), improving the living conditions of farmers. Many new economic zones have been established and rapidly developed and are strongly supported by water resources development to supply water for domestic use and production activities.
1.3.7. Contribution of water resources development to environmental improvement
Water resources development contributes to quality of life and agricultural production, increases groundwater resources, regulates runoff, increases soil moisture and water supply in the dry season and reduces flooding in the rainy season. In the Mekong Delta, thanks to irrigation and drainage schemes, acid sulphate soils have been significantly reduced in terms of affected area and acidity levels. Fresh water irrigated areas have been increasingly expanded to make a large zone where there are two or three crops per year instead of only one summer crop as previously. In the mountainous and midland zones, most of the cultivable lands are on slopes and bare hills and irrigation has changed the water regime in soils in a favourable direction creating better water and air regimes in soil and increasing soil fertility. Irrigation has reduced the shifting cultivation practices of minorities too and has protected the forest ecology and contributed to border security.
The benefits from water resources development are very significant not only in terms of raising people’s income, but also in terms of other more intangible benefits for communities. There are positive impacts on society, the environment, farmers’ lives and rural areas as well as contributing to economic and livelihood sustainability and improving the cultural life of the people.
1.4. Challenges
1.4.1. The degradation of water resources
Water resources are affected adversely by the destruction of forests, by pollution and by global climate change. Natural disasters, floods, drought, saline intrusion, flooding, tidal waves, pollution of water sources, etc. are increasing daily and becoming severe enough to cause serious damage to people and property.
1.4.2. Economic growth
With rapid economic growth there will be an increase in the demand for water from various socio-economic sectors. Water conflicts between the various sectors need to be resolved in a way that meets the various demands equitably without jeopardizing the country’s socio-economic development objectives and its progress towards industrialization and modernization.
1.4.3 Increasing population pressure and quality of life
In 1999, the population of the whole country was 76.3 million, with 23.5 percent living in urban areas. It is projected that in 2050, the population will increase up to 100 million and then stabilize within two or three decades. Because of the increased population and the improvements in the quality of life, meeting the demand for water for increased production and for domestic uses will be an enormous challenge and will need to be met by the effective development and management of national water resources.
1.4.4. Conflicts over water rights
Conflicts over transboundary water resources such as the Mekong River and the Red River will likely increase as downstream riparian states suffer from the actions of upstream riparian states that alter the flow or quality of the transboundary water resources.
1.4.5. Conflicts between local areas over water rights
Conflicts over water rights especially in interprovincial and interdistrict irrigation systems will arise and will increase. In order to resolve these conflicts, water resources need to be developed and managed to ensure their sustainable exploitation and their equitable allocation.
2. Irrigation systems management and development objectives
2.1. Objective 1: To contribute to the country’s industrialization and modernization programmes.
This requires structures to be prepared so that in 2010 sufficient water will be supplied to all sectors. Out of a total volume of 95.52 billion m3, the water volume for domestic uses will be 2.06 billion m3; industry — 4.85 billion m3; agriculture — 71.91 billion m3; fishery — 9.73 billion m3; and environment — 6.98 billion m3 (and downstream flow in the dry season should be not less than 4 110 m3/s). This will:
2.2. Objective 2: To strengthen investment and the development of technical solutions and enhance protection against and mitigation of natural disasters such as floods:
2.3. Objective 3: To strengthen national water resources management by establishment of water resources management organizations from the central to local levels:
2.4. Objective 4: To strengthen scientific study capacity, water resources management, construction and planning design abilities, application of new materials, technologies to construct hydraulic structures, modernization of management facilities, arrangement of capable staff for management and exploitation of structures.
3. Strategic implementation solutions
3.1. Strengthening investment in water resources development
3.1.1. Investment for exploitation of water resources
Focus investment on large repair, upgrading and modernization of existing water supply and drainage headworks systems to strive for full capacity of works, serving polyculture and crop diversification. At the same time, invest in rehabilitating canals from headworks to on-farm, apply advanced irrigation and drainage technology combined with traditional techniques to save water to improve the land, maintain the land, and maintain the water in sloping land areas. Focus investment on completing works under construction to promptly serve production activities.
Invest in constructing works that can integrate various water uses, enhance regulation capacity to provide adequate water to serve national economic development and improve environment.
Invest in the development of small works in mountainous areas and remote areas to serve the poverty alleviation programme, settled agriculture and human settlements and ensure sufficient municipal water and environmental hygiene for people in these areas.
3.1.2 Investment for flood and natural calamity mitigation and prevention
Strengthen dykes, flood discharge capacity, and flood diversion to actively prevent flooding or limit losses caused by large natural calamities. The Red River dyke system has to be comprehensively enhanced and strengthened. The sea dyke system has to be able to protect against nine and ten degree storms. Flood safety areas have to be established in shallow inundated areas of the Mekong River Delta, and people’s safety has to be ensured in deeply inundated areas.
Complete the construction of emergency situation promulgation targets for natural calamities and the principles for management of emergency situations to assist the Prime Minister to make the right decisions regarding flood diversion and mobilizing human and material resources according to the relevant laws and regulations.
Besides construction measures, forecasting technology and communication systems need to be upgraded to the lowest level of loss caused by natural disasters. Enhance community awareness to increase activities designed to prevent or mitigate natural disasters. There is a need to integrate agricultural and forestry development programmes with natural disaster prevention programmes. Enhance international cooperation and regional cooperation to exchange experiences and strengthen technical assistance capacity.
3.2 Strengthening water resources management and irrigation works
3.2.1 Systematize all relevant legal documentation
It is necessary to systematize all relevant legal documentation and disseminate the Law on Water Resources. This can be achieved through:
3.2.2 Strengthening water resources development planning
Water resources development planning should be the basis for managing the water resources of river basins and should include:
3.2.3 Consolidation of management arrangements for water resources and hydraulic structures from the central to local level
The following measures need to be carried out:
3.3 Strengthening human resources training, promoting research activities and applying science and technology
3.3.1 Human resources development
Human resources need to be improved by:
It is expected that up to the year 2010, the number of trained staff for each year will be: technicians — 4 000, engineers — 2 000, with master’s degree — 100, with doctorate degree — 10; up to the year 2020: 4 000 technicians, 2 400 to 2 600 engineers, 120 to 150 masters and 10 to 20 doctors to supply personnel to the various sectors and local agencies throughout the country.
3.3.2 Promoting science and technology
Speeding up scientific research activities, application of new technologies such as information technology (telereconnaissance, informatics), automation, construction materials, etc. in planning, design, building and management of water resources and structures. The technical safety of structures to be constructed should be ensured and they should be economically viable.
3.4. Intensification of international cooperation
3.5. Participatory development
Socialize hydraulic activities and water resources management on the basis of a government and public partnership for implementation. Concentrate on development of indigenous capacity and encourage foreign and domestic investors to participate in effective exploitation of water resources and the construction of hydraulic structures and ensure the equitable distribution of benefits.
Intensify education activities through public broadcasting and television programmes and newspapers to provide necessary information, good models and management experiences. Publicize policies issued by the state and improve community awareness of them so that people understand that the management of water resources and hydraulic structures is in the interests of each person as well as each person’s responsibility.
3.6. Completion of mechanisms and policies on water
8 Deputy Director General, Department of Water Sources, Ministry of Agriculture and Rural Development of Viet Nam.
![]()
![]()
![]()