|
FAO GLOBAL INFORMATION AND EARLY WARNING SYSTEM ON FOOD AND AGRICULTURE
WORLD FOOD PROGRAMME |
|
Following a period of unfavourable rainfall distribution in December and January, particularly in the eastern and central parts of country, the Government of Zimbabwe requested a FAO and WFP independent evaluation. In response, a joint FAO/WFP Crop and Food Security Assessment Mission (CFSAM) visited the country between 14-18 June 2010, to conduct a condensed assessment of the 2009/10 cereal production and evaluate the overall food security situation to determine the food import requirement, including food assistance needs, for the current marketing year 2010/11 (April/March). In consideration of the technical support FAO and WFP provided to the Government for the First and the Second Round Crop and Livestock Assessments and the timing of the Mission, it was decided that a condensed CFSAM would be most appropriate.
During the course of the week the Mission received the full support and cooperation of the Ministry of Agriculture, Mechanization and Irrigation Development (MAMID), and benefited from valuable contributions and discussions with:
FAO Representative and technical staff
WFP’s Country Director and other staff
World Bank
UNICEF
FEWSNet
Grain Marketing Board (GMB)
ZIMSTAT (formerly known as the Central Statistics Office)
Ministry of Health and Child Welfare
Ministry of Finance
Zimbabwe Farmers Union (ZFU)
Reserve Bank of Zimbabwe (RBZ)
Millers/Traders (namely National Foods and Blue Ribbon Foods)
Zimbabwe Vulnerability Assessment Committee (ZimVAC).
The Mission based their assessment of national cereal production on the Second Round Crop and Livestock Assessment, conducted between 13 and 25 March 2010 by the Government and partner organizations, including FAO, WFP, FEWSNet and OCHA, and discussion with key institutions. Hence, only an evaluation and review of the methodology and production estimates were made by the Mission, and consequently no field assessments were conducted. Despite unevenly distributed precipitation in southern and eastern areas, an extensive input support programme by Government and partners contributed to an increase in maize production for the 2009/10 agricultural season by 7 percent, to 1.35 million tonnes. Moreover the programme supported an increase in the planted area to an historical high of 1.8 million hectares, reflecting a rise of 20 percent over last year’s level. However, national yields declined, primarily on account of the mid-season dry spell, with only A2 commercial farms recording an increase in productivity. National cereal requirements for food and non-food use for the 2010/11 marketing year are forecast at just over 2 million tonnes, against national availability of 1.66 million tonnes resulting in a net import requirement of 428 000 tonnes. The vulnerability assessment indicates 111 000 tonnes of food (cereal) assistance will be required. Assuming that is the amount for which there is no effective demand (i.e. lack of purchasing power by the vulnerable population), the rest of the demand can be considered as an effective demand. Given that the grain market is fully liberalized and private traders/millers/importers are free to import commercially, it is anticipated that commercial imports will cover the remaining deficit. In regards to cash crops, a decline in cotton and soya bean producer prices last season, had led to a decline in the area planted for these crops, along with sugar beans and sunflower, with many farmers opting to switch to maize production – which also partly accounts for an increase in planted area under maize.
Furthermore, the liberalisation of the economy and adoption of a multi-currency regime has for the time being significantly contributed to improving and stabilising the economic conditions, as well as increasing the supply of goods into the country since the end of 2008. The liberalisation of the grain market has enhanced the importance of commercial imports in meeting the national cereal requirements. However, limited capital inflows, lack of liquidity and high interests for short-term loans acts as constraints for increased investment in the farming sector and an expansion of commercial imports. This has had negative impact on grain processing, as well resulting in many millers operating merely at 10-30 percent of their total capacity.
The National Census of 2002 estimated Zimbabwe’s population as 11.635 million (as of 18 August 2002). Currently, the projection for 2010 by ZIMSTAT put population at 12.34 million with implicit year-on-year growth rate of 0.74 percent between 2002 and 2010. Given the high incidence of HIV and AIDS during these years the low net growth rate is understandable, although no specifics of these estimates were available to the Mission. It is not clear, however, how the impact of a second significant factor - out-migration - is taken into account in this estimate. Reportedly, there has been a significant amount of out-migration from Zimbabwe, particularly to South Africa and overseas, with the UK cited as the second most favourite destination. Two recent research papers1 indicate that South Africa hosts between 800 000 to 1 million Zimbabweans (2007), with the most recent paper estimating between 1 and 1.5 million (2010), but these estimates are indicative. A report by the International Organization for Migration (IOM) indicates that more than 314 000 Zimbabweans were assisted at the Beitbridge centre between 2006 and 2009 and over 57 000 migrants returned from Botswana were assisted at the Plumtree reception centre between June 2008 and June 2009. Furthermore, a recent UNDP2 paper states that the total number of Zimbabweans in the diaspora is over 3 million, while ZIMSTAT accepts a low figure of 350 000 as out-migrants since 2002. It is, therefore, conceivable that since 2002 the total number of emigrants has been significant; however, there are no reliable statistics available to accurately estimate this figure, with several different sources providing a wide range of estimates and no official census to verify the figures. Given the divergent estimates, an assumption of a more conservative estimate of 1 million would provide a national population of 11.34 million. For the purposes of this report, the Mission decided to use this figure for out-migration, giving a national population of 11.34 million. This is consistent with the previous CFSAM estimates and takes into consideration recent studies indicating a larger diaspora. This out-migration figure also seems to be consistent with conclusions derived during the Mission’s meetings.
Using the ZIMSTAT proportions at the national level, 69 percent of the population or 7.8 million are classed as rural and the remaining 3.5 million as living in urban/peri-urban areas.
After a period of unprecedented hyperinflation and severe economic decline, the adoption of a multi-currency regime in February 2009, as well as economic liberalization of certain sectors has contributed to an improved performance of the economy. As a result real GDP is estimated to have expanded by 4 percent in 2009, for the first time after 10 years of consecutive negative growth, succeeding a 14 percent contraction in the previous year. However, lack of liquidity in the economy, low and volatile capital inflows, as well as movements in the USD/Rand exchange rate, which affects Zimbabwe’s competitiveness and international investment position, will act as constraints for further economic improvement. The lack of liquidity is particularly harming private millers that require capital to import cereals3, with, for instance, Blue Ribbon Foods operating under a collateral management scheme as alternative mechanism to import wheat and maize. The Government is targeting GDP growth of 5.4 percent for 20104; however, the IMF has estimated that GDP will grow by 2.2 percent this year.
The Government is currently operating on a cash budgeting system, restricting expenditure to available cash resources. Anticipated revenue for 2010 is estimated to reach USD 1.4 billion, plus USD 810 million from cooperating partners, against the 2010 budget that indicates expenditure would reach USD 2.2 billion. Wage costs represent a large proportion of the Government’s expenditure; however, following the completion of the recent pay-roll audit, it is anticipated that wage bill will be reduced, allowing for the eradication of ‘ghost workers’, and freeing funds to be directed toward social and development programmes. The Government will continue to implement the Short Term Emergency Recovery Programme II (STERP), succeeding STERP I, which in board terms focuses on macro-economic stabilisation and social protection programmes, including social safety nets. The conversion to multi-currency system has rendered monetary policy less effective, affecting the operations of the Reserve Bank of Zimbabwe, while lending rates are currently at a comparatively high level restricting investment in capital and raising production costs, as well as restraining investment in the agricultural sector.
The country is still operating on a large current account deficit, and this deficit is expected to remain at a significant level in 2010, taking into account an expected increase in imports, given that the industrial sector is still highly dependent on imports. Export revenue from minerals is expected to strengthen if planned expansion projects are implemented, and the higher price of gold and platinum is sustained, with Government set to benefit from an increase in royalty rates set at 3.5 percent for precious metals in 2010. In regard to cash crops, despite an increase in production for tobacco, the lower prices (currently just below USD 3/kg, compared to USD 4/kg at the start of the season) will, to some extent, offset the higher quantity sold, and produce limited revenue. Furthermore, commercial imports of cereal are anticipated to cover about three quarters of the national cereal deficit. The trade deficit is forecast at USD 1.397 billion for 2010.
The economy continues to suffer from shortages of fuel, electricity, fertilizer and spare parts for machinery and irrigation equipment, all of which are imported. Furthermore, the fragile banking sector, lack of strong property rights and poor investment climate combines to further constrain an expansion of agriculture investment.
| 2001 | 2002 | 2003 | 2004 | 2005 | 2006 | 2007 | 2008 | 2009 |
2010 (projected) |
|
| Real GDP change (% year on year) | -8.4 | -5.6 | -10.6 | -4.2 | -7.7 | -4.6 | -5.5 | -14.5 | 4.0 | 2.2 1/ |
| Consumer price inflation; annual average (%) | 75 | 135 | 385 | 381 | 267 | 1034 | 12 563 | 56 billion | 6.5 /1 | 5 /1 |
| Total Exports (USD million) | 2 114 | 1 802 | 1 670 | 1 684 | 1 606 | 1 533 | 1 804 | 1 633 | 1 625 | 2 083 |
| Total Imports (USD million) | 1 791 | 1 821 | 1 778 | 1 989 | 1 994 | 2 000 | 2 113 | 2 630 | 3 232 | 3 480 |
| Trade Deficit (USD million) | -323 | 18 | 108 | 305 | 388 | 467 | 310 | 997 | 1 607 | 1 397 |
| Total external debt (USD billion) | 3.6 | 3.9 | 4.5 | 4.8 | 4.3 | 4.7 | 5.3 | 5.8 | 7.1 | 7.6 |
Following the adoption of the selected foreign currencies as legal tenders in the country, inflation rates have been reduced significantly, with the national Consumer Price Index increasing by only 1 percent since the abandonment of the Zimbabwean dollar (February 2009) and May 20105. However, following the deflationary period up to May 2009, pressure on prices has been building, with rising fuel costs, utility charges, wage rates and the depreciation of USD against the Rand, causing a rise in import prices in US dollar terms. Currently, inflation for 2010 is forecast at 5 percent, but it is anticipated that the inflation rate may exceed this level. Furthermore, if the shortage of foreign currency continues and the limited currency moves out of the country to pay for imported goods, inflation, and economic problems could return.
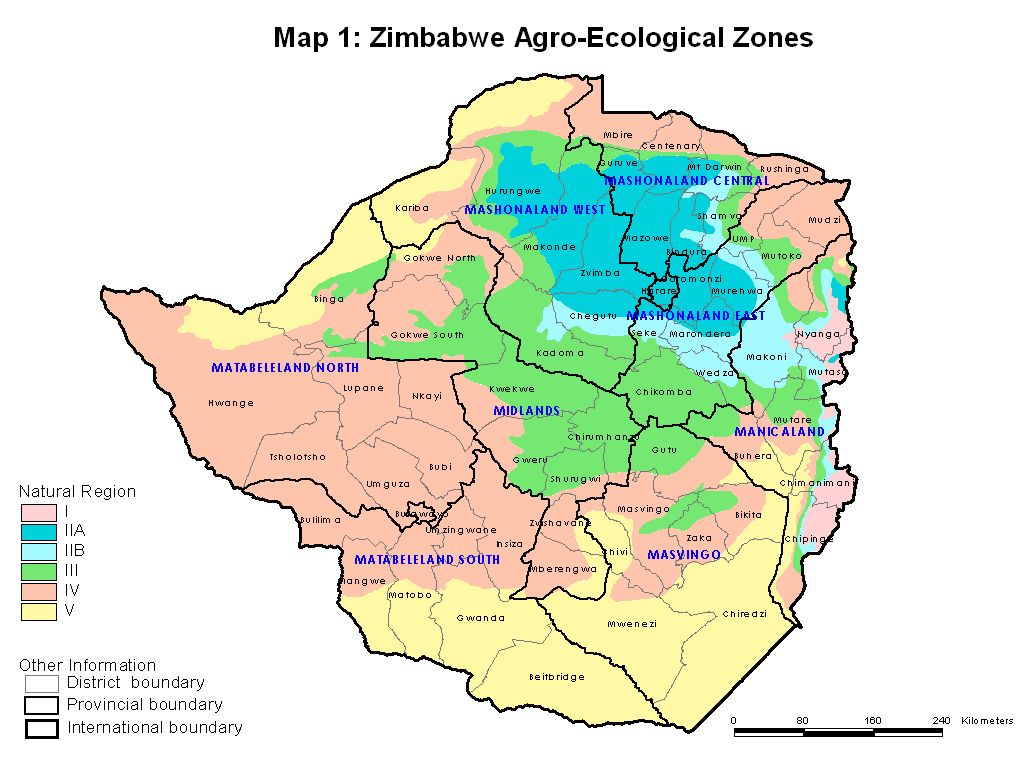
Zimbabwe’s land is divided into five natural regions on the basis of soil type and climatic factors (see Map 1). Natural regions I, II and III are suitable for intensive crop cultivation and livestock raising, while regions IV and V offer limited scope for crop agriculture but are suitable for livestock raising on a large scale. The bulk of Mashonalands (West, East and Central), Midlands and Manicaland Provinces are under regions I, II and III, while Matabelelands (North and South) and Masvingo Provinces are under natural regions IV and V. The three Mashonaland Provinces constitute the breadbasket of the country. Zimbabwe’s farming sector can produce, and has produced in the past, exportable surpluses of maize and certain other food crops. But severe constraints on prime land use have resulted in less than full capacity utilization of its natural resources. However, for the 2009/10 agricultural season it was reported that fallow land was brought under cultivation.
A strong negative trend in production of national maize, which accounts for the major part of food production, over the last 15 years is evident (see Figure 2). The reasons for the downward trend, before the fast track land reform, include a gradual switch by the large-scale commercial farms from maize, which became a GMB-controlled crop, to other non-controlled crops such as tobacco, cotton, among others. A more recent decline is due to the structural change precipitated by land tenure policies, lack of investments/funds domestically and externally in agriculture sector, and overriding economic deterioration. The large-scale commercial sector now produces less than 10 percent of the national maize output. Some experts also argue that environmental factors such as increased frequency of drought, combined with maize production being on more marginal lands of the communal farms with little or no fertilizer, can explain some of the long-term negative trends. Wheat production has also declined dramatically since the mid-1990, when production exceeded a quarter of million tonnes. High input costs, lack of liquidity and unreliable (and expensive) electricity supplies to power irrigation pumps are all attributed to the decline in wheat production. Moreover, the competitive prices on the international market, and the current liberal trade regime, makes domestic wheat production less economical viable, given the current high production cost.
Source: AGRITEX
However, since the economic reforms farmers are better equipped to plan and prepare for the season, as a result of the comparatively steady inflation rate. In conjunction with the large input support programme, that significantly increased the availability of inputs, production increased over the last two agricultural seasons, albeit from a very low base in 2007/08, and the current harvest is approximately 15 percent higher than the ten-year average (2000-2009). Although the agriculture sector is improving, limited liquidity as well as weak banking system is still presenting an obstacle for rural farmers to make further investments.
Rains began earlier than normal for the 2009/10 season, and during the first two months (October-November) of the season were well distributed throughout the country. From mid-December precipitation levels varied considerably, with crop production in southern and eastern provinces negatively affected by a prolonged dry spell in December and January. In particular, Manicaland and Masvingo provinces were the worst affected, with rainfall levels 40 and 50 percent below the average (1996-2009)6, respectively, during the two aforementioned months. The northeast (Mashonaland East province) of the country, in addition, experienced a mid-season dry spell; however, in western regions rainfall levels were sufficient, supporting an increase in maize production over last season’s harvest (see Figure 3). Heavy late rains recorded in April led to some localized water-logging and cob-rotting, lowering yields; concurrently, rains probably benefited some late planted maize crops. Confirming the impact of rain distribution over the season, the Meteorology Department the WRSI (water-requirement satisfaction index) indicates that crop production north of the watershed was average to good, while crop yields and production in northeast and southern provinces were mediocre to failure.
A large scale input programme for the 2009/10 season, predominantly targeting smallholder farmers, assisted in supporting a 20 percent increase in the area planted under maize. This is the largest area planted with maize over the last 30 years (1980-2010). In total, 139 799 tonnes of fertiliser (top dressing and basal) and 22 372 tonnes of maize seed were distributed through input programmes (please see Table 2), and compared the previous season the availability and access to inputs improved significantly.
The 2009/10 input assistance programme, jointly formulated by AGRA, FAO, WFP and IFAD, sought to address the immediate short-term needs related to food security and agricultural recovery. The proposed programme was to target 600 000 households and aimed to provide seeds, fertilizers and basic extension services, at a cost of approximately USD 70 million. An estimated 738 000 households’ benefited from the humanitarian community’s support programme, providing enough inputs to cover an area of 0.25 to 0.5 ha per households. It is estimated the seed distributed was sufficient to cover 51 percent of the planted area with maize, with over 85 percent of communal wards receiving some assistance, while the remaining area was planted using carry over seed, retained grain, purchases and other sources. The number of beneficiaries that received input assistance is the highest of the last five years and demonstrates the growing support from the humanitarian sector. On average each household received about 9 kg maize seed, 50 kg top dressing and 19 kg basal fertilisers.
The Government’s input support scheme was directed towards all agricultural sectors and amounted to USD 350 million. The support programme component that targeted commercial farmers was facilitated through a credit system, with farmers accessing loans (to be repaid by July 2010) in the form of vouchers, which could then be used to access inputs from GMB depots – the farmers were required to apply for letters of credit from banks. This system has auxiliary benefits, in regards to recuperating market functions in the banking sector. In addition, the Government supported farmers, including Small Scale, Old Resettlement, A1 and communal sectors, which were not captured in the donor supported programme. Quantities of the subsidized inputs under this scheme were limited: 50 kg compound D, 50 kg ammonium nitrate, 10 kg maize (or 5 kg sorghum) for communal farmers. While A1, Old Resettlements and small scale commercial farmers could purchase up to 150 kg compound D, 100 kg ammonium nitrate and 20 kg maize seed (or 5 kg sorghum seed). Please see Table 3 for the subsidized prices.
| Maize seed (tonnes) | Compound fertilizer (tonnes) | Top dressing (tonnes) | |
| Government | 15 872 | 41 397 | 31 652 |
| Humanitarian community | 6 500 | 14 000 | 37 500 |
| EU (Farmer Unions) | 7 250 | 8 000 | |
| Total | 22 372 | 62 647 | 77 152 |
| Input | Subsidized Price | Normal Price |
| Fertiliser | USD 7/50kg | USD 27/50kg |
| Maize seed | USD 5/10kg | USD 10/10kg |
| Sorghum seed | USD 3/10kg | USD 6/10kg |
The distributions of inputs, in particular seeds, were delivered in timely manner. Furthermore, although compound fertiliser supplies more abundant this year, low industrial capacity for the production of top-dressing fertiliser constrained national supplies. At the beginning of the harvest, market prices for OPV and hybrid maize seeds were USD 30-40 and USD 50-70 per 25kg bag.
There were no major outbreaks of pests during the cropping season. Minimal or insignificant damages were caused due to common pests including stalk borers, army worms, aphids and boll worms.
Total area harvested for maize reached an historical high of 1.8 million ha (please see Table 4). This represents a 20 percent growth over the previous season. In terms of distribution of the planted area under maize, communal areas still represent the largest sector, but there was a proportional increase in A2 and a corresponding fall in the large scale commercial farming (LSCF) sector. Furthermore, given the early start of the rains and with an even distribution of precipitation for the first two months of the season, there was an extended planted period in some provinces, particularly Mashonaland West (area planted expanded by 35 percent over last season’s level), which is cited as an additional factor attributed to the expansion. The stability of the economy also enabled farmers to prepare and plan for the 2009/10 season, due to the lower risks that are associated with steep inflation rates. In addition, it was stated by MAMID that farmers increased their acreage through utilising previous fallow arable land.
The area under wheat is expected to decline for the third consecutive season. By June 7 173 ha had been planted, which is slightly below area planted at the same time last year, with 10 647 ha having been prepared, against 18 200 ha planted in 2008/09. Erratic electricity supply and cheaper wheat imports have led to the reduction in wheat production.
This season saw a reduction in the area under cotton, primarily on account of a reduction in producer prices paid to farmers last season, by 23 percent to 261 191 ha. In contrast, the area planted with tobacco expanded by 41 percent due to strengthening prices and improved input support programmes. Soybean, sugar bean and sunflower saw a significant reduction in planted area, while groundnut planted area grew by 20 percent to 424 532 ha. The contraction in area planted for some cash crops also contributed to the expansion of maize area, with farmers opting to switch to the cereal crop.
| 2000 | 2001 | 2002 | 2003 | 2004 | 2005 | 2006 | 2007 | 2008 | 20091/ | 20101/ | |
| Area (000 ha) | 1 374 | 1 240 | 1 328 | 1 352 | 1 494 | 1 730 | 1 712 | 1 446 | 1 722 | 1 507 | 1 803 |
| Yield (t/ha) | 1.18 | 1.23 | 0.46 | 0.78 | 1.13 | 0.53 | 0.87 | 0.66 | 0.27 | 0.82 | 0.74 |
| Production (000 t) | 1 620 | 1 526 | 605 | 1 059 | 1 686 | 915 | 1 485 | 953 | 471 | 1 243 | 1 328 |
Cereal yields declined this season relative to last, as a result of a combination of the inadequate mid-season rainfall and a delay in the distribution of fertilisers. Fertiliser use was not sufficient to cover all the planted areas; therefore farmers practiced extensive farming methods rather than intensive. Nationally, maize yields decreased to 0.75 tonnes/ha, from 0.82 tonnes/ha recorded last season. Yields decreased in all farming sectors, with the exception of A2 commercial farms, which recorded an average increase of 6 percent over the previous season. Nationally, yields are just below the ten-year average (2000-2010) of 0.87 tonnes/ha. Similarly, millet and sorghum yields fell.
In regard to cash crops, yields decreased for all crops apart from soya bean. Cotton and tobacco yields fell to 0.66 tonnes/ha and 1.27 tonnes/ha respectively, but for tobacco this fall was compensated by a rise in the area planted. Groundnuts, sugar beans and sunflower yields dropped by approximately one-third relative to last season’s level, on account of the erratic rainfall.
As mentioned above, the involvement of FAO and WFP country offices, in addition other partner institutions7, in the Government’s Second Round Crop and Livestock Assessment as well as the timing of the Mission meant that a condensed CFSAM was conducted and no field visits were made. The Mission held extensive meetings with the relevant organisations and Government departments that were involved with the assessment to review the methodology and adjust/modify the data where necessary. It was determined that the methodology implemented and the extensiveness of the assessment was reliable and balanced for generating estimates for early warning purposes. However, this should not replace the proper statistical sampling and survey methods. Finally the Mission concluded that national the cereal production estimates seem reasonable and provide good indication of the domestic availability of cereals in the country. A small adjustment was made to maize estimates to incorporate peri-urban/urban production, which was not accounted for in the national production figure (see footnote under Table 5).
For the Second Round Crop and Livestock Assessment AGRITEX received technical support from FAO, WFP, FEWSNet and the Farmers Unions. In total, over 4500 national, provincial, district and ward level extension staff (from AGRITEX, Livestock Production and Development and Department of Veterinary Field Services), from the all eight provinces, received training in crop and livestock assessment methodologies, including a yield estimation and area measurement component, for both food and non-food crops. .On average each team spent two days per district, assessing production through field observations, farmer interviews, as well as actual measurement of crop samples. Given the timing of the assessment, cob measurements were taken by measuring girth and length by hand, it is recommended that tapes are procured and used for subsequent crop assessments to ensure consistencies in measurements. Measurements were taken from farms deemed to have a good, average or poor harvest and results were then extrapolated for the area within the district. The timing of the assessment also meant that crop-cuttings were not made for yield measurements. In instances where production estimates indicated anomalies, the area was cross-checked and final production figures adjustments were made at the district level.
National maize production is estimated to be 1.35 million tonnes, representing a 7 percent increase over last year’s harvest, with an average yield of 0.7 tonnes/ha from 1.8 million ha (please see Table 5), with approximately 1.2 million ha from the communal sector. The improved harvest this year is on account of the large expansion in area under maize, by 20 percent. Significant increases in central and western provinces (Mashonanland West – largest proportion of the maize harvest, Midlands and Matabeleland North) compensated for a reduction in production recorded in eastern and southern provinces that were affected by the mid-season dry-spell. Masvingo recorded the largest fall in production in comparison with the previous season’s harvest, by 60 percent, due to the inadequate rainfall stretching from December to February.
| Area (ha) | Yield (t/ha) | Production (t) | |||||||
| 2008/09 | 2009/10 | %Chg | 2008/09 | 2009/10 | %Chg | 2008/09 | 2009/10 | %Chg | |
| Mashonaland Central | 173 123 | 179 839 | 4 | 1.01 | 1.24 | 23 | 174 691 | 223 516 | 28 |
| Mashonaland West | 194 910 | 263 621 | 35 | 1.26 | 1.28 | 1 | 246 556 | 336 855 | 37 |
| Mashonaland East | 241 202 | 243 995 | 1 | 0.77 | 0.75 | -3 | 186 161 | 181 994 | -2 |
| Manicaland | 219 453 | 237 052 | 8 | 0.77 | 0.50 | -35 | 168 936 | 118 658 | -30 |
| Midlands | 300 464 | 408 569 | 36 | 0.67 | 0.68 | 1 | 202 183 | 278 747 | 38 |
| Masvingo | 207 458 | 229 887 | 11 | 0.68 | 0.24 | -64 | 141 072 | 56 201 | -60 |
| Matabeleland North | 75 168 | 100 936 | 34 | 0.69 | 0.73 | 5 | 51 821 | 73 311 | 41 |
| Matabeleland South | 95 919 | 139 643 | 46 | 0.74 | 0.42 | -44 | 71 145 | 58 290 | -18 |
| Total of provinces | 1 507 697 | 1 803 542 | 20 | 0.82 | 0.74 | -11 | 1 242 565 | 1 327 572 | 7 |
| Peri-urban/urban 1/ | 7 500 | 7 500 | 0 | 3.3 | 3.3 | 0 | 25 000 | 25 000 | 0 |
| ZIMBABWE | 1 515 197 | 1 811 042 | 20 | 0.84 | 0.75 | -11 | 1 267 565 | 1 352 572 | 7 |
Total small grain production is estimated at 193 887 tonnes (sorghum 131 644 tonnes and millet 62 243 tonnes). While wheat production has declined drastically since 2006, and this decline has not been reversed for the 2010 winter crop (see Table 6). Estimates indicate a crop of 30 000 tonnes, with high cost of inputs, poor maintenance of irrigation facilities and inconsistent electricity supplies, contributing to lowering the area prepared for wheat. Furthermore, the availability of lower cost wheat imports is an additional factor that deters an increase in domestic wheat production. As of early June, only 7 173 ha had been planted, which is 32 percent below the area planted at the same time last season. Fertiliser is being sold at GMB depots for USD 15/kg. Wheat production forecast was discussed and confirmed with AGRITEX staff.
| Area (ha) | Yield (t/ha) | Production (t) | |
| 1996 | 47 843 | 5.5 | 263 134 |
| 1997 | 45 495 | 5.6 | 254 772 |
| 1998 | 44 022 | 5.5 | 242 121 |
| 1999 | 47 438 | 5.5 | 260 909 |
| 2000 | 42 551 | 5.4 | 229 775 |
| 2001 | 37 269 | 5.3 | 197 526 |
| 2002 | 39 000 | 5.0 | 195 000 |
| 2003 | 40 809 | 3.0 | 122 427 |
| 2004 | 70 585 | 3.5 | 247 048 |
| 2005 | 65 454 | 3.5 | 229 089 |
| 2006 | 67 201 | 3.6 | 241 924 |
| 2007 | 49 707 | 3.0 | 149 110 |
| 2008 | 10 300 | 3.0 | 31 000 |
| 2009 | 18 201 | 2.0 | 36 400 |
| 2010 (forecast) | 15 000 | 2.0 | 30 000 |
Table 7 provides a synopsis of Zimbabwe’s food cereal production for 2010 compared with last season (barley has not been included as it is used primarily for the brewing industry.) Maize, sorghum, millets and wheat are expected to provide a total of 1.578 million tonnes of grain, representing a 2 percent rise over last year’s output. Production will therefore satisfy approximately three quarters of the national cereal requirement of about 2 million tonnes.
| Area (000 ha) | Yield (t/ha) | Production (000 t) | ||||
| 2008/09 | 2009/10 | 2008/09 | 2009/10 | 2008/09 | 2009/10 | |
| Maize | 1 508 | 1 804 | 0.82 | 0.75 | 1 243 | 1 354 |
| Sorghum/Millet | 636 | 630 | 0.42 | 0.31 | 270 | 194 |
| Wheat | 18 | 12 | 2.00 | 2.50 | 36 | 30 |
| All cereals | 2 162 | 2 446 | 0.72 | 0.65 | 1 549 | 1 578 |
3.8 Cash and other crops
There was an increase in tobacco area relative to the previous season, that compensated for the reduction in yield, with production estimated at just over 85 000 tonnes. For all other cash crops, including cotton, production declined compared to last year, due to a combination of lower yields and a contraction in area planted, with the exception of groundnuts (please see Table 8 and 9).
| Year | Cotton | Tobacco | ||||
| Area (000 ha) | Yield (t/ha) | Production (000 t) | Area (000 ha) | Yield (t/ha) | Production (000 t) | |
| 2000/01 | 397 | 0.84 | 333 | 76 | 2.65 | 202 |
| 2001/02 | 229 | 0.85 | 195 | 71 | 2.33 | 166 |
| 2002/03 | 282 | 0.85 | 240 | 54 | 1.51 | 82 |
| 2003/04 | 389 | 0.85 | 331 | 41 | 1.58 | 65 |
| 2004/05 | 350 | 0.56 | 196 | 56 | 1.33 | 75 |
| 2005/06 | 300 | 0.86 | 258 | 27 | 2.03 | 55 |
| 2006/07 | 354 | 0.84 | 297 | 53 | 1.50 | 79 |
| 2007/08 | 431 | 0.52 | 224 | 62 | 1.10 | 68 |
| 2008/09 | 338 | 0.73 | 247 | 48 | 1.33 | 64 |
| 2009/10 | 261 | 0.66 | 172 | 67 | 1.27 | 93 /1 |
| Crop | 2008/09 | 2009/10 | ||||
| Area (ha) | Yield (t/ha) | Production (t) | Area (ha) | Yield (t/ha) | Production (t) | |
| Soya | 85 227 | 1.36 | 115 817 | 48 010 | 1.46 | 70 256 |
| Groundnut | 354 636 | 0.61 | 216 619 | 424 532 | 0.44 | 186 214 |
| Sugar bean | 52 265 | 0.71 | 37 329 | 30 715 | 0.56 | 17 200 |
| Sunflower | 79 212 | 0.49 | 39 018 | 38 293 | 0.36 | 13 960 |
Livestock numbers are difficult to assess in Zimbabwe as dipping tanks are normally used as census points and their use is very infrequent. Since the Land Reform Fast Track programme in the early 2000s, there was a general shift towards greater smallholder cattle ownership and a reduction in the number of large commercial herds; correspondingly there was also a decline in dairy production.
However, the 2009/10 season marked an improvement in livestock conditions compared to the previous season, although, pasture conditions in Matabeleland South and Masvingo provinces will not be sufficient to last until the beginning of the next rainy season, due to the poor rains received. Dairy production grew this year attributed to improved economic conditions, and this is illustrated by an increase in production of approximately one third for January and February 2010, compared to same period last year. Despite this expansion, milk production is still well below levels recorded in 2000 and the erratic power supplies increase the cost of production, particularly harming small-scale producers. Furthermore, it was reported that higher grade cattle were in short supply, and that prices of feed and supplementation was high.
This season, dipping frequency has improved with the Department of Veterinary Field Services procuring enough dip chemical to last the whole year. FAO, in addition, supported the provision of dipping chemicals, providing a total of 120 tonnes of acaricide. In regards to diseases, incidences of anthrax were reported in all provinces and measures were taken to control its spread. Foot and mouth disease was detected in Masvingo province in December, but it has been brought under control. While tick–borne diseases - red water and heart water - were reported in eastern and southern provinces. There were also cases of Newcastle disease in areas of Mashonaland East and Masvingo; in addition, incidents of rabies were reported in grazing animals. Uncontrolled movement tick infested cattle contributed to the spread of dermatophilosis from north-western provinces.
Until March 2009 the grain market was tightly controlled by the Government through the Grain Marketing Board (GMB), a state parastatal. Maize and wheat, and to some extent other commodities, were officially traded through GMB. No movement of these grains was allowed with the exception of small quantities (for example 150 kg) beyond what was referred to as “farmer-to-farmer” sales. Although some grain did pass through informal channels especially when there were major shortages of maize and price discrepancies between formal and informal channels were considerable. This structure instilled subsistence farming, with limited surplus production for sale.
Following the market liberalisation reforms in March 2009, which has made a positive contribution to national food availability and security, GMB’s main function is now that of buyer of last resort, as a means to help maintain floor prices to support domestic producers. The removal of duties and import restrictions has also meant that monitoring imports has become more difficult. However, private millers/traders are now performing a more prominent role in the importation of cereals to meet the national deficit. It is expected that large millers will each import between 5 000 to 10 000 tonnes of maize per month during the current marketing year (April 2010-March 2011), and consequently this quantity is expected to satisfy import requirements that are backed by effective demand. However, domestic millers are now facing further competition from private traders importing cheaper flour products, which were priced at USD 28 per 50 kg (as of June) compared to the domestically produced flour retailing for USD 32.
In regards to the function of GMB, it is now expected to compete with other traders; however, a severe constraint affecting the institution’s capacity to function effectively is a lack of capital and enormous size of its workforce adding to very high overhead costs, for example, currently GMB has over 3 000 employees. The Government recently released USD 1.6 million in June 2010 to assist GMB to clear arrears with farmers who had not been paid for maize deliveries from May 2010. At the start of the season, GMB set the producer price at USD 325/tonne, but this was recently reduced by USD 50. At the current level (USD275/tonne), however, it is still higher than the prevailing market price, despite the parastatal’s mandate of being the buyer of last resort. The limited liquidity available to GMB also creates problems in making immediate payment to farmers, thus providing an opportunity for private traders, who have better maintained transport fleet to access rural locations, to offer immediate cash transactions, but at a lower rate to what GMB offers, at the detriment to the producer. Furthermore, farmers are burdened with the cost of transporting their produce to GMB depots, which presents an additional problem for farmers wanting to sell their maize to GMB. Last marketing year GMB procured 63 000 and 20 561 tonnes of maize and wheat, which is higher than the preceding season but 63 and 86 percent, respectively, below quantities purchased in 2007.
As can be seen from Figure 4, the maize price fluctuated between USD 0.05 and USD 1.15/kg between October 2005 and January 20098. Prices were often higher in Bulawayo compared to the other cities. Between July 2008 and December 2008, price levels increased tremendously even in the US dollar conversion. This corresponds with the soaring of cereal prices globally but the rise in Zimbabwe was skyrocketing due to the widespread shortages of maize in the market. Since December 2008, price decreases have been equally dramatic reaching a level below USD 0.30/kg by April 2009. Since May 2009, maize prices in the major markets have been relatively stable between USD 0.23/kg (USD 4/bucket) and USD 0.34/kg (USD 6/bucket). Prices started rising again in December 2009 to reach their highest levels in January-March 2010, reflecting the scarcity of maize in the markets. Around that lean time, maize grain had completely disappeared from the Bulawayo and Mutare markets for several weeks. This maize price level is still much above the prices during 2006 and 2007.
Based on the above graph, it seems that maize markets are well integrated, with the exception of Bulawayo, located in a deficit production area, where periodic price spikes are observed.
On the other hand, maize meal was continuously available in the above markets (with the exception of Mutare), from millers and from importers. The price for unrefined maize meal in Harare fluctuated between USD 0.40 and USD 0.49/kg between May 2009 and May 2010.
The price of maize meal in Harare was more stable over the last 12 months than in Bulawayo (and also in Masvingo which was not included in the graph). In spite of the fluctuations during the year, the levels in May 2009 are very similar to those in May 2010. Over the course of the last 12 months, the price of maize meal shows little or no correlation9 with the price of maize meal in the two largest urban centres of the country. In Masvingo and Mutare the prices of grains and meal seem to be somewhat correlated10.
Based on key informant interviews, major basic food commodities such as maize meal (mealie meal), maize grain, and cooking oil are available in all rural markets. Both locally produced commodities and imported commodities (e.g. sugar, rice, etc.) are available. Due to the dollarization11 since early 2009, formal trade has recovered. Small-holder rural farmers usually access cash through sales of surplus production of maize, cash crops (especially tobacco) or livestock. In cotton areas like the Midlands, sales have been low and cash is reportedly still a problem. Bartering, grain for milling, is still common way to cover milling costs in rural areas.
The price of livestock recovered after the desperate levels observed in late 2008/early 2009. Based on the 2010 ZimVAC report, a head of cattle in May 2009 went for USD 230, in October 2009 the price was USD 350 and in May 2010 for USD 250. Nationwide a slight increase has been observed with the exception of Manicaland and Mashonaland East provinces where prices are now 10 percent lower than last year. For the time being the terms of trade of the livestock producers are normal, however, this may change in the deficit area as the hunger season approaches.
Zimbabwe’s cereal supply/demand balance for the 2010/11 marketing year (April/March) is shown in Table 11 and is based on the production estimates presented in earlier sections and the assumptions/justification provided below.
Population – As described in Section 2, the population for 2010, for the purposes of this report, is assumed to be at 11.336 million.
Stocks – Following improved cereal production for the 2008/09 season, the GMB held stock, as of 1 April 2010, was 39 000 tonnes for maize and 20 561 tonnes for wheat, which compares favourably to negligible levels recorded last year. Privately held stocks by traders have increased, in part due to the liberalized trading structure, with stocks of maize and wheat estimated to be around 10 000 and 20 000 tonnes respectively.
Human consumption - Per caput cereal consumption of 151 kg per annum, distributed across cereals as follows: maize 120 kg, millet and sorghum 13 kg, wheat 16 kg, and rice 2 kg, is used this year. The total is lower by 7 kg than last year, with a reduction in consumption of millet and sorghum, reflecting the lower harvest and convergence to historical consumption levels. Over the last several years the apparent consumption of wheat, more in line with the national production, has gone down significantly. However, given the high level of imports, including food aid, over the preceding two years and the lower of international prices of wheat compared the previous two years, it is expected that wheat consumption will remain similar during this marketing year compared to last. In comparison to other Southern African countries (please see Table 10), the consumption levels are also comparable, with Malawi having the largest per caput maize consumption. At 151 kg of cereals per caput/annum, about 66 percent of the minimum calorie needs of a person (at 2 100 kcal/day) would be met, on average. The remainder, as usual, is expected to come from other foods such as potatoes, sweet potatoes, beans, groundnuts, meat, poultry, fish, vegetables and wild foods.
| Maize | Sorghum/Millet | Total Cereal Consumption1/ | |
| Malawi /3 | 133 | 4 | 146 |
| Mozambique /2 | 64 | 17 | 123 |
| Zambia /3 | 83 | 5 | 104 |
| Zimbabwe /2 | 120 | 13 | 151 |
Feed use - Given the large and widespread shortages of grains, in general, use of cereals for animal feed is quite limited. Moreover, livestock numbers on commercial farms have significantly declined over the past years. However, for the use of dairy cattle and poultry the quantity of maize to be used as feed is required. Thus given the improved domestic production this year, compared to the year before, the amount of grain to be used as feed during this marketing year is estimated at 150 000 tonnes. It should also be noted that a ban on importation of poultry at the beginning of 2010, is likely to increase demand for feed in medium to long-term, on the assumption that the ban remains in place.
Seed use – The use of hybrid maize seed produced by local seed companies or imported has gone down due to their high cost and need for foreign currency. When this seed is not available on time many farmers resort to using retained grain. Seed requirements are calculated by using the recommended seed rates and forecast area to be planted next year and are included in the total utilization. Seed rates used are – 25 kg for maize, 10 kg for sorghum and millets and 125 kg for wheat. Some 20 percent is added to account for potential replanting.
Post-harvest losses – These are assumed at 5 percent of production for all grains. This is the same rate as the last three years. This rate, which is lower than that assumed more than three years ago, is used because of the drastic reduction in cereal production in the last few years. It is recognized that the losses at individual farm level vary a great deal depending on the storage conditions but, given a significant shortage of the domestic production and much shorter duration of storage, this minimal percentage loss is considered appropriate.
Cereal import capacity – Given the liberalisation of the grain market, the private sector is expected to continue to play a major role in the importation of maize (as whole grain or milled), wheat (grain and flour) and rice. The major miller/trading company in the country is National Foods. It has significant storage and milling capacity in Harare, Bulawayo, Masvingo, Gweru and Mutare. Similarly, Blue Ribbon Foods, another milling and trading company also has significant capacity, but both are operating at about 10 percent of their milling capacity. Both of these millers are planning to procure on average 5 000-10 000 tonnes of maize and wheat each per month for the current marketing year. Spar, OK and TM, all grocery chain operators, are also importing mealie meal and cereal flour to satisfy the national demand, as well as bakers. The biggest problem for all of them is financial liquidity, with Blue Ribbon Food operating a collateral management system with a South African company to enable them to import grains. In consideration of the removal of market restriction, the role of GMB is expected to focus on local procurement and distribution (GMB did not import maize in previous marketing year). Furthermore, given their infrastructure and vast network, they may be able to cater for certain niche markets, either as a private or public importer. In conclusion, it is anticipated that the private sector will be able to meet the domestic cereal requirements12. However, a slowdown in the economic recovery and a further depreciation of the USD against the Rand will have a bearing on the private sector’s import capacity.
| Maize | Sorghum-Millet | Wheat | Rice | All Cereals | |
| Domestic Availability | 1 401 | 194 | 67 | 0 | 1 661 |
| Opening stocks | 47 | 0 | 37 | 0 | 84 |
| Total production 2/ | 1 354 | 194 | 30 | 0 | 1 577 |
| Utilization | 1 651 | 194 | 221 | 23 | 2 089 |
| Food use | 1 360 | 147 | 181 | 23 | 1 712 |
| Feed use | 150 | 0 | 0 | 0 | 150 |
| Seed use | 54 | 6 | 2.7 | - | 63 |
| Losses | 68 | 10 | 2 | - | 79 |
| Closing stocks | 50 | 0 | 35 | - | 85 |
| Cross-commodity substitution | -31 | 31 | - | - | 0 |
| Total Import Requirements | 251 | 0 | 154 | 23 | 428 |
| Food aid requirement 3/ | 55 | 0 | 55 | 0 | 111 |
| Residual commercial imports | 196 | 0 | 99 | 23 | 317 |
With the resulting supply/utilization figures presented in Table 11, there remains an uncovered national cereal deficit of about 111 000 tonnes required to cover the needs of the vulnerable population who lack purchasing power to access food from the market. This is further discussed in detail in the following sections.
Household food security in general improved markedly in 2009 as compared to previous years, mainly due to the improved production in most areas as a result of a better 2008/09 harvest and because of the liberalisation and stabilisation of the economy, making more goods, food and cash (mostly USD and Rands) available and leading to growing confidence in the economy. Production at household level slightly improved thanks to better availability and access to seeds and fertilisers which resulted in larger plots for subsistence farmers. However, in many areas in Masvingo, Matabeleland South and North and Manicaland provinces the poor rainfall resulted in crop failure. The early 2009 change in policies related to movements of food and use of foreign currencies has resulted in improved availability of cereals in local markets. However, prices remain comparatively high for most households who have only a low income and poor access to cash. In spite of the economic growth during 2009, the economy is still in a poor state, with high food prices, unemployment, low wages and lack of access to foreign currency. Government’s capacity to import food to satisfy aggregate domestic requirement will continue to be restricted by shortages of foreign exchange, however, thanks to the liberalization private importers can satisfy this demand which will increase once household stocks are finished as most rural farming households did not produce enough to last through to the next season. General poverty and chronic food insecurity has led to reduced diversity of household consumption (see below) and has contributed to increased prevalence of chronic malnutrition young children. Another important compounding factor is HIV and AIDS which has affected production (labour) and access (increased health expenditure and reduced income) at the household level and food utilization for the individual. Poor water and sanitation and healthcare related issues also provide an important backdrop to the chronic food insecurity.
The economic decline has been halted, but the situation is still far from the pre-crisis level. The 2009 improved situation (better harvest and effective measures against the hyperinflation crisis) came after two consecutive years of very poor production where most rural households struggled to survive, so the after effects of long term food insecurity are still lingering. Household currently affected by drought or other shocks still lack resilience.
Rural provinces
The main livelihoods in the different provinces and districts are defined by the agro-ecological zones depicted in Map 1. At one extreme, the districts in Matabeleland South fall in Agro-ecological Zones IV and V and those in Matabeleland North fall predominantly in Zone IV. Livestock dominates the livelihoods in the two provinces. At the other extreme, the Mashonaland Provinces (East, West and Central) have large tracks falling in Zone II (A & B) that are suited to crop production. Manicaland has tracts of Zone I and Zones IIB suitable for crop production and patches of Zones III, IV and V that support mixed agricultural production. Masvingo Province shares some characteristics of Matabeleland (Zones IV and V), but with patches of Zone III. Meanwhile Midlands Province lies mainly in Zones III and IV.
In general, crop production (food and cash crops), livestock rearing or a combination constitutes the primary livelihoods in the rural provinces. These livelihoods options in turn define most of the secondary livelihoods options – such as employment on commercial farms and game reserves. The existence of mineral deposits and mining in some provinces (e.g. Masvingo, Mashonaland East, Midlands, and Mashonaland West) and game ranging (e.g. in Matebeleland North and South) provide alternative livelihoods and the thrust of coping strategies available to households in the different provinces.. They are also discussed in details below and form an important factor in the analysis of the food insecurity situation.
Urban and peri-urban areas
About 30 percent of Zimbabwe’s total population lives in urban and peri-urban areas. An estimated 60 percent of this urban population is concentrated in two urban provinces of Harare and Bulawayo. The remaining 40 percent live in the main towns of the rural eight provinces and in peri-urban districts. Agriculture continues to be one of the important sources of livelihoods for the majority of households in the peri-urban and high density areas after petty trading, cross border trading and self employment. In the January 2009 urban assessment, 56 percent of the interviewed households grew maize during the 2008/09 agricultural season, with the highest proportion of households in Mashonaland Central (82 percent) and the least in Matabeleland South (30 percent). On performance of the maize crop, 65 percent of the households reported that their maize crop was in a better condition this year than same time last year.
The proportion of households reporting having someone who supports them from time to time declined from 28 percent in 2006 to 19 percent in 2009 (ZimVAC Jan 09). Despite the economic hardships at that time, 64 percent of interviewed households reported giving assistance in the form of food and/or money to other family members outside the household.
The current national cereal production may affect urban households primarily during the lean season (Jan-March 2010) while there will be secondary effects through higher prices despite significant imports as well as the impact of the global financial crisis on wages, which will make it difficult for households to access enough food. The prospects for these are uncertain in the light of the changing macroeconomic situation and the removal of restrictions on private trade in cereals. In addition, urban agriculture has been affected by lack of timely access to inputs as well.
Migration and remittances
Most migrants in South Africa, the top emigration destination, come from Bulawayo, Matabeleland (S&N) and Harare. Diaspora remittances play a major role in supporting household food needs and alleviating poverty. Overall, it is estimated that a large number of Zimbabweans are abroad to work there, as mentioned under 2.1, estimates range from 350 000 (CSO) to 3 million13. From the Community and Household Surveillance (CHS) monitoring system, households reporting at least one member migrating out for one month or more has been increasing since March 2009 where 16 percent of households reported a member migrating. This increased to 20 percent in October 2009 and to 23 percent by March 2010. The increases were mostly found amongst households in the Mashonaland, Masvingo and Mutare areas.
The most important source of food for household consumption in rural areas is from own production, for provinces and districts that mainly produce food crops. But in livestock-rearing provinces and districts such as the Matabelelands, market purchases of food are the most dominant sources, similarly, in districts dominated by cash crop production, food purchases form a significant component of households’ access to food. In general, food purchases have become a very important feature of household food access in most of rural Zimbabwe, especially in recent years of low production.
While GMB used to be the official trader, buying from and selling to households, informal trade (referred to as farmer-to-farmer trade) also takes place. Barter trade, including exchange of livestock (mainly small ruminants) for grains, and providing labour for cereals were widely reported but because of the “dollarization” of the economy, this practice has been reduced. Through the liberalization, private traders and millers are now important elements of the cereal markets. The CHS found that households rely on an equal combination of production, purchase and casual labour to access food. Some households also rely on gifts and/or food assistance to access food they consume. Reliance on casual labour increased between October 2009 and March 2010.
Access to food through own production
Most rural households in Zones I – II and even III rely on their own production to access cereals during most of the year. As mentioned above, agricultural production during the 2009/10 season was relatively good in most of the country, thanks to sufficient rainfall and this in spite of a midseason dry spell. Moreover, around 738 000 farmers benefited from input support programmes. Soils in communal areas tend to be less productive and farming practices are often lacking; all of these resulting in lower maize yields by communal farmers, estimated by AGRITEX at 0.46 tonnes per hectare on average in 2010, much lower than the yield in other farming sectors.
Often part of the production is sold by the farmers to provide cash for other needs, therefore the food stock of most communal farmers is depleted before the next harvest. In many areas communal farmers will run out of food stocks from their own production by January 2011; in Masvingo, Matabeleland South and North and Manicaland this will happen even much earlier, as described in the ZimVAC May 2010 Assessment Report.
Access to food through alternative sources of income
Besides food from their own farms, most communal farming households rely also on other sources of livelihood such as sales of food and cash crops, vegetable growing, casual labour, remittances and petty trade. These usually help them to provide for their basic needs. However, under the current economic circumstances, many of these complementary livelihood activities in rural areas are less reliable. Casual labour opportunities with large farmers (seasonal crops, tea or forestry plantations) depend on these farmers’ financial situation and the extent of their seasonal crop. These farmers have problems accessing credit to finance their production, and consequently to hire labour.
There are no solid data on remittances coming from abroad. The Reserve Bank of Zimbabwe estimates them to amount to between USD 50 and USD 100 million, others believe that this number is much underestimated and may neglect informal channels. Remittances from the city to the rural areas are also under pressure: Government employees in the cities receive currently only an allowance of USD 150, leaving only small amounts they could send to relatives in the countryside and the global economic crisis puts stress on income of the Zimbabweans in the diaspora, leaving them less to be sent home.
Throughout the country, and especially in the dryer agro-ecological zones (IV – V), livestock is very important. The crisis in 2008/2009 caused livestock to move from poor, communal farmers, to richer farmers and partly to the cities for slaughter. Many households from communal areas saw their livestock holdings last year drastically reduced or even wiped out through distress selling of animals, leaving these households even more vulnerable. Price levels of livestock are currently however at normal level, allowing producers a fair return for their products. The March 2010 CHS found about 40-50 percent of rural households owning cattle but average size was 2 to 3 head per household. Livestock sales have decreased with few households selling cattle, goats or sheep with poultry sales being reported by about 17-18 percent of rural households.
Cotton is a key cash crop for small farmers and is currently bought for USD 0.30/kg (for the lowest quality), which is double the price of last year. The low prices of season 2008/09 (USD 0.15–USD 0.18/kg) are to blame for the low area planted during the 2009/10 season. In large parts of Midlands, cotton was reportedly not paid during the previous season, and distribution of inputs is sometimes problematic.
Off-farm and non-farm income of communal farmers is improving compared to last year but is still weak and monitoring of the situation is recommended. Food access in other farming sectors seems not to be an issue, but in some cases, A1 farmers have similar problems as the communal farmers.
The situation in urban areas has stabilized. During the crisis (until early 2009), the formal sector collapsed, creating the opportunity for poor people to venture in the informal sector (buying and reselling…), which allowed them to cope. Because, after the stabilization, the big commercial circuits have recovered, the informal sector is now largely gone, diminishing coping opportunities for some. The formal sector has been absorbing some but not all, resulting in large number of unemployed and underemployed. The Government, a big employer, is also paying USD 150/employee, which through the multiplier effect generates income for other urbanites. Overall, the situation seems to have improved, but it’s not clear how many people are still in deep poverty.
The National Nutrition Survey was carried out in January 2010 with the following objectives:
Determine the nutritional status of children 6-59 months of age in each District
Explore the prevalence and distribution of underlying determinants of malnutrition among children 0-59 months of age in each district
Provide platform for recommendations for action at district and national level
Information was collected on more than 38 000 children 0-59 months of age and their households with results being representative for 60 rural districts, 3 major urban areas and one ‘other’ urban domain.
Chronic malnutrition is high (33.8 percent – WHO and 27.1 percent – NCHS) according to global thresholds and has increased relative to 1999 levels and should be considered a significant public health threat. The prevalence of underweight is considered mid-range (9.9 percent – WHO and 14.5 percent – NCHS) according to global thresholds, and are at the same level they were in 1999. The wasting prevalence (acute malnutrition) is lower than expected (2.1 percent each for WHO and NCHS standards) and represent a decrease from 1999 levels. The reasons for this decline require additional analysis and research. Rates of overweight are slightly higher than expected (3.1 percent – WHO and 1.3 percent NCHS) and are considered medium according to global thresholds. It will be important to track this indicator over time as rates of overweight tend to increase as countries’ economies grow.
Nationally, 33.8 percent of children between 6-59 months of age are stunted. However, national figures obscure wide variation between districts where rates of stunting in 24 districts are above 35 percent which is high according to global thresholds.
By age, rates of stunting and underweight increase from birth to approximately 24 months of age. Wasting, by contrast, has a different trajectory: peak rates of wasting occur in the younger age groups and settle at around 24 months. Due to measurement constraints, the survey was unable to represent rates in children 0-6 months of age in which the highest prevalence of wasting would be expected. By sex, boys are significantly more likely to be malnourished than girls according to all indices.
Nationally, nearly 13 percent of children had diarrhoea within the two weeks preceding the survey. This is slightly higher than rates reported in the 2009 Multiple Indicator Monitoring Survey which may be due to the timing of the NNS (January). Prevalence varies widely between districts, with clearly clustered pockets above 17 percent (very high) in the north and south/east parts of the country. Fever is typically used as a proxy for malaria. Nationally, nearly 14 percent of children were reported to have experienced a fever in the two weeks preceding the survey. Prevalence of fever was considerably higher than those reported in the 2009 MIMS which may be due to the season of collection. As with diarrhoea, there is wide variation between districts and a similar clustering.
There were no significant differences in the prevalence of diarrhoea or fever between boys and girls, but there are significant differences between children living in urban and rural areas. Children living in rural areas were more likely to have suffered from fever than children in residing in urban areas.
Food consumption
Using dietary diversity and food frequency and calculating a food consumption score as a measure of household food security, the 2010 NNS found that 12 percent of the children (N = 39,000) were from households with a low food consumption score, 21 percent lived in households with moderate and 67 percent lived in households with a high food consumption score.
Figure 7 below shows the percentage of children living in households with a poor food consumption score by district, showing that the main food security issues are found in the northern districts in the Mashonalands.
Comparing these findings to the March 2010 CHS system which covers the WFP operational areas in the country (about 3.5 million rural households), 15 percent of non-beneficiary households had poor consumption, a decrease from 22 percent in March 2009 and lower than the 19 percent in May 2008. For beneficiaries, only 2 percent had poor consumption, compared to 5 percent in March 2009 and 23 percent in May 2008. The trends are presented in the chart above. The chart indicates that among non-beneficiaries, food insecurity is problematic but improving over previous years. When compared to the January 2010 NNS, the percentage is slightly lower since the CHS was conducted in March and some households were already eating green maize. However, only slightly more than 70 percent of beneficiaries had acceptable consumption, which is problematic since their food basket alone should allow them all to have acceptable consumption unless part of the ration is sold or bartered. This is likely because sharing is common and some households are monetising oil to access foreign currency which is scarce in rural areas.
The chart below shows the number of days per week, different foods/food groups are consumed by food consumption groups. For all three groups, maize is consumed seven days per week, showing the importance of maize in the diet. Households with poor consumption only consume, on average, maize and vegetables every day of the week, and nothing else. Those with borderline consumption have the same consumption, with the addition of fats/oils five days per week and other cereals (likely to be sorghum) one day per week. The diversity and frequency of foods consumed by households with acceptable consumption is still quite simple with daily consumption of maize, vegetables and fats/oils, other cereals four days a week and sugar and beans/peas three days a week.
HIV and AIDS
Health indicators have deteriorated at an alarming rate with Zimbabwe having the fourth highest crude mortality rate in Africa. Life expectancy at birth dropped to 44 years in 2008 (WHO). After a steady decline in overall under-five mortality rates until 2006, the trend reversed and ultimately reached 94 per 1000 live births in 2009 (Central Statistical Office, Multiple Indicator Monitoring Survey (MIMS) Report 2009). Maternal mortality is amongst the highest in the world at 1,100 per 100,000 live births. Gains have been made through intensive HIV awareness and behavioural change campaigns, leading to a decline in the prevalence rate from to 18.1 to 13.7 percent in 2009 (Ministry of Health and Child Welfare), remaining one of the highest in the world. By the end of 2009, 1.1 million Zimbabweans were living with HIV and 1,090 people were dying weekly of AIDS related illness, the main cause of mortality. Less than 50 percent of people living with HIV (PLHIV) requiring Anti Retroviral Therapy (ART) have access to it (Ministry of Health and Child Welfare). In Zimbabwe, one of 22 highest TB burden countries in the world, 68 percent of TB cases test positive for HIV. Less than 30 percent of TB cases are identified for treatment (WHO, Global Tuberculosis Control Report 200, 2010 update).
The HIV pandemic has had a detrimental impact on livelihoods, particularly in the rural areas where affected households have become increasingly vulnerable to hunger and poverty. Health-related expenses increase while productivity, earning power and incomes decrease. Households loose key producers and managers of livelihood assets, leaving children or the elderly to assume the role of breadwinner and primary care giver. Currently 37 percent (1.6 million) of all children in Zimbabwe are orphaned (one million) and/or vulnerable (OVC) (Central Statistical Office, Zimbabwe Multiple Indicator Monitoring Survey (MIMS) 2009), 77 percent of who as a result of AIDS (Zimbabwe National HIV and AIDS Strategic Plan 2006–2010). While the majority of children obtain support through the informal extended family network, an increasing number are at risk of malnutrition and dropping out of school. In 2009, 79 percent of the OVC did not receive any formal external support; OVC in urban were less likely to receive any formal external support (87 percent) compared to those in rural areas (77 percent) (Central Statistical Office, Zimbabwe Multiple Indicator Monitoring Survey (MIMS) 2009).
Chronically food insecure households
These households tend to be food insecure regardless of the performance of the production season and overall food supply situation. They are households who cannot grow their own food or purchase sufficient food, even at regulated prices. These include: elderly-headed households, families hosting orphans or with disabled or chronically ill members, those with high levels of dependants, child-headed households and the destitute who lack any resources. There are existing safety nets such as the BEAM programme of the Ministry of Education, targeting children without means, but anecdotal evidence shows that some orphans are not included. Those who fall within this group of vulnerable people need continued safety net type of support.
Transitory food insecure households
These households are normally food secure but will not be able to meet their food needs through to the next harvest, mostly due to inadequate production and/or sales of production to meet other needs due to lack of alternative livelihood opportunities. It should be noted that the agro-ecological conditions in most areas of Masvingo, Matabeleland and Manicaland are favourable for livestock production (zone IV and V) and far less so for crop production. In the last 10 years however, many households have been resettled on farms formerly producing livestock and rely now more on cereal production, which partly explains the increased area under maize production in the 2009/2010 season. These vulnerable households relying on a crop system that, in zones IV and V, regularly fails because of insufficient rains are at a high risk of seasonal food insecurity. The current season is a case in point.
They also include households unable to purchase food in the market because of the deterioration in their terms of trade for livestock or wage labour as well as lack of income opportunities. In addition, some of the people who were previously employed in the formal sectors (factories and industries) and who have been made redundant due to closure of factories as a result of the global financial crisis are also in this category.
Extent of food insecurity
According to the May 2010 Assessment Report of ZimVAC, 15 percent of the rural population (1.29 million) will be food insecure by January - March 2011. The same report estimates the total cereal entitlement gap, a measure of the missing entitlements for food or all food insecure households, at 98 000 tonnes. This estimate is based on the assumption that 80 percent of all stocks and own food crop production are used for household food consumption together with 80 percent of all potential income from own cash crop production, from livestock, from gifts, remittances, casual labour, pensions, formal employment and from other sources that would be converted in food entitlements. These assumptions don’t fully consider the fact that households also have significant expenditure for other basic needs. Moreover, only the cereal needs of households are taken into account, whereas an acceptable diet should also be composed of other food groups.
The team therefore estimates that the number of food insecure households throughout the year should be higher. Since key informants interviewed by the Mission predict that the onset of the lean season in the 2010/2011 consumption year to be similar to the year before we can refer to the nutrition survey for an indication. The National Nutrition Survey of January 2010 found 12 percent of rural households with poor consumption and another 21 percent with borderline food consumption (based on the food consumption score), together 33 percent, indicating that one-third of the rural population was experiencing food insecurity around that period. Since key informants expect the 2011 lean season to be similar to the 2010 lean season, this is another argument to expect higher food insecurity than the 15 percent of rural households indicated for January-March 2011 by the ZimVAC (see table).
Regional distribution of food insecurity
| Province | Total | Food Insecure population as of | |||||||
| Population | April-June | July-September | October-December | January-March | |||||
| Manicaland | 1 364 156 | 21 916 | 2% | 75 115 | 6% | 142 970 | 10% | 222 720 | 16% |
| Mash. Central | 1 107 428 | 39 125 | 4% | 63 109 | 6% | 102 649 | 9% | 137 794 | 12% |
| Mash. East | 1 077 857 | 13 572 | 1% | 46 395 | 4% | 87 214 | 8% | 122 687 | 11% |
| Mash. West | 996 633 | 10 889 | 1% | 34 000 | 3% | 60 055 | 6% | 81 537 | 8% |
| Masvingo | 1 328 883 | 50 216 | 4% | 115 499 | 9% | 191 178 | 14% | 268 903 | 20% |
| Mat. North | 686 432 | 14 907 | 2% | 51 807 | 8% | 90 009 | 13% | 130 810 | 19% |
| Mat. South | 681 949 | 37 232 | 5% | 71 913 | 11% | 106 735 | 16% | 139 305 | 20% |
| Midlands | 1 267 168 | 33 099 | 3% | 79 675 | 6% | 123 653 | 10% | 184 180 | 15% |
| Grand | 8 510 506 | 220 956 | 3% | 537 514 | 6% | 904 463 | 11% | 1 287 937 | 15% |
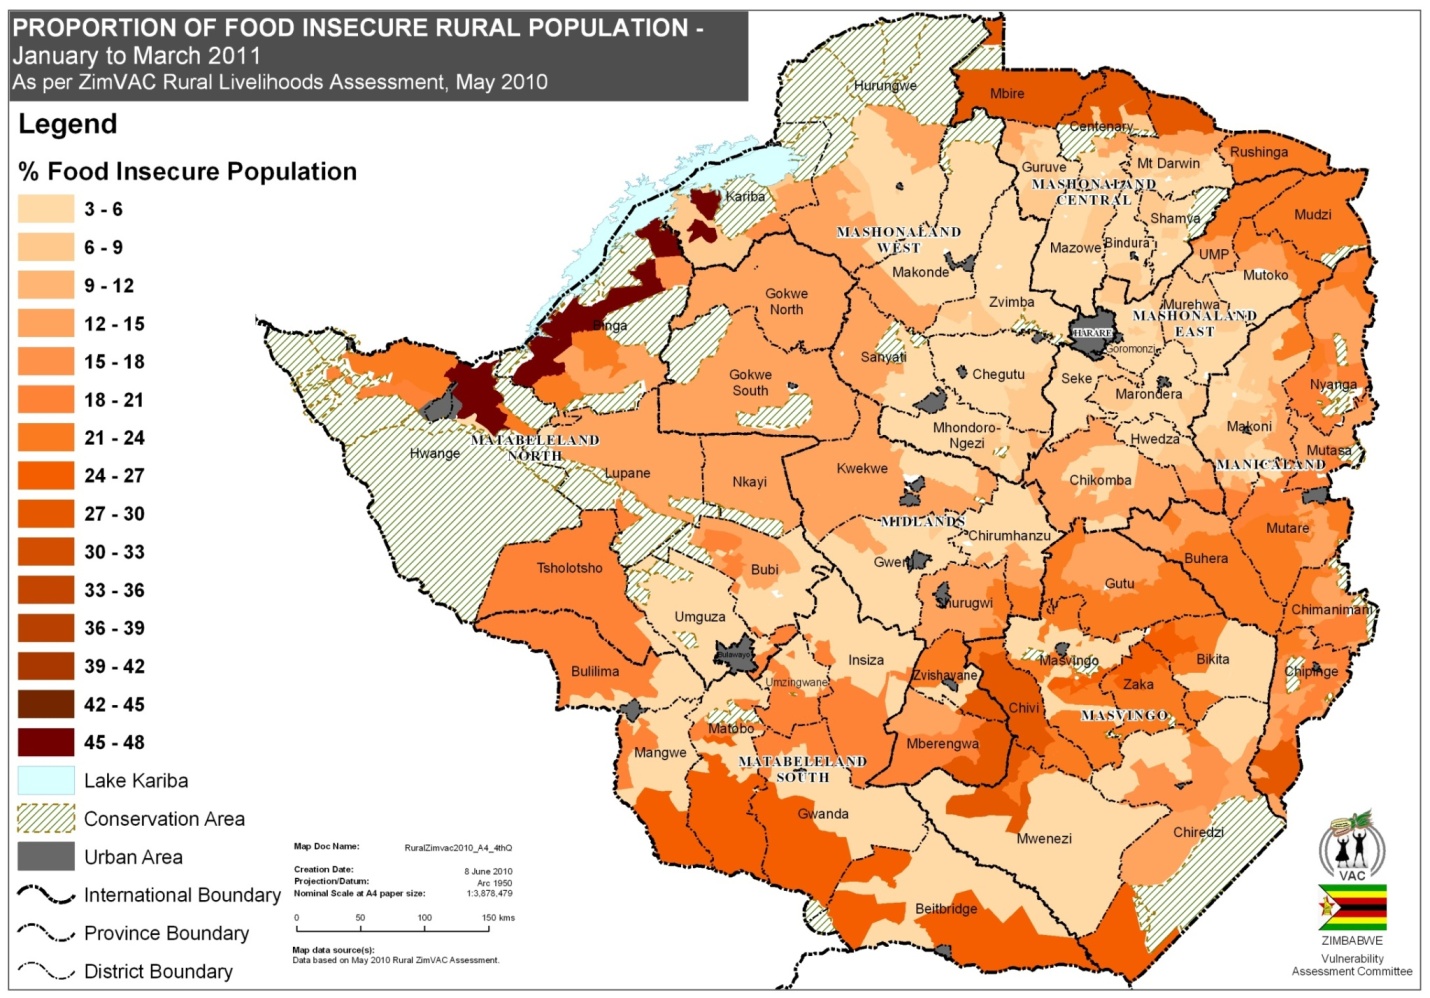
Based on the ZimVAC report (May 2010), wards in Mbire, Muzarabani, Mt Darwin, Chiredzi, Beitbridge, Chivi, Mberengwa, Gwanda, Insiza, Umzingwani, Matobo and Mangwe districts were already experiencing high levels of food insecurity in May-June 2010. Through the season, the situation will worsen and by the peak of the hunger season (January – March 2011) the worst affected districts will be Mbire, Kariba, Binga, Hwange, Chivi, Mwenezi and Beitbridge.
Due to the liberalisation, traders are now bringing food into the country to where there is market demand. Food availability, therefore, is not really the issue. On another hand many food insecure people cannot access the available food to satisfy their basic food needs.
Support to food supply
During the 2009/10 marketing year, private market players have shown they can ensure the availability of food availability in markets for households with enough purchasing power. Private traders and the poorly funded GMB have the physical capacity to provide for sufficient food availability in the markets, but they currently struggle for sufficient financial resources. The current liberal import policy should be continued but with mechanisms in place to allow GMB, importers and traders to access financial capital for their operations.
Support to the food insecure
Even if food is available, households that do not the capacity to access to adequate amounts of food should be assisted in a timely manner. Food assistance will contribute to averting further increases in child malnutrition and erosion of household productive assets. Food assistance should be appropriate to the situation of households: targeted relief assistance to the transitory food insecure; Seasonal Targeted Assistance (STA), and specific assistance to chronically food insecure groups including households affected by HIV and AIDS, those hosting orphans and vulnerable children (OVC) and mobile and vulnerable populations (MVP) in rural and urban areas. The general view is that much of the food assistance for transitory food insecure households should be in the form of food-for-work (FFW/FFA) programmes for households whose members are able to work, depending on the possibility to launch such programmes at the required scale to reach those in need.
Population in need
As mentioned above, the May 2010 ZimVAC Vulnerability Assessment Report estimates that up to 15 percent of the rural population is food insecure during the 20010/11 marketing year. This mission believes the proportion of rural food insecure to be higher, and using information from 2010, predicts that up to 30 percent of rural households will have poor or borderline food consumption by the January – March 2011 lean season peak. For food assistance needs, the Mission will however recommend to cover the 1.288 million people in rural areas as estimated by the ZimVAC, anticipating that the other food insecure households in rural and urban areas will have the ability to cope through the hunger season. However, the situation should be monitored through the next harvest.
Based on the findings of the 2010 ZimVAC Report and on the analysis in the 2009 CFSAM and 2009 ZimVAC reports, the Mission projects that in rural areas food assistance would be required mostly in communal farming areas. Some households expect to have consumed all of their produce by June 2010 (especially in Mbire, Muzarabani, Mt Darwin, Chiredzi, Beitbridge, Chivi, Mberengwa, Gwanda, Insiza, Umzingwani, Matobo and Mangwe districts), leaving a gap for some households starting immediately after their 2010 poor harvest. For others, the food gap will start later in the year. For all those households, it’s assumed that this deficit situation will last until March 2011, assuming that food can be harvested in April 2011. The ZimVAC expects a rural “food entitlement gap14” for that period of 98 000 tonnes of cereal equivalent.
It is estimated (see Section 2) that the effective 2010 population of Zimbabwe is 7.822 million in rural areas and 3.514 million in urban and peri-urban areas. In the rural areas, 75 percent15 are living in communal farm areas. The Mission expects 22 percent of the communal farming population to be food insecure during the 2010/11 season, including 5 percent which is chronically food insecure16 while the others will suffer transitory food insecurity17 during 2009-10, for an average of about six months. This amounts to 1.29 million chronic and transitory food insecure people in rural areas.
| RURAL | Rural population: | 7 822 000 | |
| Communal farmers | 75% | of rural population | 5 866 000 |
| Total Food Insecure | 22% | of communal population | 1 291 000 |
| of which Chronically FIS | 5% | of communal population | 293 000 |
| and Transitory FIS | 17% | of communal population | 997 000 |
| URBAN | Urban population: | 3 514 000 | |
| Total Food Insecure | 11% | of urban population | 387 000 |
| of which Chronically FIS | 7% | of urban population | 246 000 |
| and Transitory FIS | 4% | of urban population | 141 000 |
There is no recent information about urban food security available. The urban ZimVAC assessment of January 2009 estimated that 30 percent of the urban areas were food insecure. Because of the improved economic situation, started in February 2009, the 2009 CFSAM assumed that half this number, or 15 percent would be food insecure during marketing year 2009/10. Seven percent of the urban and peri-urban population were considered chronically food insecure, and additional eight percent were deemed transitory food insecure. According to key informant interviews, the urban situation has further improved and thus the Mission has reduced the percentage of transitory food insecure in urban areas from eight percent to four percent for the 2010/11 marketing year. As such, eleven percent of the urban and peri-urban population is estimated become food insecure. The transitory food insecure would need support for around six months, which amounts a total of 387 000 targeted people in urban areas. Again, there is only anecdotal evidence of an improving situation, but more systematic data would be needed to establish the needs in urban areas.
These assumptions would result in 1.68 million food insecure persons, and a total food assistance of 133 000 tonnes under various modalities as seem appropriate. Full rations would be needed, over a 6 month period for the transitory and year round for chronically food insecure. The urban gap is assumed to be only half the food ration, based on local food security experts.
| Beneficiaries | Ration (kg/month) | Months | Food (t) | Cereals (t) | |
| RURAL | |||||
| Chronically FIS | 293 000 | 12 | 12 | 42 192 | 35 160 |
| Transitory FIS | 997 000 | 12 | 6 | 71 784 | 59 820 |
| 94 980 | |||||
| URBAN | |||||
| Chronically FIS | 246 000 | 5 | 12 | 14 760 | 12 300 |
| Transitory FIS | 141 000 | 5 | 6 | 4 230 | 3 525 |
| 15 825 | |||||
| TOTAL | 1 677 000 | 132 966 | 110 805 | ||
The above calculations are only provisional and provide merely indicative estimates. These numbers are also based on the assumption that the economy will continue to gradually improve and more opportunities will become available. If the economy would deteriorate, or crucial policies such as the liberalisation of the cereal markets would change, food assistance would have to be revised upwards; if on the other hand the situation in rural areas would rapidly improve, the assistance requirements would have to be revised downwards.
Because private traders will be able to supply food products and the country also has cereal surplus areas (as described in the ZimVAC report), the opportunities for further expanding cash and voucher programmes should be explored. Food for Work/Assets is also an option, because of its self-targeting properties for households with unemployed members. The Department of Social Welfare so far implemented such projects only at a very small scale.
Department of Social Welfare
The Department of Social Welfare (in the Ministry of Public Service, Labour and Social Welfare) has the responsibility to provide assistance to households who are vulnerable or in need. The categories identified as chronically food insecure individuals: i) female-headed households, elderly-headed households, child- headed households; ii) households with a disabled member and with chronically-ill members; iii) households with orphans and vulnerable children; and iv) destitute households.
The Department of Social Welfare implements two broad types of programmes related to food security: i) Public Assistance Programme (PAP) for vulnerable households. ii) Public Works Programme (PWP) that targets able bodied vulnerable households to participate in labour intensive public works provided by local authorities. The PAP is intended for all categories of vulnerability discussed earlier and covers assistance in the form of cash transfers paid on average costs of the basic food basket. However for the current year, there are no disbursements that have been done, activities focus on coordinating with eventual other donors to target vulnerable households at household level.
The World Food Programme
The World Food Programme is the largest agency providing food assistance in the country. WFP’s food assistance programmes in the country include Vulnerable Group Feeding (VGF) which supports transitory food insecure in rural areas who have exhausted their own production and do not have income-earning opportunities. At its peak (Oct 08-Mar 09), WFP reached around 4.5 million people through the VGF mechanism. WFP also supports, through its Safety Net (SN) programme, chronically food insecure populations. This group (SN) includes mobile vulnerable populations (MVP); orphans and vulnerable children (OVC); home–based care (HBC) and people on Anti-Retroviral Treatment compliance programmes.
From June 2009 until May 2010, the average caseload of the Protracted Relief and Recovery Operation (PRRO) was 960 000 beneficiaries; during the lean season (November 2009 until March 2010), there were around 1.4 M beneficiaries, but this number was drastically reduced afterwards: May 2010 only counted 260 000 beneficiaries.
C-SAFE
C-SAFE is a consortium of three agencies; CARE, World Vision and CRS and is the second largest food assistance group in Zimbabwe, with its own food pipeline, which reached a total of around 2 million beneficiaries by March 2009. Some of their programmes include safety net programmes, Food for Agriculture, Food for school services, and school feeding but are predominantly carried out after or before the “lean season”. Their activities may be discontinued it the future.
This report estimates the national uncovered food gap (total import requirement of cereals) at 428 000 tonnes (shown in Table 11) and the food assistance needs of the food insecure people in the country at about 111 000 tonnes of cereals (shown in Table 14). Assuming that the vulnerability assessments are accurate, this 111 000 tonnes would be the amount for which there is no effective demand (i.e. lack of purchasing power by the vulnerable population), the rest of the demand, 317 000 tonnes can be considered as an effective domestic demand, that should be fulfilled by commercial imports, given that the grain market is fully liberalized and private traders/millers/importers are free to import commercially. Therefore by and large there is a consistency in the figures produced from national macro level analysis and the household micro-level analysis presented in this report. In practice, however, there will be a margin of error in both estimates. Hence markets need to be watched for extreme price volatility on one hand and the signs of food consumption deprivation on the other, need to be monitored carefully so corrective actions can be undertaken by the Government and the donor community.
The national shortage is still a problem in the country and, therefore, external food aid is in part seen within the context of overall domestic availability. However, given that the lack of access to basic food because of declining purchasing power, assistance to the food insecure population is more determined by their household food gap than the national food gap in cereal production.
In order to enhance the capacity to increase food production and improve food security in the country, the Mission considers the following issues as important ones in the short term to long term:
The Mission recommends further emergency assistance by the Government and the international community in making fertilizer and quality seed available to farmers by September 2010 for the main season.
Although the grain markets have been liberalized, prices received by farmers for maize and wheat are typically far below the minimum support prices announced by the Government, It is vital that this policy is made effective in practice with the appropriate resources so that farmers receive the market incentives and provide proper supply response.
Conservation agriculture is gradually gaining acceptance in some areas thanks to the efforts of the extension service, and most farmers who have adopted the approach are pleased with the results. The approach should be further encouraged.
There are a number of small-scale irrigation schemes around the country that require rehabilitation, and, it would appear, a number of situations where new schemes could be established. Investment by the Government and donors in such schemes would increase agricultural productivity and alleviate the hardships suffered by some communities during dry years.
Given the uncertainty of imports in the new economic environment the Mission recommends that the national cereal balance sheet be reviewed and updated periodically. In addition, the Mission recommends that the current agricultural market reform be maintained.
Finally regarding the crop assessment by AGRITEX, it is recommended that the capacity building in improvement in methodology be continued especially relying more on the instrument based measurements of field area and crop yields rather than the visual observations and interviews. This implies that the staff would need to be provided with access to and training on the use of GPS units, weighing scales, hydrometers
The main recommendations to emerge from the CFSAM in relation to household food security and programme response are:
Continuation of existing food assistance programmes to address the needs of the chronically food insecure through support to households affected by HIV and AIDS, those supporting orphans, the destitute and the Mobile Vulnerable Populations (MVP).
Since the food security situation and its contributing factors are very dynamic the situation should be monitored to assess the needs of the transitory food insecure. The ZimVAC should play a key role as well as information from WFP’s Community and Household Surveillance (CHS). Systematic information about urban food insecurity is needed. Based on these food security monitoring findings food assistance requirements could be adjusted.
Based on the findings of the ZimVAC May 2010 Assessment report, programmes should be designed to target those in need of assistance until the next harvest. It is recommended that the Government, in close coordination with the international community, engages the humanitarian community to direct its programmes of assistance to those in need. WFP along with other agencies and the Government need to strengthen targeting in order to reach those that are the most vulnerable, using information from the latest ZimVAC assessment.
Livelihood support in the form of inputs should also be considered to support households growing vegetable and other crops on irrigation schemes or in low lands.
The Mission also recommends that the Government continue its liberalized food grain import policy to improve availability at local level. Any increase of tariffs would have a negative impact on food security of the vulnerable people.
| AGRA | Association for the Green Revolution in Africa |
| CFSAM | Crop and Food Security Assessment Mission |
| CHS | Community and Household Surveillance |
| CPI | Consumer Price Index |
| FAO | Food and Agriculture Organization |
| FEWSNet | Famine Early Warning System Network |
| GDP | Gross Domestic Product |
| GMB | Grain Marketing Board |
| ha | hectare |
| IFAD | International Fund for Agricultural Development |
| kg | kilogramme(s) |
| MAMID | Ministry of Agriculture, Mechanization and Irrigation Development |
| mm | millimetres |
| RBZ | Reserve Bank of Zimbabwe |
| STERP | Short Term Emergency Recovery Programme |
| t | tonne(s) |
| UNDP | United Nations Development Programme |
| UNICEF | United Nations Children's Fund |
| UNOCHA | United Nations Office for the Coordination of Humanitarian Affairs |
| USD | United States Dollar |
| WFP | World Food Programme |
| ZFU | Zimbabwe Farmers Union |
| ZIMSTAT | Zimbabwe National Statistics Agency (formerly known as the Central Statistics Office) |
| ZimVAC | Zimbabwe Vulnerability Assessment Committee |
| This report has been prepared by Kisan Gunjal and Jonathan Pound of FAO and Jan Delbaere of WFP under the responsibility of the FAO and WFP Secretariats with information from official and other sources. Since conditions may change rapidly, please contact the undersigned for further information if required. |
|
| Liliana Balbi Senior Economist, EST-GIEWS Trade and Markets Division, FAO Fax: : 0039-06-5705-4495 E-mail: [email protected] |
Mustapha Darboe Regional Director WFP OMJ Fax: : 0027 11 517 1642 E-mail: [email protected] |
|
Please note that this Special Report is also available on the Internet as part of the FAO World Wide Web (www.fao.org) at the following URL address: http://www.fao.org/giews/ The Special Alerts/Reports can also be received automatically by E-mail as soon as they are published, by subscribing to the GIEWS/Alerts report ListServ. To do so, please send an E-mail to the FAO-Mail-Server at the following address: [email protected], leaving the subject blank, with the following message: subscribe GIEWSAlertsWorld-L To be deleted from the list, send the message: unsubscribe GIEWSAlertsWorld-L Please note that it now possible to subscribe to regional lists to only receive Special Reports/Alerts by region: Africa, Asia, Europe or Latin America (GIEWSAlertsAfrica-L, GIEWSAlertsAsia-L, GIEWSAlertsEurope-L and GIEWSAlertsLA-L). These lists can be subscribed to in the same way as the worldwide list. |
|