![]()
![]()
![]()
Through the years of experience in fishpond development and management, fish farm owners/managers have achieved a thorough understanding of the significance of tidal characteristic in the design and operation of the farm. The water management manipulations, filling and draining of ponds with water, determining the height of dike, the elevation of pond bottom and water control structures, size of gate opening, estimating construction cost, and others, all of these are interlinked with the knowledge of tidal conditions in the fish farm site.
1. THE TIDAL PHENOMENON
The periodic rising and falling of the water surface of the ocean, seas, bays, mouths of rivers, etc., as a result of the gravitational attraction of the moon and sun on the earth is known as the astronomical tide. Although the moon's mass is much less than the mass of the sun, the moon is so much closer to the earth than the sun that its gravitational field is a greater tide-generating force than is the sun (Wiegel, 1964).
There are three types of astronomical tide in the ocean — semi-diurnal, diurnal, and mixed. The semi-diurnal tide has a cycle of about one-half a tidal day. The diurnal tide has only one high water and one low water per tidal day. The mixed tides are characterized by having a large inequality of either the high or low water heights; with two high waters and two low waters usually occurring each tidal day. Mixed tides may be either predominantly semi-diurnal or predominantly diurnal. Most tides are of mixed type and are closer to the semi-diurnal end of the spectrum. A typical example of each type of tide is shown in Figure A.1.
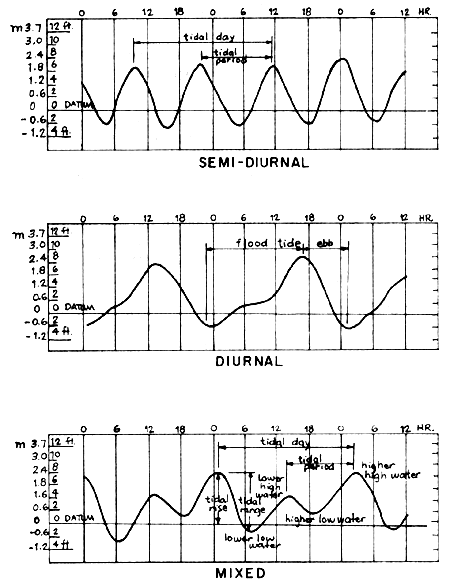
Fig. A.1 Types of tides
2. DEFINITION OF USEFUL ADDITIONAL TERMS
Flood tide — refers to the incoming or rising tide.
Ebb tide — refers to the outgoing or falling tide; opposite of flood tide.
Tidal period is the time interval between two successive high waters.
Tidal range — refers to the difference between the Higher High Water (HHW) and the Lower Low Water (LLW) (Fig. A.1), in a mixed tide. In diurnal and semi-diurnal tides, it is the difference between the high water and the low water.
Diurnal inequality — refers to the differences in height of the two high waters or of the two low waters of each day.
Spring tides — for several days every 14.3 days or roughly 15 days, the high waters are much higher and low waters much lower than usual. These are called spring tides and are being associated with full moons or new moons, that is, when the sun, moon, and earth are aligned, either in opposition or in conjunction (Fig. A.2).
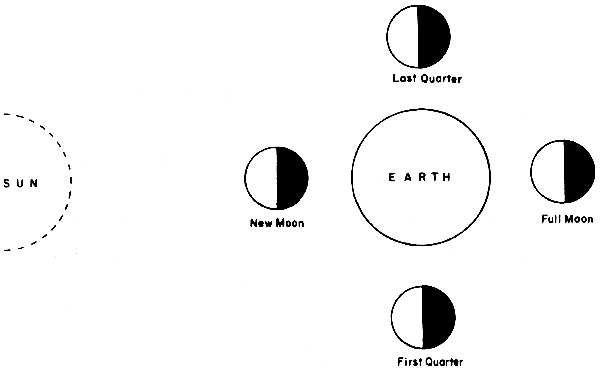
Fig. A.2 Tide phenomenon - solar and lunar system
(After Dureza, 1982)
Neap tides — these refer to the other extreme, where every 14.3 days or roughly 15 days, there are several days when the high waters are lower than usual, and the low waters are higher than usual. The spring and neap tides can be noted in Figure A.3.
Equinoctial spring tides — these are the extra — high spring tides which occur twice a year at the time of vernal and automnal equinoxes.
Tide datum — in referring to tide heights, some datum or reference is chosen, which is usually the long-term average of some property of tides such as the Mean Lower Low Water (MLLW). MLLW is the average of the lower low water over a 19-year interval (Marmer, 1951), as cited by Wiegel (1964). The MLLW is usually the zero datum being used as reference in fish farms.
3. SOURCES OF TIDAL INFORMATION
In fish farm site selection and planning, tidal heights are obtained from Tide and Current Tables published annually by each country in the region. Values in the tide table are accurate enough especially when the site is very close to the shore. However, if the site is already some kilometers inland (say 10 km), actual tide gauging becomes necessary.
3.1 Uses of tide and current tables
Each country has an established tide gauging stations. For the Philippines, there are six tide stations, namely: San Fernando, Manila, Legaspi, Cebu, Jolo and Davao stations. Reference stations for other places are listed under the section for “Tidal Differences” and “Constants” of the Tide and Current Tables.
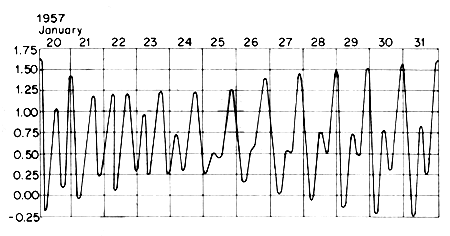
Fig. A.3 Tide record for 15 days
(After Dureza, 1982)
The predicted time and height of high and low waters each day for the six tide stations can be read directly from the table. Tide for other places are predicted by applying tidal differences and ratios found in the Tide and Current Tables. However, unless very accurate data are required, corrections on tide tables may be neglected. The procedure in using Tide and Current Tables is best illustrated by examples.
(a) Predicting height of tide anytime of the day
Example A.1. Let us predict the tide in Tayabas River Entrance on November 15, 1980. The place is in the South Coast of Luzon Island (Philippines). From the table, the reference station for Tayabas River Entrance is Cebu. The predicted time and height of tides for Cebu is read from the tables on November 15, 1980, are as follows:
| High water | Low water | ||
|---|---|---|---|
| Time | Height* | Time | Height |
| h min | - | h min | - |
| 0220 | 1.57 | 1011 | 0.08 |
| 1650 | 0.71 | 1955 | 0.64 |
* The heights are in meters and referred from the MLLW; 0000 ismidnight and 1200 is noon.
Referring to the table on tidal differences and constants on page 35, the correction on the time for high and low waters for Tayabas River Entrance are as follows:
| Time | Height of High Water | Height of Low Water | |
|---|---|---|---|
| High Water + 05 min | Low Water + 05 min | Height of High Water (x 0.95) | Height of Low Water (x 0.95) |
Therefore, the corrected time and height of High and Low Waters for Tayabas River Entrance are:
| High Water | Low Water | ||
|---|---|---|---|
| Time | Height (m) | Time | Height |
| 0225 | 1.57 × 0.95 = 1.4900 | 1016 | 0.076 |
| 1655 | 0.71 × 0.95 = 0.6745 | 2000 | 0.608 |
(b) Determining height of tide at any time and establishing land benchmark
Pond canals, and gates elevations are well tied up with the zero datum at the sea. Usually, the zero datum is transferred to a firm reference point in the ground. Hence, levelling survey is usually done at a time when the tide is rising or falling. Therefore, the height of tide at any time need to be known in order to establish the ground reference point (also known as benchmark) which is reckoned from the zero datum.
Example A.2. It is desired to establish a ground reference point for a fish farm close to the Tayabas River Entrance. The survey is done on October 22, 1980 at about 2:00 p.m. (1400 hours). The rod reading obtained through the level instrument set on the shore ground, reckoned from the water surface at 2:00 p.m. is 2.75 m (Fig. A.4).
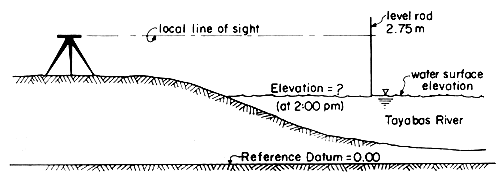
Fig. A.4 Illustration of the conditions of the example problem
Solution
Step 1. As in Example A.1., the reference station for Tayabas River Entrance is Cebu. From page 35 of the 1980 Tide and Current Tables, Tidal differences and constants, the following data for corrections are read:
| Corrections | ||
| Time | High water | + 0h 05m |
| Low water | + 0h 05m | |
| Height | High water | × 0.95 |
| Low water | × 0.95 |
Step 2. Determine the elevation of seawater surface at the time of survey (2:00 p.m. or 1400 hours). Use section of table for “Times and heights of high and low waters” (under reference station Cebu), page 21. Refer to column under the month of October, day 22 and obtain:
| From Table | Corrected Values | ||||
|---|---|---|---|---|---|
| Time | Height | Time | Height | ||
| h | min | m | h | min | m |
| 03 | 40 | 0.39 | 03 | 45 | 0.3705 |
| 09 | 49 | 1.42 | 09 | 54 | 1.3490 |
| 16 | 14 | 0.15 | 16 | 19 | 0.1425 |
| 22 | 24 | 1.34 | 22 | 29 | 1.2630 |
Sample calculations:
| Time | : 03h 40 min + 0h 05min = 03h 45min |
| Height | : 0.39 × 0.95 = 0.3705 m |
The sketch for the predicted tide at the place is shown in Fig. A.5
Step 3. The time interval from 9h 54min (duration of fall) between which 2:00 p.m. (1400 hours) lies is 6h 25min; while between 14h 00min and 16h 19min (nearer of the two lime limits) is 2h 19min.
Take note that the tide is falling (outgoing)
| Time | Time | Height |
|---|---|---|
| h min | h min | - |
| 9 54 | - | 1.3490 |
| - | 14 00 | - |
| 16 19 | 16 19 | 0.1425 |
| Time diff. = 6 25 | 2 19 | 1.2065 m= Height difference or range |
Step 4. Refer to section “Height of tide at any time”, page 79 and read the information as follows:
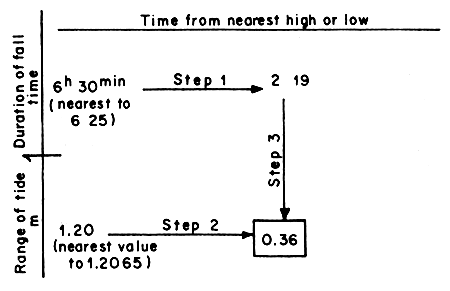
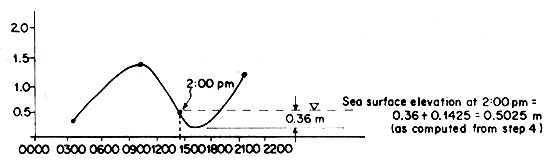
Fig. A.5 Approximate sketch of the predicted tide at Tayabas River entrance on Oct. 22, 1980
Step 5. The value of 0.36 m is the correction to be applied to the tide height of 0.1425 (this is used instead of 1.3490 because its corresponding time of 16h 19min is used in the calculation as the nearer value to 1400 hours).
Hence, the height of tide at 2:00 p.m. is:
0.3600 + 0.1425 = 0.5025 m
Step 6. Transfer or relate the reference datum plane (00 datum) to the dry shore ground at the site. Select a more permanent object on the ground for this purpose. The procedure is as follows:
(i) Determine the elevation of level line of sight of the instrument. This is the so-called Height of Instrument (HI). For rod reading of 2.75 m (which is a backsight) and water surface elevation of 0.5025 m (from the zero datum). HI is computed as:
| HI | = 0.5025 + 2.75 |
| = 3.2525 |
(ii) Maintaining the level position of the line of sight, rotate the instrument telescope about its vertical axis, the sight of permanent object, say A as the ground reference mark. Get the rod reading on top of point A, say 1.85 m. This reading is a foresight or FS. The elevation of the reference point A is now determined which is reckoned from the zero datum at the sea as follows:
| Elevation of point A = HI - FS | = 3.2525 - 1.85 |
| = 1.4025 m |
Tabulating the data for Step 6:
| Station | BS | HI | FS | Elevation (m) | |
|---|---|---|---|---|---|
| At sea | 2.75 | 3.2525 | - | 0.5545 | Referred from 00 datum |
| At Point A | - | - | 1.85 | 1.4025 | Established ground reference point (above 00 datum) |
(iii) All level and ground readings can now be referred from the elevation of Point A. An illustration of item (b) above is given (Fig. A.6).
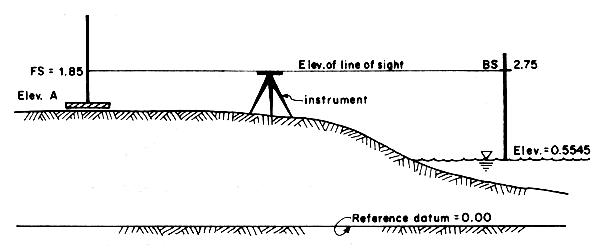
Fig. A.6 Relating zero datum to shore ground
(iii) Graphical method of determining height of tide at any time (after BCGS, Philippines, 1980)
The graphical method involves plotting of the tide curve. On a cross-section paper, assign the time and height of tide to the horizontal and vertical axes, respectively. As shown in Figure A.6, plot the high and low water points H and L, between which the given time lies. Join H and L by a straight line and divide it into four equal parts at points Q, M and Q2 in that order. Locate point P vertically above Q1 and P2 vertically below Q2 at a distance equal to one-tenth of the range of the tide (or P1Q2, = P2Q2 = 1/10/H - L/. Draw an approximate sine curve through points H, P1, M, P2 and L. This curve closely approximates the actual tide curve, and heights for any time may be readily scaled from it.
Example A.3. From Example A.2, the corrected values for height and time of tide are as follows:
| Time | Height |
|---|---|
| 09 54 | 1.3490 |
| 16 19 | 0.1425 |
Determine the height of tide at 2:00 p.m. by graphical method. For solution, refer to Figure A.7.
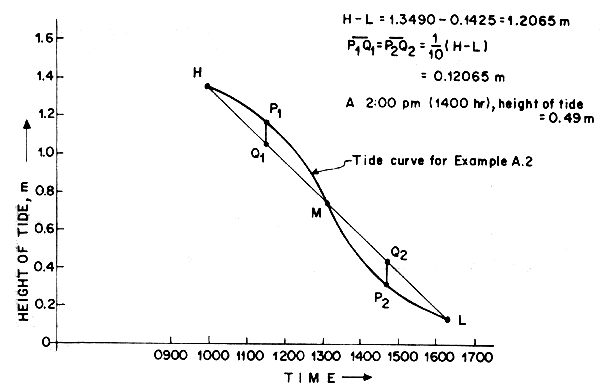
Fig. A.7 Height of tide at any time by graphical method
(After BCGS, 1975)
3.2 Actual tide observation in the site
Site selection for a fish farm may involve actual gauging of tide especially when the sea level (zero datum) at the site is not known. In general, the longer is the observation of tidal fluctuation, the better. The least duration of observation is probably two months but a one-year data is much preferred. The length of observation would depend to some extent on the tidal range in the area. If the tidal range is high enough such that an error for tidal fluctuation of say 20 cm is tolerable, short observation period may be acceptable.
In tidal gauging, the observation station should be firm and located in calm water where it is free from movement or fouling of wind, wave or man. If such a place is not available, matured bamboo or concrete pile may be driven to serve as fixed station but provided with appropriate shield. A graduated rod may serve as the water level or height measuring device at specific time intervals.
During tidal observation, the season during which data are taken should be observed and understood. When tides are recorded during dry season, the sea level is relatively at its lowest, hence, data are much suitable for determining pond bottom elevation and for drainage purposes. On the other hand, data taken during rainy months have the combined height of tide and flood water. Thus, such data are essential in determining the heights of protective or perimeter dikes.
![]()
![]()
![]()