![]()
![]()
![]()
by
Derek Winstanley
Environmental Systems Branch
Environment Canada
Ottawa (Ontario), K1A OH3, Canada
The paper provides background information on: the precipitation climatology of the zone 10°–20°N in Africa; the morphology of the recent drought; and the relationship between rainfall and river discharge. Rainfall fluctuations in this zone are viewed as regional manifestations of fluctuations of the general atmospheric circulation. Based on the expected behaviour of the general atmospheric circulation for the remainder of the century, long-range forecasts of rainfall and river discharge are made. This information and these forecasts are intended to provide a basis on which to assess the effect of the recent drought on fisheries and as a basis for discussing the long-term development and protection of fisheries.
Mean annual rainfall decreases from about 1000 mm at 10°N to less than 100 mm at 20°N. There is a strong north-south rainfall gradient and the isohyets (lines of equal rainfall) are aligned west-east.
About 94% of the rainfall occurs in the period May to September. The rains progress northwards from May to August and subsequently retreat southwards. The months from November through to April are practically rainless. Fig. 1 shows the distribution of normal (1931–60) May–September rainfall. A simple rainfall model for the zone has been obtained by zonally averaging rainfall in 2 dg. latitude bands (Fig. 2a).
The extent of variability is expressed by the size of the departures from the mean, of which standard deviation is a measure. The standard deviation divided by the mean and expressed as a percentage yields a coefficient of variability. This makes it possible to compare the inter-annual variability of places with different mean rainfall amounts.
The geographical distribution of the coefficient of variability of May–September rainfall for the period 1951–72 is shown on Fig. 3. As is general throughout the world, variability increases with decreasing rainfall, that is from about 15–18 in the south to over 100 in the north. For comparison, the coefficient of variability of annual rainfall in England ranges from about 11 to 18 (Senior 1969).
Rainfall not only decreases towards the Sahara, but is also much more variable from year-to-year. But if it is normal for rainfall to decrease with increasing latitude and normal for it to be highly variable from year-to-year, what are the nature of the changes in rainfall distribution patterns that lead to drought, what is the extent of the drought and what are the geographical variations in severity? After all, in only 1967 in an authorative FAO/UNESCO/WMO interagency project report on agroclimatology of this zone it was concluded that there was “no evidence that very dry years were grouped in spells of two or more years,” but that there was “some evidence....that annual droughts tended not to occur simultaneously along the whole semi-arid belt” (Cochemé and Franquin 1967).
Fig. 4c) shows the 5-year moving averages of the mean percentage of normal May–September rainfall for stations in the zone 10°–20°N; the number of stations used in the analysis increases from 6 at the beginning of the century to 78 from the 1950's onwards (see Fig. 1).
The drought is seen to have a long and orderly evolution and results from the culmination of a dramatic and almost continuous decrease of rainfall since the early 1950's. That drought extended from the Atlantic Ocean to the Red Sea is justification enough for this spatial and temporal smoothing of the time series of rainfall records. Low rainfall throughout this zone was also recorded at the turn of the century, around 1913 and in the 1940's.
This shows that rainfall variations for the entire zone are not random, but show distinct fluctuations over periods of from 10 to 30 years. The range of the fluctuations (5-year movering averages) this century has been from about 70 to 110 per cent of normal. But we also want to know the spatial variations of rainfall with time.
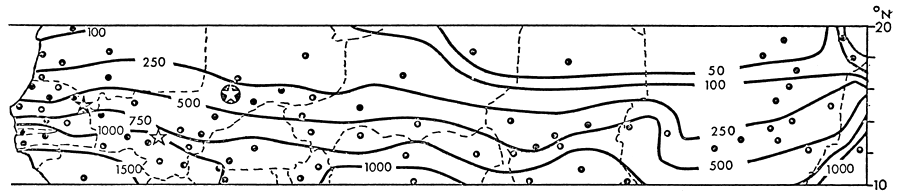
Fig. 1 Map of normal (1931–60) May–September rainfall (mm) in the zone 10°–20°N in Africa. The stations used in the rainfall analyses are indicated by dots. The dashed lines represent international boundaries. The stars show the location of gauges on the Senegal and Niger Rivers (see Fig. 10)
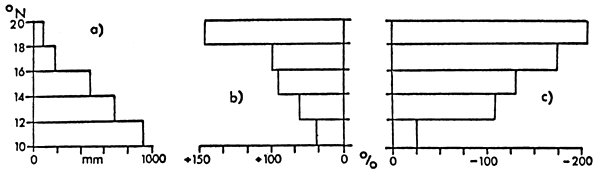
Fig. 2 Zonally averaged: (a) normal (1931–60) May–September rainfall (mm); (b) cumulative percentage deviations from normal May–September rainfall 1952–56 (n=5); (c) cumulative percentage deviations from normal May–September rainfall 1968–72 (n=5)
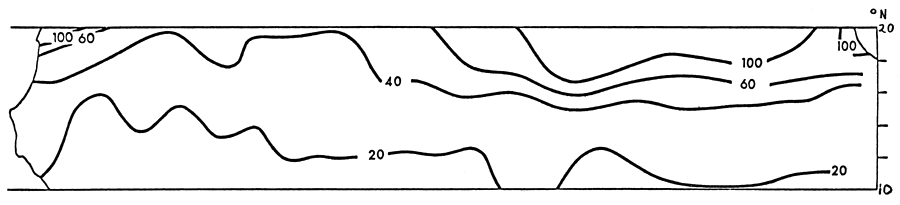
Fig. 3 Map of the coefficient of variability of May–September rainfall (1951–72)
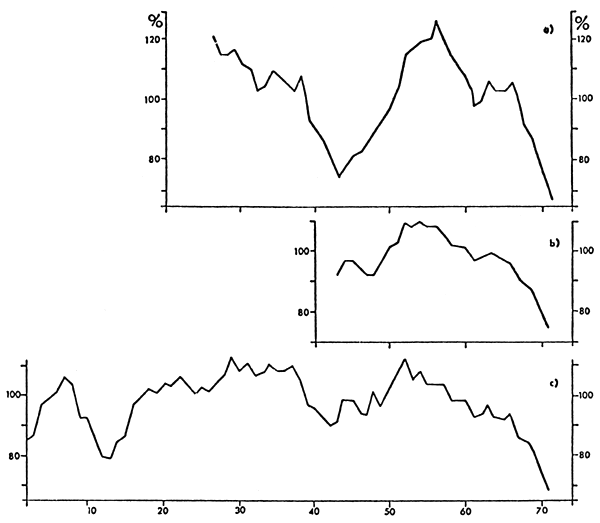
Fig. 4 (a) mean percentage of normal discharge of the Senegal River at Bakel (1901–66) and the Niger River at Diré (1925–66), 5-year moving averages; (b) mean percentage of normal (1931–60) May–September rainfall at 20 stations in the Senegal and Niger catchment basins upstream from Bakel and Diré, 5-year moving averages; (c) mean percentage of normal (1931–60) May–September rainfall for stations in the zone 10°–20°N in Africa, 5-year moving averages
Fig. 5 shows the distribution of the percentage of normal rainfall in 1964, when rainfall throughout the zone as a whole was 109% of normal. Fig. 6 shows the distribution of the percentage of normal rainfall in 1971, when the mean zonal value was 68% of normal.
It is evident that even in a year with good rains, there are still areas with below normal rainfall. Both positive and negative rainfall deviations are largest along the desert margin. There are likely to be only local or regional water and food shortages in such years.
In 1971 there were still some areas with above normal rainfall, notably in the south, although rainfall was below normal along most of the zone, with especially large deficiencies in the north. The more the rainfall for the zone as a whole deviates from normal, the more the deviations become primarily a function of latitude. In such a year water and food shortages are likely to be widespread.
Severe drought on the scale of recent years, however, is caused by the widespread failure of the rains in several consecutive years so that the adverse effects of below normal rainfall accumulate.
Fig. 7 shows the changes in the geographical distribution of rainfall from 1952–56 to 1968–72. Across the width of Africa the isohyets - and hence the desert climate - have shifted southward by 1–2 deg. latitude. Such an apparently small shift has had disastrous consequences in causing drought and disrupting the ecological balance.
In years with good rains the cumulative percentage of above normal rainfall increases with latitude (Figs. 2b) and 8) and in drought years the cumulative percentage of below normal rainfall also increases with latitude (Figs. 2c) and 9). This again illustrates the fact that rainfall deviations are primarily a function of latitude and there is relatively little change at about 10°N.
Although Fig. 3 shows that rainfall variability increases with latitude, the foregoing analysis have shown a high degree of non-randomness in the spatial variations of rainfall with time.
Fig. 10 shows the mean montly discharge of the Senegal River at Bakel and the Niger River at Diré and Koulikora, and the mean monthly rainfall at nearby stations. There is clearly a close relationship between the rainfall regimes and the river regimes at Bakel and Koulikora, with maximum mean monthly discharge a month later than maximum mean monthly rainfall. At Diré further down the Niger, the river regime is quite different. From the low rainfall it is evident that the river discharge is dependent upon the higher rainfall upstream. The less pronounced seasonal peak in December reflects the floodplains between Koulikora and Diré.
As a basis for discussing the relationship between rainfall and river discharges, the mean discharge of the Niger River at Diré and the Senegal River at Bakel has been computed each year and expressed as a percentage of normal (1925–66 at Diré and 1901–66 at Bakel). The mean percentage of normal (1931–60) May–September rainfall at 20 stations in the catchment areas upstream from Diré and Bakel have also been computed for each year.
5-year moving averages of the mean percentage of normal discharge of the Niger and Senegal Rivers and the mean percentage of normal rainfall in the catchment areas are shown in Fig. 4 (a and b). The correlation coefficient (1926–71) is r = + 0.83, which is significant at the 1% level.
Since the 1940's there has been an almost perfect correlation between rainfall in the Niger and Senegal catchment areas (Fig. 4b) and rainfall throughout the zone 10°–20° N: r = + 0.96. We can therefore extend back to 1926 the relationship between rainfall in the zone 10°–20°N (Fig. 4c) and the discharge of the Niger and Senegal Rivers (Fig. 4a): the correlation coefficient of r = + 0.77 is significant at the 1% level. Records of the discharge of the Senegal River extend back to the beginning of the century and the discharge up to 1926 is also closely correlated with the rainfall shown in Fig 4c).
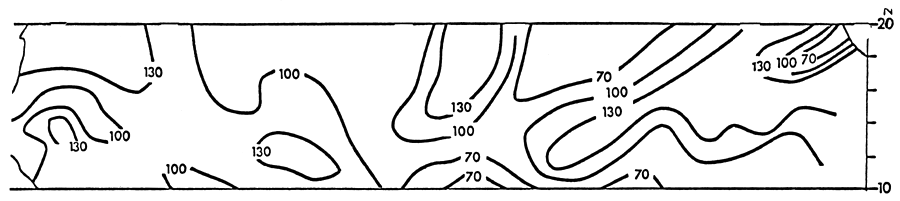
Fig. 5 Map of the percentage of normal (1931–60) May–September rainfall in 1964, when the 10°–20°N zonal average was 109 per cent
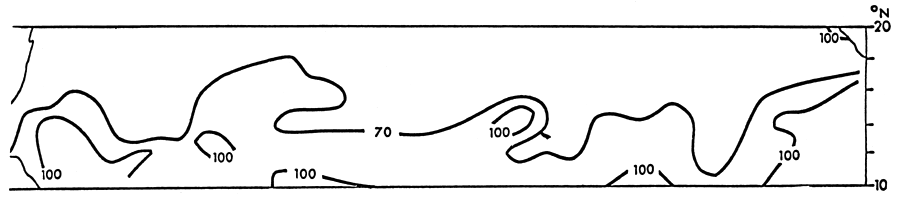
Fig. 6 Map of the percentage of normal (1931–60) May–September rainfall in 1971, when the 10°–20°N zonal average was 68 per cent
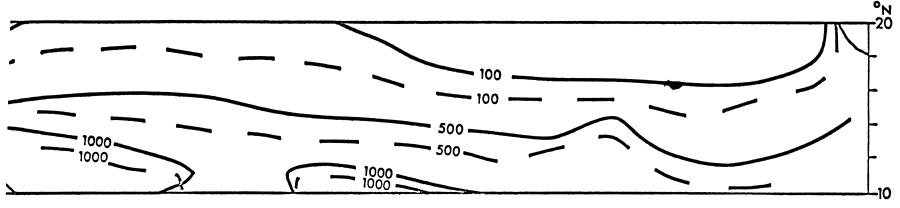
Fig. 7 Map to show the decrease of May–September rainfall as indicated by the southward shift of the isohyets (mm) from 1952–56 (—) to 1968–72 (- - -)
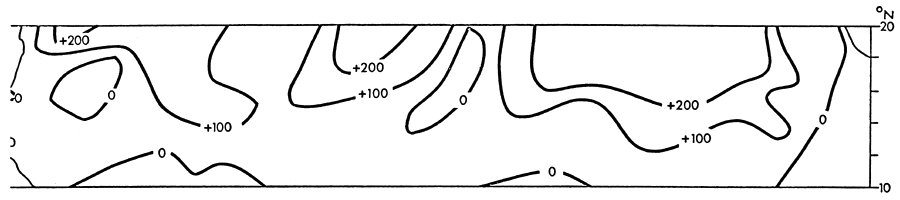
Fig. 8 Map of the cumulative percentage deviations from normal (1931–60) May–September rainfall for the 5-year period 1952–56 (see Fig. 4(c)).
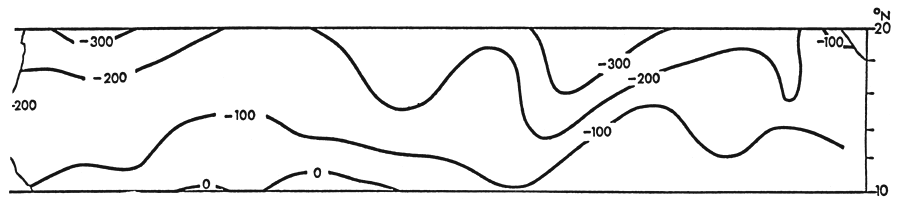
Fig. 9 Map of the cumulative percentage deviations from normal (1931–60) May–September rainfall for the 5-year period 1968–72 (see Fig. 4(c)).
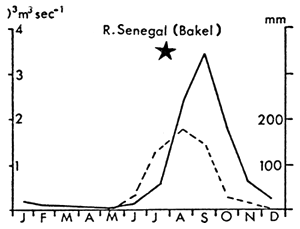 | 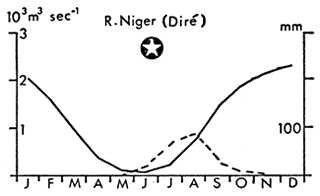 | 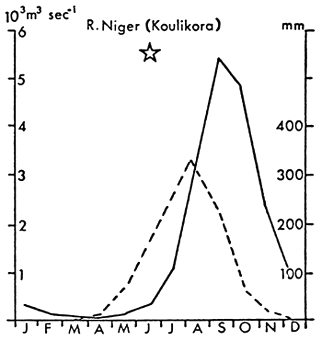 |
Fig. 10 Mean monthly discharge (103m3sec-1) of the Senegal River at Bakel and the Niger River at Diré and Koulikora (——) (see Fig. 1 for locations), and the mean monthly rainfall at the nearby stations of Matam, Tombouctou and Bamako respectively (- - - -)
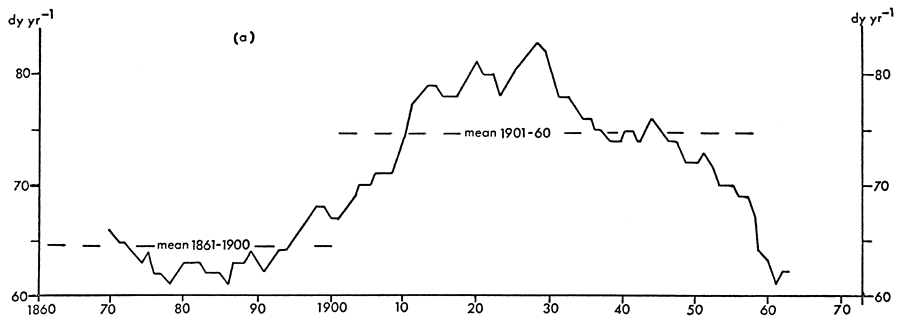
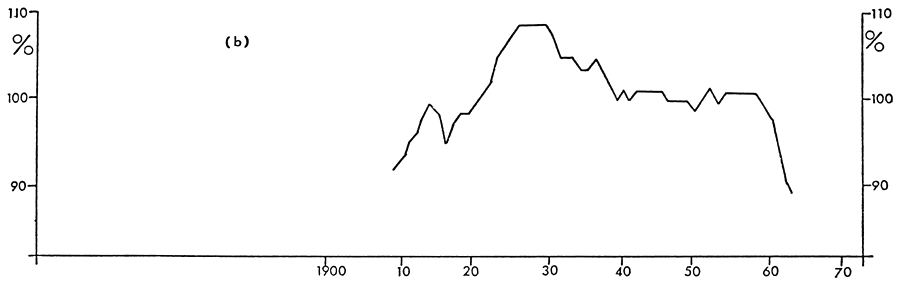
Fig. 11 (a) Frequency (number of days per year) of the Westerly weather type over the British Isles (20-year moving averages); (b) mean percentage of normal (1931–60) May–September rainfall across the zone 10°–20°N in Africa (20-year moving averages).
The atmosphere is an enormous heat engine driven by the energy from the sun. The global atmospheric circulation (that is the patterns of horizontal and vertical air movements over the Earth) in turn drives the oceanic circulation and both operate to redistribute thermal energy from the source regions in the tropics to the sink zones at the poles, thus maintaining an overall thermal balance in the system. The main point is that the circulation of the Earth's atmosphere possesses a high degree of organization on a global scale. The drought in the sub-Sahara zone can be viewed as a regional climatic manifestation of a general planetary-scale fluctuation of the general atmospheric circulation.
Classification of the sequence of weather patterns, day-by-day over many years, facilitates study of the behaviour of the general wind circulation. The British Isles lie within the zone of mid-latitude westerlies, and this region may be looked upon as a fairly representative sample of that zone. Lamb (1972a) has classified the daily sequence of weather patterns over the British Isles from 1861. Variations in the frequency of the Westerly weather type are a good indicator of variations in the strength of mid-latitude westerly winds.
Fig. 11 shows a strong correlation between the frequency of the Westerly weather type over Britain and rainfall in the zone 10°– 20°N in Africa: r = 0.56, which is significant at the 1% level. Fig. 12 shows the scatter diagram and the regression line. But what is the physical basis for this relationship?
The most concise way to describe the atmosphere is to represent the mean structure in a single pole-to-pole cross-section, averaged around the Earth. The strength of the mid-latitude westerlies is determined primarily by the temperature difference between the poles and the equator, which also determines the requirement for meridional (north-south) energy transfer. Fig. 13 shows that the mid-latitude westerlies are strongest in winter: in December–February in the northern hemisphere and June–August in the southern hemisphere. The atmosphere is constantly losing angular momentum to the Earth in regions of mid-latitude surface westerlies and gaining angular momentum in regions of tropical surface easterlies. The total angular momentum of the Earth and its atmosphere about the rotation axis must be constant. Hence, in order to conserve the balance of angular momentum, there must be a regular transfer of angular momentum from the tropics to mid-latitudes, which is shown in Fig. 14. Although these are zonally averaged values, they are considered representative of the situation in the African sector (Newell, Vincent, Dopplick, Ferruzza and Kidson 1969).
Rainfall in the zone 10°–20°N in Africa is associated with the organized ascent of moist air in meso- and synoptic-scale weather systems. It is probable that these systems contribute to the mean meridional (north-south) circulation in the ascending branch of the tropical Hadley cells (see ascent between 10°–20°N in June–August in Fig. 14). In December–February this zone is characterized by descending air (Fig. 14) which inhibits rain producing mechanisms.
This represents the average state of the general atmospheric circulation. But evidence is increasing which shows that the general atmospheric circulation undergoes significant fluctuations in vigour over decades and centuries. Fig. 11a) shows that the vigour of the mid-latitude westerlies increased until about 1930 and has subsequently declined. Fig 15 shows the zonally averaged sea-level pressure profiles for the northern hemisphere in December–February for the first 40 years of this century and for the period 1968–73. The zonal index for the period 1968–73 (measured as the mean difference in surface pressure between 35° and 65°N) decreased by 56% from the 1900–39 value. The June–August zonal index has also decreased (Winstanley, Emmett and Winstanley 1974). The frequency of the Westerly weather type over Britain is therefore seen to be representative of the vigour of the mid-latitude westerlies in the northern hemisphere. It is evident from Fig. 15 that the polar and sub-tropical highs have weakened.
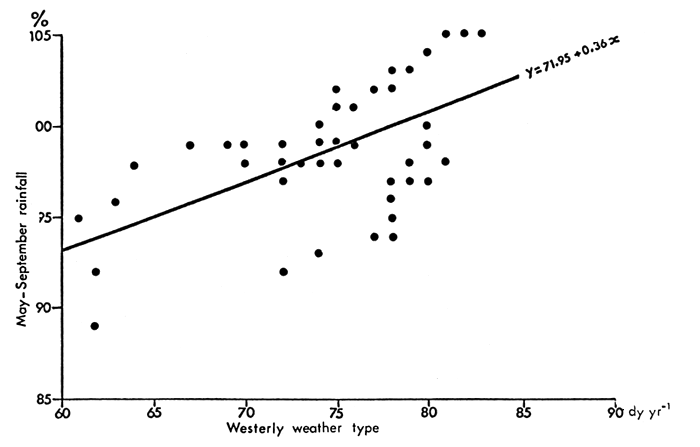
Fig. 12 Scatter diagram to show the relationship between the frequency of the Westerly weather type over the British Isles (number of days per year) and the mean percentage of normal (1931–60) May–September rainfall across the zone 10°–20°N in Africa (20-year moving average values covering the period 1900–73). The regression line was derived by the least squares method
With a dramatic decrease in the vigour of the mid-latitude surface westerlies, it is to be expected there will be less angular momentum generated in regions of tropical surface easterlies, less vertical flux of momentum (and heat) in the ascending branches of the tropical Hadley cells and less poleward transfer of momentum into the friction layer in mid-latitudes.
Fluctuations of rainfall in the sub-Sahara zone can therefore be interpreted as being associated with the changing requirements for energy transfer concomitant with changes in the vigour of the general atmospheric circulation and, possibly, changes of the radiation budget. The recent drought is interpreted as being caused by a decrease in the vertical flux of heat and momentum in a less intense and perhaps latitudinally restricted Hadley cell circulation, concomitant with a decrease in the vigour of the general atmospheric circulation (Winstanley, Emmett and Winstanley 1974).
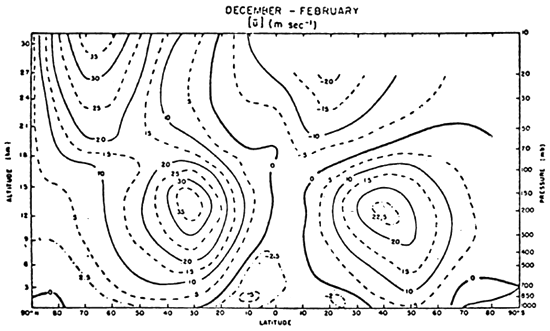 | 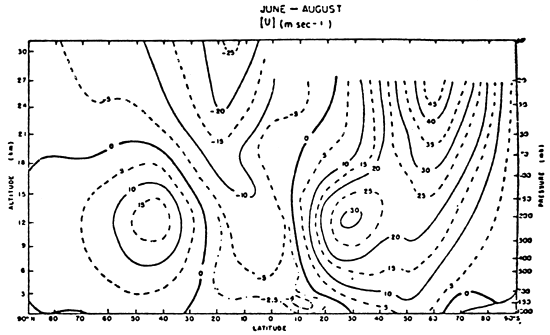 |
Fig. 13 Zonally averaged zonal component of horizontal wind velocity (m sec-1): positive values indicate westerly winds and negative values easterly winds (from Newell, Vincent, Kidson and Boer 1972). The atmosphere gains angular momentum in regions of tropical surface easterlies and loses momentum in regions of mid-latitude surface westerlies.
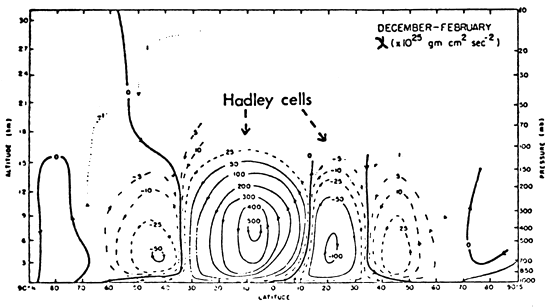 | 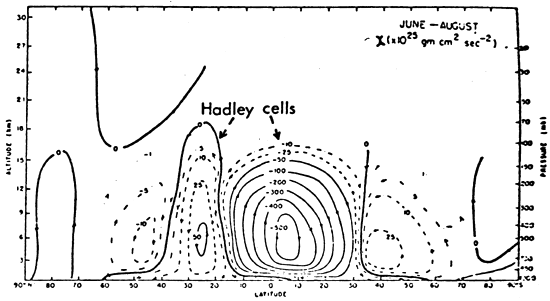 |
Fig. 14 Stream function for zonally averaged absolute angular momentum (x1025gm cm2 sec-2), (from Newell, Vincent, Kidson and Boer 1972). Angular momentum is transported from the source regions in the tropics to the sink regions in mid-latitudes.
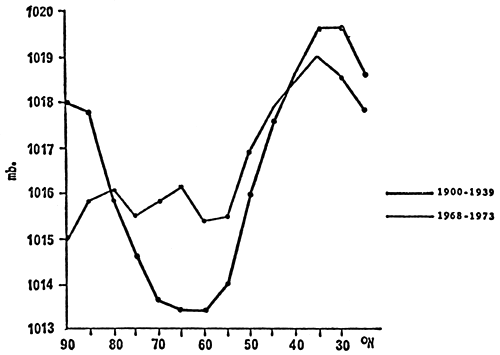
Fig. 15 Zonally averaged sea-level pressure profiles (mb) for the northern hemisphere in December–February (from Winstanley, Emmett and Winstanley 1974)
Bryson (1973; 1974) interprets recent climatic changes as being associated with marked surface cooling in higher latitudes in the northern hemisphere - partly due to man's pollution of the atmosphere with particulate matter. The hypothesis is that the increased equator-to-pole temperature gradient has strengthened the zonal flow, displaced the subtropical highs and monsoons towards the equator and contributed significantly to the drought in the sub-Sahara zone. The above analysis, however, shows that the general atmospheric circulation has decreased in vigour. It seems unlikely, therefore, that man has contributed significantly, if at all, to causing the drought.
The levels of the rivers until the end of the century could strongly determine the economic viability of protecting and developing fisheries in West Africa. The availability of water will probably be one of the major constraints in many development programs in the zone.
The question is simple: can we safely assume a stationary climatology as the best long-range forecast, or is there evidence of long-period cycles and trends?
If we regard the time series of annual precipitation as stationary, then the mean value for the remainder of the century should be the same as the mean value for the period 1900–73. But the zonal mean value for the period is 4% below the 1931–60 normal. This immediately raises the important point that the so-called climatological “normal” values are not necessarily representative of a longer time series: they are “normal” only by international agreement.
In view of the previously established statistically highly significant correlation between rainfall and river discharge, we can estimate the future mean discharge of the Senegal and Niger Rivers assuming a stationary climatology. The mean discharge of the Senegal would be about 2% or 15 m3 sec-1 below the mean 1901–66 value of 771m3 sec-1, but the mean discharge of the Niger would be about 4% or 45 m3 sec-1 below the 1925–66 value of 1180m3 sec-1. Presumably there would continue to be quasi-cyclic fluctuations in the range ± 25% of the mean value (5-year moving average values) over periods of from 10 to 30 years. It seems almost certain that there will be another extended period of about 6–10 years with below normal rainfall by the turn of the century.
A much more difficult problem arises when trying to evaluate the evidence for cycles or trends over periods of centuries. Rainfall and river discharge records in West Africa are simply too short to reveal changes on this time scale. The only feasible approach is to relate rainfall records in West Africa to longer period atmospheric circulation and climatic indices in other parts of the world; it is then reasonable to assume that any trends or periodicities in the latter will also exist in the former.
The foregoing analysis has shown a statistically significant correlation this century between rainfall in the zone 10°–20°N and the frequency of the Westerly weather type over Britain (Figs. 11 and 12). In the discussion I suggested a physical basis for this relationship. It is evident from Fig. 11, however, that the Westerly weather type occurred much less frequently (64.5 days per year) in the last 40 years of the 19th Century than in the first 60 years of the 20th Century (75 days per year). From the regression equation derived between the frequency of the Westerly weather type and rainfall in the zone 10°–20°N (Fig. 12) I estimate rainfall in this zone during the last 40 years of the 19th Century to have been 5% below the 1931–60 normal.
How long, then, will the vigour of the general atmospheric circulation and rainfall in the sub-Sahara zone remain at lower levels than those prevailing for the first 60 years of this century?
The day-to-day frequency of the Westerly weather type is known only from 1861. But there is a positive correlation between the strength of the general atmospheric circulation (as indicated by the frequency of the Westerly weather type) and the frequency of south-westerly surface winds, and annual temperature and precipitation in Britain (Lamb 1972 b)1. Observations of temperature extend from 1680 and Lamb (1972 b) has derived temperatures back to the year 900 A.D. Rainfall has been recorded from 1740 and Lamb has again derived values back to the year 900 A.D. Lamb has also derived the frequency of south-westerly surface winds over Britain directly from observations since 1670 and indirectly for earlier periods.
From Fig. 16 it is evident that temperatures, rainfall and probably the vigour of the general atmospheric circulation declined from a peak in the 13th Century to a minimum in the 17th Century. This was the period of “The Little Ice Age” when glaciers advanced and the River Thames was frozen quite frequently. There was a steady recovery from the 17th Century to about 1930, during which time glaciers receded. In the second half of the 20th Century, however, the vigour of the general atmospheric circulation has again decreased (Fig. 11 a) and the global temperature has fallen by about 0.3 – 0.4°C.
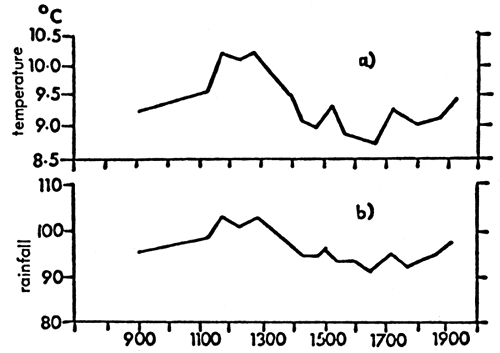
Fig. 16 (a) Temperatures (°C) prevailing in central England, 50-year averages (from Lamb 1972(b)); (b) rainfall amounts (as percentages of the 1916–50 averages) over England and Wales, 50-year averages (from Lamb 1972(b)).
The following points lead to the conclusion that the tendency toward a decrease in the vigour of the general atmospheric circulation and cooler climates will persist to at least the end of the century:
the decrease of global temperature and of the vigour of the general atmospheric circulation in the second half of this century is probably the largest sustained decrease for several hundred years and seems to be more than a short-term fluctuation;
most climatic forecasts expect this regime to continue (W.M.O. 1972);
temperatures as high as those of the last century have occurred for only about 10% of the time during the last half million years (Emiliani 1972), thus making cooler climates more “normal” than conditions in the first half of this century;
there is evidence of a 200-year cycle in temperature, rainfall and the frequency of south-westerly winds over Britain (Lamb 1972 b), with projected lows in 2050, 2050 and 2010 respectively.
From the discussion on the relationship between the vigour of the general atmospheric circulation and rainfall in the sub-Sahara zone, it seems likely that rainfall in the zone 10°–20°N will probably be lower during the remainder of the century than during the climatological normal period 1931–60. We can make several estimates and guesses as to how much lower:
A linear projection of the best fit line (from the late 1920's to the 1960's) of the 20-year moving average values of rainfall in the zone 10°–20°N (Fig. 11 b) gives a 20-year average value of about 15% below normal rainfall in 1990. This would be associated with a 20-year average value of the frequency of the Westerly weather type of less than 40 days per year (Fig. 12).
If we assume that the vigour of the general atmospheric circulation until the end of the century will be the same as during the period 1861–1900, with about 64.5 days per year with the Westerly weather type over Britain (Fig. 11 a), then rainfall will be about 5% below normal (Fig. 12).
A median guess is that rainfall will average about 10% below normal for the rest of the century.
From the regression equation derived from the 5-year moving average values of the mean discharge of the Niger and Senegal Rivers and rainfall in the zone 10°–20°N (1927–71), it is estimated that rainfall 10% below normal would produce river discharge about 9% below normal.
94% of mean annual rainfall in the zone 10°– 20°N occurs in the period May–September.
Although rainfall decreases with increasing latitude and becomes more variable from year to year, there is a high degree of non-randomness to the geographical variations of rainfall with time. Zonal averaged annual rainfall fluctuates from about 50 to 130% of the 1931–60 normal. 5-year moving average values of zonally averaged rainfall show distinct quasi-periodic fluctuations from about 70 to 110% of normal over 10 to 30 years.
When there are several consecutive years with below normal rainfall throughout the zone, the cumulative percentage deviations from normal rainfall and the severity of drought increase from 10° to 20°N. When there are several consecutive years with above normal rainfall, the cumulative percentage deviations from normal rainfall also increase with latitude. That is both the year to year and the decade to decade variability of rainfall increase with latitude.
Zonal average rainfall in the climatological normal period 1931–60 was 4% above the zonal average for the period 1900–73.
5-year moving average values of the mean discharge of the Niger Senegal Rivers are very highly correlated with zonal averaged rainfall. Annual discharge of the Niger and Senegal Rivers varies from about 35 to 160% of normal. 5-year moving average values of the discharge show distinct quasi-periodic fluctuations from about 65 to 120% of normal.
Assuming a stationary climatology (i.e. a continuation of 1900–73 mean values), rainfall in the zone 10°– 20°N will be 4% below the 1931–60 normal for the remainder of the century, with at least one 6–10 year drought period by the turn of the century.
20-year moving average values of zonally averaged rainfall increased from the beginning of the century to about 1930 and have subsequently decreased. It is postulated that this represents a regional climatic fluctuation concomitant with the changing vigour of the general atmospheric circulation and that rainfall in this zone is dependent upon the requirements for angular momentum and heat transfer from the tropics to higher latitudes.
There is evidence from other parts of the world that the vigour of the general atmospheric circulation undergoes significant variations over decades and centuries. It is to be expected, therefore, that rainfall in the sub-Sahara zone also changes on these time scales. A reasonable guess is that zonally averaged rainfall and the discharge of the Niger and Senegal Rivers will be some 10% below the 1931–60 values for the remainder of the century, with continuing 10–30 year quasi-cyclic fluctuations in the range from 65–120% of this mean value.
It is possible that the world's climates might be changed by man by the end of the century, but it is impossible at this stage to say how the climate of the sub-Sahara zone might be affected.
It seems unlikely that we will have a generally accepted theory of climate and climatic change - and hence a rigorous scientific basis for climate forecasting - for some time to come. In the meantime important decisions concerning long-term development programs must be made on the basis of our existing and admittedly imperfect knowledge.
Bryson, R.A., 1973 Drought in Sahelia, The Ecologist, (3):366–71
Bryson, R.A., 1974 A prospective on climatic change, Science, (184):753–60
Cochemé, J., and Franquin, P., An agroclimatology survey of a semi-arid area in Africa south of the Sahara, W.M.O.Tech.Note, (86):136 p.
Emiliani, C., 1972 Quaternary hypsithermals, Quaternary Research, (2):270–3
Lamb, H.H., 1972 a British Isles weather types and a register of the daily sequence of circulation patterns 1861–1971, Geoph.Mem., London, (116):85 p.
Lamb, H.H., 1972 b Climate: present, past and future, Methuen, London, (I):613 p.
Newell, R.E., Vincent, D.G., Dopplick, T.G., Ferruzza, D., & Kidson, J.W., 1969 The energy balance of the global atmosphere. In, The global circulation of the atmosphere, (ed. G.A. Corby), (Roy. Met. Soc., London), 42–90
Newell, R.E., Kidson, J.W., Vincent, D.G., & Boer, G.J., 1972 The general circulation of the tropical atmosphere and inter-actions with extra-tropical latitudes, (M.I.T. Press), (I):258 p.
Senior, M.R., 1969 Changes in the annual variability of rainfall over Britain, Weather, (24):354–9
Winstanley, D., Emmett, B., & Winstanley, G., 1974 Climatic changes and the world food supply, Environment Canada, Planning and Finance Service Report (5) (in the press)
WMO 1972 Climatic fluctuation and the matter of foresight, (unpublished)
THE SIGNIFICANCE OF CLIMATIC FLUCTUATIONS IN WEST AFRICA FOR THE ECONOMIC VIABILITY OF THE KPONG HYDRO PROJECT
by
Derek Winstanley
Table I. Matrix to show the percentage probability of the zonally averaged (10–20°N) rainfall falling below different levels in any one year and for up to 9 consecutive years.
| Number of years | |||||||||
| % normal (1931–60) | 1 | 2 | 3 | 4 | 5 | 6 | 7 | 8 | 9 |
| < 100 | 57 | 35 | 24 | 17 | 14 | 10 | 7 | 4 | 1 |
| < 90 | 35 | 19 | 12 | 7 | 4 | 3 | 1 | ||
| < 80 | 16 | 5 | 3 | ||||||
| < 70 | 5 | 3 | 1 | ||||||
| < 60 | 3 | 1 | |||||||
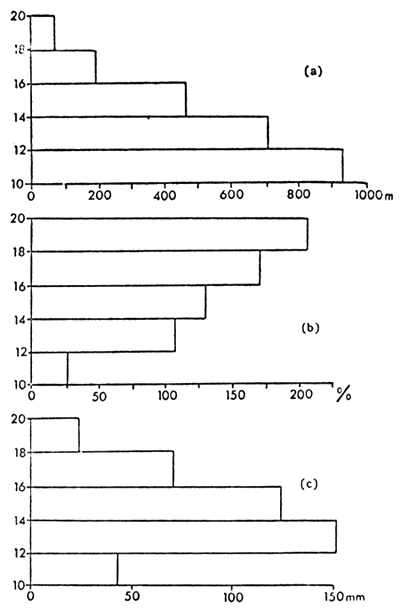
Figure 1 Zonally averaged analyses of May–September rainfall
at 44 stations between 10–20°N in Africa.
(a) Normal (1931–60) rainfall
(b) Mean cumulative percentage deviations from
normal rainfall for the period 1968–72
(Data sources: E.S.S.A. (1967); Monthly Climatic Data for the World 1961–72)
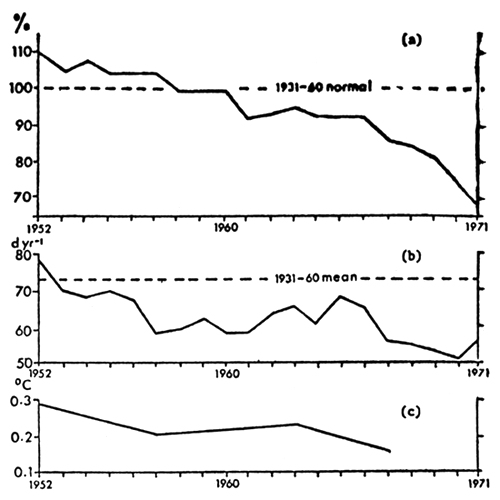
Figure 2 (a) 5-year running-means of the mean percentage of normal
(1931–60) May–September rainfall at 78 stations between
10–20°N in Mauritania, Senegal, Gambia, Guinea, Mali, Niger,
Chad, Nigeria, Dahomey, Central African Republic, Togo,
Upper Volta and Sudan
(b) 5-year running-means of the number of days per year
characterized by the Westerly weather type over Britain
(c) Trend of global mean surface air temperature
(Data sources: E.S.S.A. (1967); Monthly Climatic Data for the World 1961–73; C.R.U.M.B. (1973); Lamb (1972); N.C.A.R. (1970)
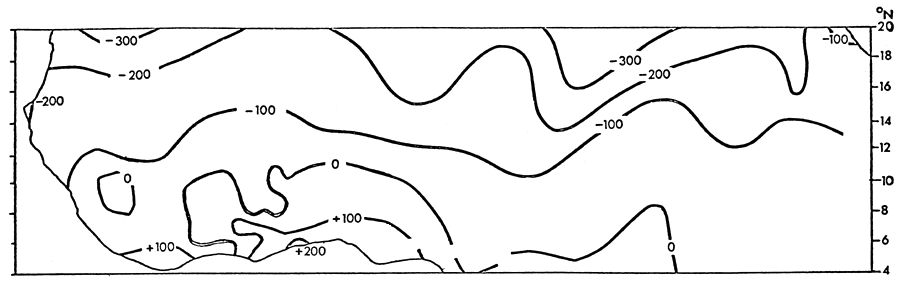
Figure 3 Cumulative percentage deviations from normal (1931–60) May–September rainfall in the sub-Sahara zone of Africa 1968–1972
(Insolation, Rainfall)
Summary definition of the concept of autoregulation at a variable periodicity
Application to the study of rainfall profile at Maiduguri (Nigeria)
PRELIMINARY REPORT
Rapporteur: J. Louis
Laboratoire de Génétique Evolutive et de Biométrie
du Centre National de la Recherche Scientifique
Groupe des Laboratoires du C.N.R.S.
91190 - GIF-sur-Yvette (France)
The means employed at world scale in view of improving the rainfall forecasting methods corroborate the importance of the problem because in many cases drought affects or bears down the economy of whole regions during too long periods. At the moment it is almost impossible to make forecasts more than one week in advance and this only towards 1980. Consequently it was urgent to look for other means of expanding the field of research on long term forecast and thus allow better planning of resource development. The last two years it became more and more obvious that the annual level of rainfall could not be considered as merely subjected to hazard. Research completed these last months to prove it lead to the observation of a certain amount of phenomena which are not yet known and which will need to be studied thoroughly for years.
Before describing roughly the methods used and the results obtained it is necessary to state a certain amount of facts which seem to become more and more important nowadays.
the monthly splitting of the meteorological recordings seems to be a purely academic operation without any actual relation with an eventual periodicity of the natural phenomena (see fig. 1).
the recording in hours and millimeters of insolation and rainfall sometimes give an illusive accuracy which should be eliminated in order to show some great natural topics of variation. It is more convenient to work on rounded values.
direct information brought by measurements only give evidence of the received quantity of energy, it is also necessary to consider the deviation between the values and get used to think in terms of difference of energetic potentialities.
Taking this into account it becomes possible to present a certain number of laws and corollaries the existence of which seems clearly stated now.
The analyzed series cover a 40 year period (1931 to 1972), the data have been obtained by the ordinary means (pluviometers, Jordan or Campbell heliographs) (fig. A).
Table I compares solar activity (col. 2) with the rainfall height at Maiduguri (col. 6).
Solar activity is estimated from the average number of sun-spots recorded annually (Wolf numbers). They have been rounded off (col. 3). Deviations between a given year and the year before are in col. 4 and 5. The same simplifying process has been used for rainfall (col. 7, 8 and 9).
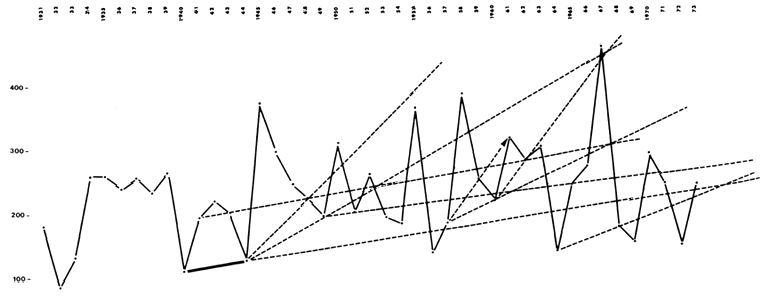
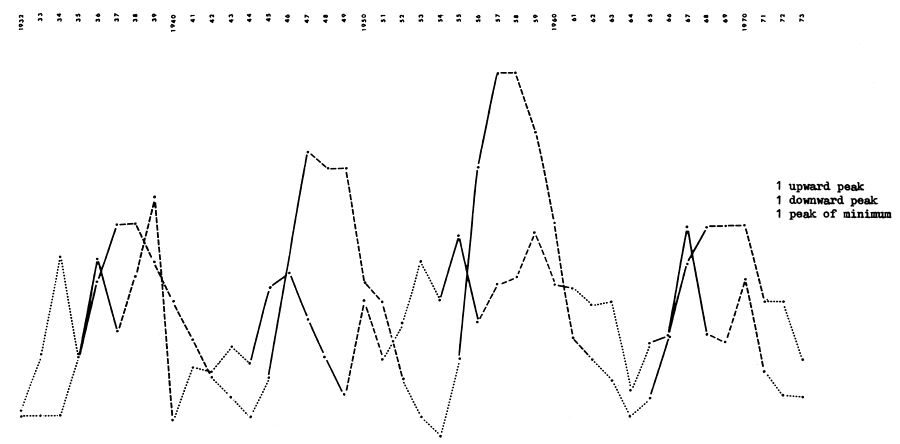
In order to bring out a maximum of information from the profiles (fig. 2a) all the linear combinations between the annual points have been drawn linking them every second year with straight lines. Rapidly it appeared that certain alignments cannot be due to hazard. Thus all the virtual structures have been brought out. Only those showing an obvious interest have been retained. Fig. 2 shows these alignments on the annual profile and on the profile representing the amount of rainfall during the rainy season (July, August and September).
Fig. A
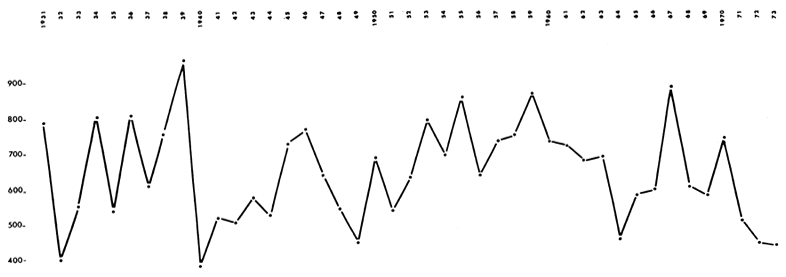
MAIDUGURI (NIGERIA) Profile of the annual rainfall over 40 years
Fig. 1
MAIDUGURI (NIGERIA) Rainfall in August (no observable relation)
Fig. 2a
Annual Rainfall Bases of peaks
MAIDUGURI (NIGERIA)
Fig. 2b
Rainy season July–August–September Bases of peaks
MAIDUGURI (NIGERIA)
Table I shows:
that the total of the positive deviations as stated in a period of increasing solar activity (+ + …) is equal to the total of the deviations as stated in a period of decreasing solar activity (- - …).
Between 1945 and 1954 one can observe a - 1 deficit, which is compensated at the next cycle (1954 – 1964) by + 1 (+ 14 – 15; + 19 – 18). That characteristic is probably related to the sinusoidal aspect of the solar activity curves.
concerning rainfall (table I, col. 7, 8 and 9) it is also obvious that periodically the deviations cancel each other.
Examination of the annual series recorded in Paris, Marseille, Perpignan for one hundred years entirely confirms the periodicity of these annulments. From this phenomenon it is possible to draw a first law.
Law
The algebraic sum of the deviations tends to annulling itself within a local adjustment year at each inversion period of the solar activity.
Corollary
Between each of these periods the adjustment of the deviations keeps a strictly local feature depending on the level of the rainfall peculiar to each region.
Table I shows clearly the coincidence of the rainfall deviation annulment periods with the year of sign change of the solar activity, indicated by arrows. Today it appears as extremely likely that we are facing an adjustment phenomenon appearing at the planetary scale.
The fact that within each cycle the solar activity covers a variable amount of years (each cycle averages 11 years) suggests the probable origin of the variable periodicity of rainfalls.
Example: 1933–1936 4 years, 1954–1957 3 years etc..
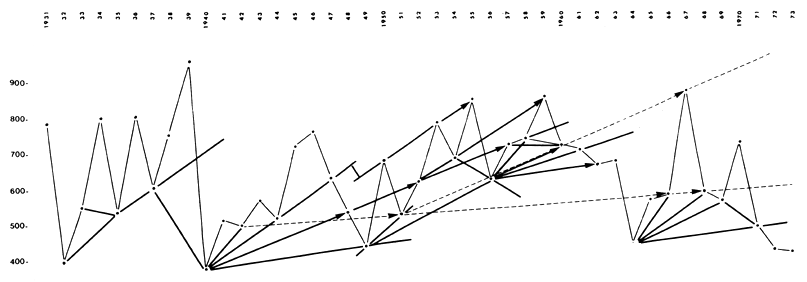
Figure 3 shows that at each ascending, descending and minimum solar period corresponds obviously a peak (called of ascendancy, descendancy and of minimum) which is shifted sometimes in function of the local phenomenon of adjustment. This one is demonstrated below, it superposed to the rhythmicity of the solar activity.
For the time being it has not been possible to link with other aspects the extent of rainfalls with the cyclic solar activity. Concerning the annulments which coincide with the maximum of that activity, one may think that these take place when deviations become weak, that is at the time of solar activity plateaus.
Corollary
The insolation obviously correlated inversely with rainfalls, follows the same theme of annulment.
This could be checked at seven points of the French Mediterranean region during the last 40 years. The adjustments are done exactly at the same periods (± one year).
Table I
| Years | Wolf numbers | rounded | sign | deviation | Annual rainfall | rounded | sign | deviation | |||||||||
| COL. | (1) | (2) | (3) | (4) | (5) | (6) | (7) | (8) | (9) | ||||||||
| 1931 | 21 | 2 | 784 | 8 | |||||||||||||
| - | 1 | - | 4 | ||||||||||||||
| 1932 | 12 | 1 | 395 | 4 | |||||||||||||
| - | 0 | + | 1 | ||||||||||||||
| 1933 | 6 | 1 | → | 547 | 5 | ||||||||||||
| ⊕ | 0 | + | 3 | ||||||||||||||
| 1934 | 9 | 1 | 798 | 8 | |||||||||||||
| + | 3 | - | 3 | ||||||||||||||
| 1935 | 37 | 4 | + 10 | 536 | 5 | + 1 | |||||||||||
| + | 4 | + | 3 | ||||||||||||||
| 1936 | 80 | 8 | 803 | 8 | |||||||||||||
| + | 3 | - | 2 | ||||||||||||||
| 1937 | 113 | 11 | → | 605 | 6 | ||||||||||||
 | 0 | + | 2 | ||||||||||||||
| 1938 | 106 | 11 | 756 | 8 | |||||||||||||
| - | 2 | + | 2 | ||||||||||||||
| 1939 | 90 | 9 | 960 | 10 | |||||||||||||
| - | 2 | - | 6 | ||||||||||||||
| 1940 | 66 | 7 | 375 | 4 | |||||||||||||
| - | 2 | - 10 | + | 1 | 0 | ||||||||||||
| 1941 | 50 | 5 | 513 | 5 | |||||||||||||
| - | 2 | - | 0 | ||||||||||||||
| 1942 | 30 | 3 | 499 | 5 | |||||||||||||
| - | 1 | + | 1 | ||||||||||||||
| 1943 | 15 | 2 | 569 | 6 | |||||||||||||
| - | 1 | - | 1 | ||||||||||||||
| 1944 | 11 | 1 | → | 520 | 5 | ||||||||||||
| ⊕ | 2 | + | 2 | ||||||||||||||
| 1945 | 33 | 3 | 722 | 7 | |||||||||||||
| + | 6 | + 14 | + | 1 | 0 | ||||||||||||
| 1946 | 93 | 9 | 765 | 8 | |||||||||||||
| + | 6 | - | 2 | ||||||||||||||
| 1947 | 152 | 15 | → | 635 | 6 | ||||||||||||
| 1 | - | 1 | ||||||||||||||
| 1948 | 136 | 14 | 539 | 5 | |||||||||||||
| - | 0 | - | 1 | ||||||||||||||
| 1949 | 135 | 14 | 444 | 4 | |||||||||||||
| - | 6 | + | 3 | ||||||||||||||
| 1950 | 84 | 8 | 689 | 7 | |||||||||||||
| - | 1 | - 15 | - | 2 | + 1 | ||||||||||||
| 1951 | 69 | 7 | 537 | 5 | |||||||||||||
| - | 4 | + | 1 | ||||||||||||||
| 1952 | 31 | 3 | 626 | 6 | |||||||||||||
| - | 2 | + | 2 | ||||||||||||||
| 1953 | 14 | 1 | 790 | 8 | |||||||||||||
| - | 1 | - | 1 | ||||||||||||||
| 1954 | 4 | 0 | → | 691 | 7 | ||||||||||||
| ⊕ | 4 | + | 2 | ||||||||||||||
| 1955 | 38 | 4 | 854 | 9 | |||||||||||||
| + | 10 | + 19 | - | 3 | 0 | ||||||||||||
| 1956 | 142 | 14 | 634 | 6 | |||||||||||||
| + | 5 | + | 1 | ||||||||||||||
| 1957 | 190 | 19 | → | 728 | 7 | ||||||||||||
| 0 | + | 0 | ||||||||||||||
| 1958 | 185 | 19 | 747 | 7 | |||||||||||||
| - | 3 | + | 2 | ||||||||||||||
| 1959 | 159 | 16 | 863 | 9 | 0 | ||||||||||||
| - | 5 | - | 2 | ||||||||||||||
| 1960 | 112 | 11 | 729 | 7 | 0 | ||||||||||||
| - | 6 | - 18 | - | 0 | |||||||||||||
| 1961 | 54 | 5 | 720 | 7 | |||||||||||||
| - | 1 | - | 0 | ||||||||||||||
| 1962 | 38 | 4 | 675 | 7 | |||||||||||||
| - | 1 | + | 0 | ||||||||||||||
| 1963 | 28 | 3 | 686 | 7 | |||||||||||||
| - | 2 | - | 3 | ||||||||||||||
| 1964 | 10 | 1 | 448 | 4 | |||||||||||||
| ⊕ | 1 | + | 2 | ||||||||||||||
| 1965 | 15 | 2 | 576 | 6 | |||||||||||||
| + | 3 | + | 0 | -1 | |||||||||||||
| 1966 | 47 | 5 | + 10 | 593 | 6 | ||||||||||||
| + | 4 | + | 3 | ||||||||||||||
| 1967 | 94 | 9 | 882 | 9 | |||||||||||||
| + | 2 | - | 3 | ||||||||||||||
| 1968 | 106 | 11 | → | 602 | 6 | ||||||||||||
| 0 | - | 0 | ||||||||||||||
| 1969 | 106 | 11 | 572 | 6 | |||||||||||||
| - | 0 | + | 1 | ||||||||||||||
| 1970 | 105 | 11 | 737 | 7 | |||||||||||||
| - | 4 | - | 2 | ||||||||||||||
| 1971 | 67 | 7 | 504 | 5 | |||||||||||||
| + | 0 | - | 1 | ||||||||||||||
| 1972 | 69 | 7 | 439 | 4 | |||||||||||||
| - | 3 | - | 1 | ||||||||||||||
| 1973 | 38 | 4 | 436 | 4 | |||||||||||||
Figures 2a and 2b reveal the fact that the base of the peaks when it is ascending is in line with certain years of heavy rainfall, it seems also that in most cases the more the slope of increase of the minima is slight the more the effective relation with the year of heavy rainfall is remote and inversely.
The base of each peak sometimes seems to express thirty years in advance the strength of upward motion of the minima. On fig. 2a and 2b one will notice that all the years of heavy rainfall are corresponding with the base of a preceeding peak. In certain themes, especially at Marseille, these strengths are absolutely parallel for one century.
Law
The base of the peaks can be taken as a vector expressing a strength of upward motion of the minima which determines a year of maximum rainfall, the nearest in the time as the slope of this vector is greater, or its origin is higher.
Inversely it is possible that the bases of the inversed peaks also be in relation with a hypothetical downward strength of the maxima, but this is a hypothesis only. The complex process of the imbrication of the upward slopes of the minima is not yet well known but one can say that at least the years of heavy rainfall are always located on one of the available axis arriving in the zone of maxima (located for the Maiduguri annual profile over 700 mm).
In fig. 2a between 1946 and 1949 a kind of recentering can be noticed. In Paris it has been stated that two axis can have a simultaneous influence, in that case, the annual point is placed at a mid-distance of these two axis. It is remarkable that characteristics of local adjustment shown from virtual structures of the profiles strengthen the principle of the variable periodicity.
In fact everything goes on as if each rainfall level were the resultant between impulses of solar origin and impulses of terrestrial origin. Then we consider for the time being that the concept of auto-adjustment at a variable periodicity of the great basic sources of natural energies in ecology is well established. Unhappily it is not much as we should consider that it is well known and of an immediate application to the forecast studies.
In spite of our reticence to try a forecast which seems premature to us, we give a first provisional argumentation which should only be considered as an example. Table II indicates that the quantity of rainfall every three or four years corresponds to three periods within each solar cycle and that it is situated around a constant value of 2.100 m at Maiduguri (21 constant).
| First solution: 1974 | 837 mm | 1975 | 535 mm | 1976 |
| 650 mm |
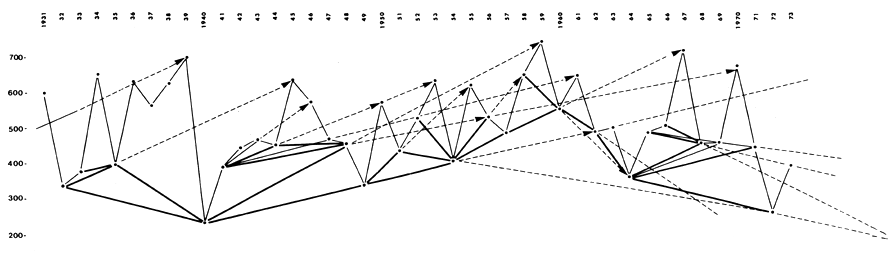
the major homologue axis of the previous series which determines the following major peak in 1974 reaches the mark 837 (fig. 4). It seems to be the only available axis in that part of the graphic.
the year 1973 is already an upward motion year if we consider the profile drawn from the rainfall levels during the rainy season (fig. 2b)
the sequence of two years 1972 and 1973 at 400 mm should rapidly induce a strong upward motion during the two following years.
the value 837 would properly balance the fourth solar cycle in 1974 (- 1).
Other possibility: 1974 650 mm 1975 875 mm 1976
upward motion in 3 years (1973 – 1974 – 1975) as for the two previous series.
Fig. 3
MAIDUGURI (NIGERIA) 1st trial of adjustment of the rainfall course to the course of the solar activity
Fig. 4
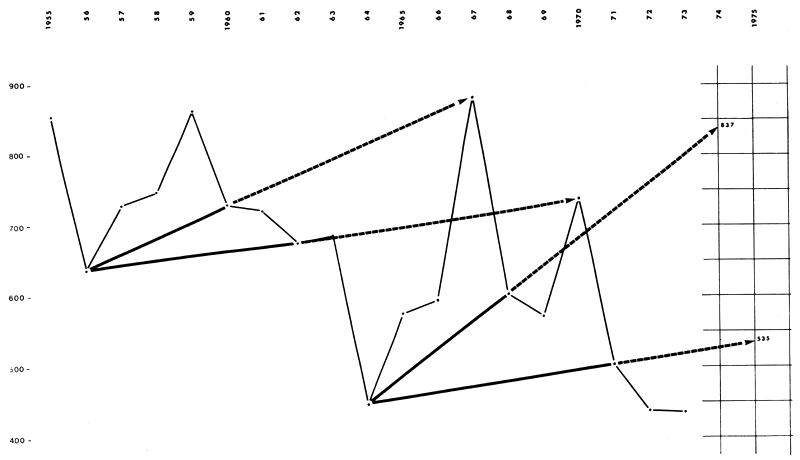
MAIDUGURI (NIGERIA) Annual rainfalls, tentative forecasts
| Table II | |||||||||||
| first solar cycle 1934 – 1944 | second solar cycle 1945 – 1954 | ||||||||||
| average activity | stronger activity | ||||||||||
| maximum 113 spots in 1937 | maximum 152 spots in 1947 | ||||||||||
| rainfall | rainfall | ||||||||||
| 1934 | 798 | strong upward motion of the solar activity | 1945 | 722 | strong upward motion | ||||||
| 1935 | 536 | 1946 | 765 | ||||||||
| 1936 | 803 | 1947 | 635 | ||||||||
| 2137 → 21 | 2122 → 21 | ||||||||||
| 1937 | 605 | strong decrease | 1948 | 539 | strong decrease | ||||||
| 1938 | 756 | 1949 | 444 | ||||||||
| 1939 | 960 | 1950 | 689 | ||||||||
| 2321 → 23 | 1951 | 537 | |||||||||
| deviation + 2.21 rounded at | + 2 | 2209 → 22 | |||||||||
| deviation + 1.09 | rounded at | + 1 | |||||||||
| 1940 | 375 | end of cycle | 1952 | 626 | end of cycle | ||||||
| 1941 | 513 | 1953 | 790 | ||||||||
| 1942 | 499 | 1954 | 691 | ||||||||
| 1943 | 569 | ||||||||||
| 1956 → 20 | 2107 → 21 | ||||||||||
| deviation - 1.44 | no adjustment at the end of cycle + 1.09 apparently, gain non compensated | ||||||||||
| 1944 | 520 | adjustment year | |||||||||
| 569 - 520 = - 0.49 | |||||||||||
| - 0.49 – 1.44 = - 1.93 | |||||||||||
| rounded at | - 2 | ||||||||||
| the deviation of 1939 is compensated | |||||||||||
| third solar cycle | fourth solar cycle | ||||||||||
| strong activity, high peak | weaker activity | ||||||||||
| maximum 190 spots in 1957 | maximum 106 spots in 1968 | ||||||||||
| 1955 | 854 | strong upward motion of the solar activity | 1965 | 576 | strong upward motion | ||||||
| 1956 | 634 | 1966 | 593 | ||||||||
| 1957 | 728 | 1967 | 882 | ||||||||
| 2216 → 22 | 2051 → 21 | ||||||||||
| deviation + 1.16 rounded at | + 1 | deviation - 0.49 | |||||||||
| 1958 | 747 | strong decrease | 1968 | 602 | strong decrease | ||||||
| 1959 | 863 | 1969 | 572 | ||||||||
| 1960 | 729 | 1970 | 737 | ||||||||
| 2339 → 23 | 1911 → 19 | ||||||||||
| deviation + 2.39 rounded at | + 2 | deviation - 1.89 | rounded at | - 2 | |||||||
| ↓ | |||||||||||
| 1961 | 720 | end of cycle | + 3 | 1971 | 504 | end of cycle | |||||
| 1962 | 675 | 1972 | 439 | ||||||||
| 1963 | 686 | 1973 | 436 | ||||||||
| 2081 → 21 | 1974 | 837 | (?) | ||||||||
| deviation - 0.18 | 2216 → 22 | + 1 | |||||||||
| 1964 | 448 | year of adjustment | the 837 mm forecast value is supplied by the major axis of Fig.4 In this case the cycle would be in deficit of - 1 (this would compensate the 0.99 of the previous cycle) | ||||||||
| 686 - 448 = - 2.38 | |||||||||||
| - 2.38 - 0.18 = - 2.56 | |||||||||||
| rounded at | - 3 | ||||||||||
| (The actual not rounded deviations show a gain of + 0.99 suppose + 1 for the cycle.) | |||||||||||
| A relation is noticed between the strong solar activity, the size of the deviations and of the gains acquired with difficulty, compensated during the adjustment year | |||||||||||
The first solution seems to be more likely because the 650 value in 1973 would bring a - 4 deficit for the fourth solar cycle, a value which has never been observed, mainly at the end of a cycle. This value should imperatively be compensated at the next cycle 1975…
Up to now the first ascending peak always appeared 1 or 2 years before the first solar maximum, this seems to confirm the first hypothesis.
Based on the only elements which have been gathered for two years it is obvious that it is too early to pretend to make convenient forecasts. Moreover the concept of auto-adjustment at a variable periodicity can be regarded as clearly set and it can constitute a first stable basis in the future research in this field. Nevertheless for the time being our experience is still too recent and the information we have is too limited.
It is probable that the first forecasting analysis will include many errors at least for a certain time.
However, a gate seems to be widely opened to allow long term forecast in the field of the great basic sources of energy of our planet.
Through what freak of physical forces is the rain phenomenon endowed with a “memory” of which the time of retention, in certain cases, may last more than some thirty years. The sole field of ecology does not provide the answer.
![]()
![]()
![]()