![]()
![]()
![]()
(1972 to 1974)
A. Chouret
Hydrologist, ORSTOM, N'Djamena
J. Lemoalle
Hydrobiologist, ORSTOM, N'Djamena
Since the beginning of the century, Lake Chad, which is fed by the Chari River, has had periods of high water level and periods of low water level such as during 1906, 1914 and 1944. The level has been decreasing once more since 1964, and reached a fairly low level during 1973 and 1974 as a result of extremely low floods of the Chari. This last period of level lowering is described, together with its consequences on the shape of the lake which, due to its shallowness, is highly sensitive to water level changes. The lake water area, which was 18 000 km2 during 1967–69, decreased to 9 000 km2 during July 1973 and 1974. A new map of the lake has been drawn, which shows the splitting of the lake into two parts: the northern basin in which the level has been decreasing by 1.9 m during one year, and the apparition of a 5 000 km2 marsh in the southern basin. Level forecasts have been made for early 1975.
Depuis le début du siècle, le lac Tchad, tributaire des crues du Chari, a connu des périodes de hautes eaux et des périodes de basses eaux, notamment vers 1906, 1914, 1944. Il a baissé à nouveau depuis 1964 pour atteindre un état particulièrement bas en 1973 et 1974 à la suite de crues exceptionnellement faibles du Chari. C'est cette dernière baisse de niveau qui est décrite, avec ses conséquences sur l'aspect du lac qui, du fait de sa faible profondeur, est très sensible à ces variations. La surface en eau du lac qui était de 18 000 km2 de 1967 à 1969, est passée à 9 000 km2 en juillet 1973 et 1974. Une nouvelle carte du lac a été esquissée, mettant en évidence l'isolement de la cuvette nord dont le niveau a décru de 1,9 m en une année, et l'apparition de 5 000 km2 de marécages dans la cuvette sud. Les prévisions sont faites pour début 1975.
The reduced inflows from the Chari over the past two years - an indication of the unusual drought prevailing in the Sahelian Region of Africa - caused, from 1972 to 1974, an abrupt drop in the level of Lake Chad and substantial changes in its appearance.
We wish to express our appreciation to General Auffray and the French Air Force pilots of the Central African Staging Post for their many overflights of the lake, and to the Lake Chad Basin Commission and the National Aeronautics and Space Administration for the photographic material kindly made available. Part of the funds needed for this study was provided by the Cultural Affairs Division of the French Ministry of Foreign Affairs.
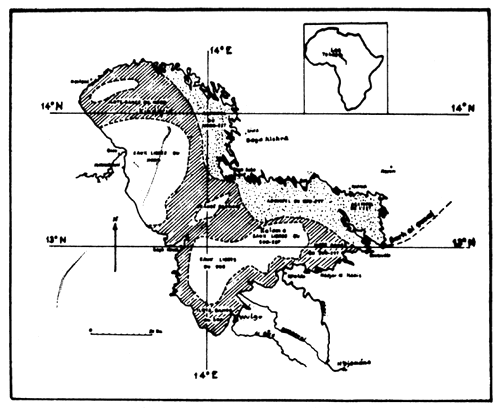
Lake Chad lies between the 12°20' and 14°20' parallels latitude North and the 13° and 15°20' meridians longitude East and has a Sahelian climate (Fig. 1). It is the remnant of the “Paleochad” (Tilho, 1910) which, at a time when the tropical African climate was much more humid, stretched far to the north and was fed by, among others, water courses from the now desertic mountains of the Aïr, Tibesti and Ennedi.
Lake Chad lies in a slightly depressed endoreic basin. Its shores are usually flat and sometimes undefined, so that its appearance and surface area are extremely sensitive to variations in water level. The lake is fed mainly by the Chari (83 percent). The contribution from the other tributaries, El Béïd, Yedseram and Komadougou-Yobé, is insignificant (7 percent), the rest being supplied by rain falling on the lake itself (10 percent). Rainfall decreases from the south to the northwest, the lake being situated between the 550 and 240 mm isohyets. Losses are due mainly to evaporation, which is around 2.2 m per year. Marginal leaks account for not more than 10 percent.
Far from being uniform, the lake possesses varied morphological characteristics over its whole extent. It is possible to distinguish a northern and southern basin separated by a slight constriction of the shores, and a frequently swampy area of shallows known as the “Great Barrier”.
The two basins are bordered to the north and east by a fixed erg in which the tops of the dunes, which point from southeast to northwest, from a vast archipelago. This is continued toward the interior of the lake by islands of vegetation that are actually shallow water-covered dunes colonized by aquatic phanerogams. At an elevation of 281.8 m - the average height of the water surface from 1967 to 1969 - the water area of the lake was 18 000 km2 (Roche, 1971). This represents the “Normal Chad”. At low-water level in July 1973, the northern and southern basins were separated by the emergence of the Great Barrier; the water areas were estimated at a total of 9 000 km2.
The lake was then in the “Small Chad” stage according to the classification proposed by Tilho (1928), who, in addition, identified a “Great Chad” stage corresponding to a waterlevel elevation of around 284 m, which was described by 19th-century travellers but has not been observed since. The high level of the “Great Chad” causes disappearance of the vegetation islands and flooding of the numerous depressions, including the Chad Bahr El Gazhal (Fig. 1) - an ancient and usually dried-up outlet from Lake Chad to the old Borkou lakes -over a distance of 200 km, as reported by the explorer Nachtigal in 1880. The estimated water area is then 20 000 to 25 000 km2 and navigation is possible everywhere, although storms add an element of danger.
The “Normal Chad” is the one observed by Tilho from 1917 to 1919 and noted by us from 1967 to 1969. The water area at this stage is around 15 000 to 20 000 km2, with the water-level elevation at about 282 m. Vegetation islands border the archipelago zones and it is possible if not easy to navigate, for example, the Great Barrier in order to go from the southern to the northern basin.
Finally, the “Small Chad” stage is reached when the water level falls to an elevation of 280 metres. Navigation becomes virtually impossible in the southern basin, which is separated from the northern by the emergence of the Great Barrier. These are the lake conditions observed by Tilho in 1905 and appearing in 1972. It should be noted that if this low level persists for a few years, the northern basin, which then receives virtually no water supplies, may dry up completely.
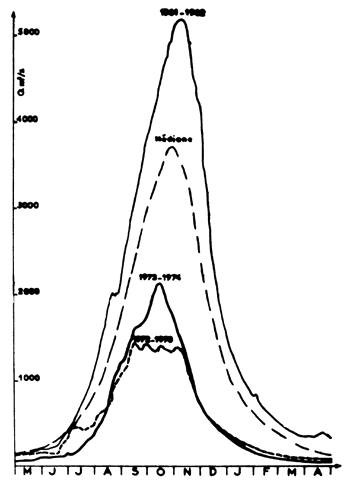
The régime of the main branches of the Chari upstream is of the tropical transitional type. It is rapidly altered by the degraded nature of the network and by the relative dryness encountered in the lower part of the basin. The result is that the Chari régime at N'Djamens and therefore at its arrival in the lake, is of the pure tropical type with a statistical distribution of maximum streamflows conforming more or less satisfactorily to a Gaussian law, as is fairly general in West Africa. The same applies to the annual modules for the period considered - 1932 to 1966 (B. Billon and G. Oberlin, 1969) - on the basis of which the median flood was defined.
Table 1 summarizes the chief characteristics of the floods of 1972–73 and 1973–74 compared with the median flood and the flood of 1961–62, which was the heaviest in the observed series and whose probability of occurrence is once in 50 years. Although the 1973–74 flood has a maximum streamflow exceeding that of 1972–73, the two modules are close and can be regarded as corresponding to a 1-in-100-year drought. Figure 2 clearly shows the place of these two floods in the observation series. It should be noted that since 1965 the modules of the Chari at N'Djamena have all been below the median, resulting even before 1972 in a gradual drop in the level of Lake Chad (Fig. 3).
Table 1
Flood characteristics of the Chari at N'Djamena
| Year | Maximum height m | Maximum quantity m3/sec | Module m3/sec | Annual volume 109 m3 |
| 1972–73 | 4.35 | 1 435 | 543 | 17.5 |
| 1973–74 | 5.55 | 2 130 | 570 | 18.0 |
| Median | 7.86 | 3 690 | 1 280 | 40 |
| 1961–62 | 9.10 | 5 160 | 1 700 | 53.7 |
The relatively small mass of the lake water is a poor absorber of flood inflows and the level undergoes seasonal variations. The lake's hydrological year starts on 1 July with the July–August low water followed by the September–January rise in the level due to the arrival of river flood water whose movement into the lake has been studied by Carmouze (1971) and Roche (1973). The water afterwards subsides as a result of evaporation, which is no longer compensated for by inflows.
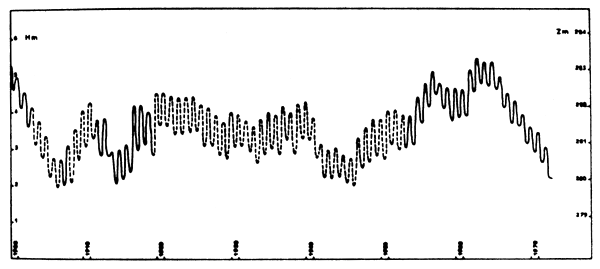
The variations in level have been known at Bol since the beginning of the century (Tilho, 1910) and have been followed regularly by ORSTOM since 1953 (Fig. 3). The Bol station ceased to be representative of the average level of the lake during the partial drying-up of 1973. The values used in the graph are either observed or reconstructed by a correlation between the inflows of the Nile at Aswan which have been known since 1870 and the maximum streamflows of the Chari at N'Djamena, on the basis of which the annual variations in the lake level can be forecast. This correlation, originally made by Bouchardeau (1957), although not very close (r = 0.72), is nevertheless quite significant (Touchebeuf de Lussigny, 1969). The graph of the observed variations has been drawn from elevations smoothed to eliminate the daily and seasonal influences of the winds (Billon, 1965), which can cause sharp differences of around 10 centimetres. Lake Chad is found to have experienced periods of low water from 1906 to 1908 and in 1914, 1945 and 1946, the first of these periods having been described in detail by Tilho (1910). During the years 1963 and 1964, the lake level attained the highest elevation since the beginning of the century and afterwards underwent a constant and regular drop of around 0.3 m per year similar to that which had preceded the minimum of 1906–1908. From 1964 to 1971 the difference between a maximum and the subsequent low water was about 0.8 metres.
In July 1972 even though the lake is subsiding it is still at the “normal Chad” stage as far as water area is concerned. It is important to stress that, for equal levels, the geomorphology of the lake may very greatly depending on whether the lake is in a period of subsidence or of rising water. At the 1972 low water, the average level of the lake has been falling for several years and the often shallow-water surfaces are not colonized by vegetation. This is the case with a large part of the southern basin where boat traffic has been virtually halted, although its appearance has changed little since the previous year. A general alteration, however, is noticed on the southern shore, which is the most sensitive to level variations. A strip of shore 5 to 20 km wide from the Chari delta to Baga Kawa is now above the water. The same applies to the eastern part of the delta; water which was still very close to the Hadjer-el-Hamis rocks in 1971 has now withdrawn several kilometres from them. In the northern basin, which is of greater average depth, the effects of the fall are less marked, although the western shore has advanced slightly.
From July to December 1972 the Chari flood caused no rise in the level of the lake, whose general appearance did not vary. Important changes, the timing of which is presented, appeared after the beginning of 1973.
May 1973
In April and May 1973 the shallowest zones, namely, the Great Barrier, the vegetation island region of the southeastern archipelago and the southern tip of the lake, emerged above the surface. Aerial reconnaissance made it possible to follow the shrinkage of the water over these immense regions, accompanied as it was by the formation of drying up mud-holes and pools. The water also withdrew from the bottoms of the archipelago arms.
Because of its speed and magnitude, the fall in the lake level since 1971 has caused deep changes in lake vegetation, leading to a depletion of the macrophytes along the former banks. During this period of early 1973 this vegetation practically disappeared and was not replaced by another belt nearer the water.
Growths of “ambadjs” (Aeschynomene sp., Sesbania sp.) appeared in scattered form between Baga Kawa and the delta as well as sedges (e.g., Cyperus articulatus) on recently exposed surfaces. Not until July did any substantial growth of vegetation appear on all the exposed surfaces of the southern basin with, in addition to the species already mentioned, Cyperus papyrus, typha, ipomea and ludwigia.
In the northern basin, the effects of the lake subsidence were less spectacular. A coastal strip emerged between Baga Kawa and Nguigmi which did not exceed 5 km in width except in the Baga Kawa Region where it measured 10 kilometres. This basin was isolated from the inflows from the Chari and only a very narrow arm linked it to a residual pocket south of Baga Kawa. Furthermore, the extremities of some bottoms of the archipelago arms were cut, as in the south. On the other hand, vegetation remained very limited in this northern zone of the lake without the striking development noticed in the southern basin.
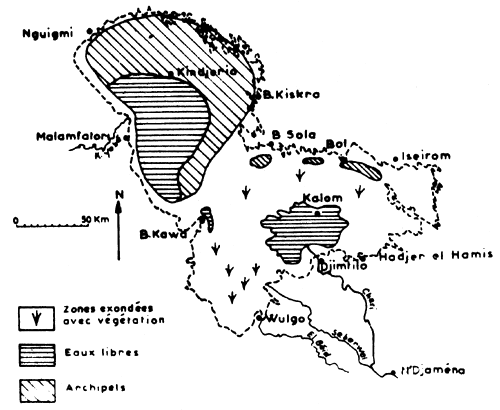
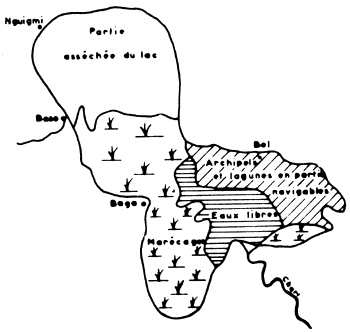
July 1973
Figure 4 depicts the state of the lake at low water in July 1973. The dotted line of the “Normal Chad” frame clearly shows the particular situation at that period. In the southern basin, open water was reduced to a shallow pocket forward of the Chari delta and to a few pools in the southeastern archipelago in the latitude of Bol. These pools were isolated and were concentrated as a result of evaporation. All the exposed bottoms of this basin, both in the open-water region and in the archipelago, were covered with extremely dense vegetation. At this period there was no semi-submerged vegetation; macrophytes had grown on the exposed sediment.
The northern basin, cut off from its supply, underwent a reduction in its surface area; many sandy islands appeared and the new bank was about 5 km from its former position on the west coast. The Great Barrier was totally exposed at this season and could not be distinguished from the other dried-up parts of the southern basin.
October 1973
From May to the end of September the Chari emptied into the only pocket of open water in the south. A map showing the state of the lake at the beginning of October 1973, just when the southern basin started to receive water again, was drawn up following an aerial reconnaissance on 3 October and with the use of the photographic documents supplied by the ERTS satellite (photographs of 22 September and 10 October)1. The pocket of open water in the south grew bigger, while a part of the southeastern archipelago and of the already exposed zones covered at that time with abundant vegetation came under water again. However, the macrophytes were not entirely covered except in a few well-marked open-water branches pointing toward the east and west and in the archipelago.
During a field reconnaissance at the beginning of October we measured the speed of percolation through the swamps of the southern basin. On 9 October the water was about 5 km from Baga Kawa and was moving toward the Great Barrier at a speed of between 5 and 10 cm/sec.
During this period the Great Barrier was still cutting off the northern basin; this was now fed only by rainfall and by the small inflows from the Komadougou-Yobé which had a smaller than usual flood and flowed only from August to November.
December 1973
In the course of fresh serial reconnaissances we followed the changes in the lake up to maximum flooding of the southern basin, which occurred in December. The open water in this basin had kept much the same area. In the southeastern archipelago, open water had appeared, accompanied by the total immersion of macrophytes; at the same time the areas of swamp (half-submerged vegetation) had progressed toward the south and east.
At the beginning of December, areas of dark-coloured water (humic) appeared along the Great Barrier in the northern basin. By means of low-altitude overflights and field missions we were able to note that the progress of the water to the north was diffuse and slow, the current speed being unmeasurable. As a whole, the volume of water crossing the Great Barrier appears to have been quite small.
In the northern basin, the most outstanding feature of this period was the emergence in the open-water region of many sandy and vegetationless islands.
March 1974
The fall in the water in the southern basin had caused only a few changes in the lake's December appearance; in particular, some islands reappeared but, unlike the previous year, they were already covered with vegetation even before their emergence. In the archipelago, which was in the process of being isolated, the open-water areas were slowly decreasing.
The northern basin had been isolated since January and new islands continued to appear in large numbers. Very pronounced development of ambadjs (Aeschynomene elaphroxylon) was noticed in the vicinity of the Great Barrier.
July 1974
The water level of the southern basin was appreciably the same as at the same season a year earlier. The water areas were of the same order of magnitude and the only difference was the persistence of abundant vegetation extending far and wide over the Great Barrier. It seemed, however, that the sediments had settled during the emergence of the previous year and that, for equal water levels, the depth was slightly greater.
In the northern basin, whose level had undergone a large drop (about 1.90 m) over the previous year, the 1973 open-water area, where a very large number of islands had appeared, was now almost a new archipelago. Nearer the coast in the original archipelago, the islands were interlinked by many exposed shelves.
1 This document is in the files of the ORSTOM Centre, N'Djamena
In order to follow the variations in level in the main regions of the lake with greater accuracy, the level-recording network was supplemented from 1973 onwards by new stations.
In particular, the two major northern and southern areas of open water were studied at the island of Kindjéria and the island of Kalom by means of water-level recorders, as was also done for the Baga Kawa region. The elevations given in the text are indicative only of the variations in level, the zeros of the different gauges not yet being linked to the general levelling except in the case of the older stations of Bol, Malamfatori and Nguigmi.
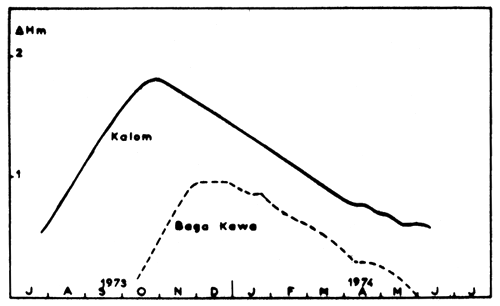
The Kalom island station was put into service in July 1973. The peak of the Chari flood at N'Djamena occurred on 14–15 October 1973 and appeared at Kalom on 25 October (Fig. 5). Flood propagation was therefore particularly rapid. From July to October 1973 the level rose by 1.26 m, afterwards dropping steadily to very much the same low-water level at the end of June 1974.
The station was opened in October 1973, 7 km southeast of the Baga Kawa population centre. This gauge is therefore situated in the southern basin of the lake. According to on-the-spot information the water reached the station at the beginning of October. The level then rose regularly until 30 November at a speed very similar to that observed at Kalom. Throughout December a slackening of the water level at H = 0.96 m was noted. Flood recession, which started at the beginning of January 1974, was less regular and somewhat less rapid than at Kalom.
The level maximum is therefore more prolonged than at Kalom and did not appear until a month later, as at Bol, while the recession of open water in the south was already in progress (Fig. 5).
From the beginning of June 1974 the station was once again dry.
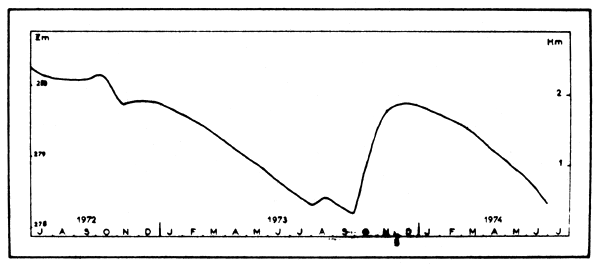
The Bol Dune station is the oldest at the lake, the zero of the gauge being 277.87 m according to the IGN 1956 levelling.
From July to December 1972 the curve (Fig. 6) slips in October (from 2.20 to 1.90 m) and then shows a plateau from November to December (1.90 m at Bol). The slip is explained by the reversal of the wind pattern at the beginning of October; the harmattan replaces the monsoon and drives back the water from the northeast to the southwest. From November to December 1972 the inflows scarcely offset losses due to evaporation and seepage. This equilibrium is represented by the plateau of the curve. From the end of December 1972 losses exceed inflows.
From the end of February 1973 (H = 1.60 m) these readings are no longer representative of the general level, the Bol region being, as already seen, isolated from the rest of the lake by the emergence of the vegetation island area. This isolation continued until the end of September 1973. During July, the level rose from H = 0.62 m to H = 0.44 m as a result of evaporation. During the first half of August, the rise in elevation up to H = 0.54 m is attributable to precipitation. Although rainfall was low at Bol in 1973, it should be noted that from June to the end of August 133.5 mm was recorded, of which 93.0 mm occured during the first fortnight of August. The results of the chemical analyses of the water at Bol performed every week are, furthermore, in agreement with this assumption. This brief rise is immediately followed by a drop in the level at a speed identical with that observed in July. In September, the open water in the south is under pressure with respect to the archipelago and when it crosses the shelf of the vegetation islands flooding occurs very suddenly. The start of this flooding appeared on 23 September at Bol. The level rose by 0.15 m in one day and the rapid rise continued until 1 November. Flooding of the Bol region therefore occured at much the same date as at Baga Kawa but was a good deal quicker. The peaks afterwards appeared on more or less the same date with a slack in the two cases.
In January and February 1974 the flood recession continued at levels and at a speed very similar to those of January and February 1973. Conditions were, however, different; in 1974, the Chari had a slightly smaller flow and emptied only into the southern basin which was now blocked by vegetation. In March 1974 the drop in level speeded up as in March 1973 after the separation between the archipelago and the open water of the south. From 1 January to 1 July the drop was greater (1.40 m) in 1974 than during the same period in the previous year (1.16 m).
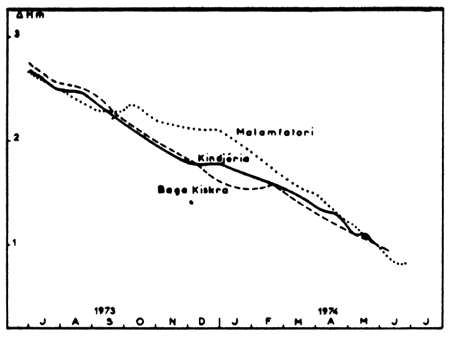
The station on Kindjéria Island, which was put into service in July 1973, is representative of the northern basin as a whole. Until the beginning of December, the basin remaine isolated from the rest of the lake with no supply other than the small inflows from the Komadougou-Yobé and from precipitation. In 1973, the Komadougou-Yobé started to flow only in August, so that the plateau recorded during the first part of this month at the time when the rise in level (Fig. 7) was noted at Bol is attributable to rainfall. Subsequently the level in the basin decreased steadily at a speed similar to that measured at Bol up to 1 December, the date on which infiltration from the south through the Great Barrier was sufficient to interrupt the drop for a month (plateau at H = 3.80 m). At the beginning of January 1974, the drop in the level of the northern basin recommences. It is comparable to that recorded in the eastern archipelago during the same period, with a speeding-up from the beginning of March onwards. On 1 July 1974, the level variation recorded for the past year is 1.9 m. In the light of the average slope of the curve representative of the level it can be estimated that precipitation in August 1973 and inflows from the southern basin in December amount to 9.3 metres. It emerges that evaporation in the northern basin over the period of a year was 2.2 m, a figure which confirms previous estimates of evaporation from the lake (Bouchardeau, Lefèvre, 1957; Riou, 1964).
The station was opened in May 1973 and up to December 1973 (Fig. 7) a drop in level almost identical to that at Kindjéria is observed, with likewise a slight plateau in August corresponding to the rainfall for that month. On the other hand, the plateau recorded in December at Kindjéria seems to be reflected here in a clear slowing down of the drop in January and even in a slight rise in February. Subsequently the drop resumes steadily up to July.
Observations resumed in July 1973 on the new ORSTOM gauge which supplements the data obtained by the Nigerian station of the Federal Fisheries Service at Malamfatori. The fact that the curve is less regular than at Kindjéria (Fig. 7) may be attributed to the shape of the coast, seasonal wind variations and inflows from the Komadougou-Yobé.
The coast facing the open water is flat, straight and perpendicular to the general direction of the winds whose influence is thus appreciably more pronounced. In addition, the station is situated quite near the mouth of the Komadougou-Yobé whose flood started in August and continued until November, which may explain the plateau in the curve in September and the brief rise at the beginning of October. Futhermore, the dry-season winds blowing from the northeast set in October and cause a difference in level between the eastern and western coasts of the basin, resulting on the curve in a smaller deviation at Malamfatori that at Kindjéria between October 1973 and the beginning of January 1974. The frequency of the subsequent gauge readings did not allow a curve to be drawn with sufficient accuracy for it to be compared with that for Kindjéria.
Further northward, the Nguigmi gauge, which was representative of the lake until 1968, has been intermittently isolated since that date. The levels recorded in 1973 and 1974 therefore probably represent the variations of a closed basin and are no longer of interest for a study of the northern basin.
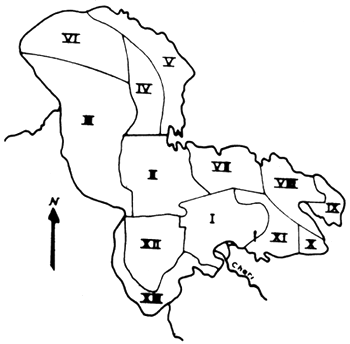
We have already seen that, owing to its shallowness and the shape of its banks, the lake possesses a surface which is extremely sensitive to level variations. The first data, which are collected in the “Monographie hydrologique du lac Tchad” (Touchebeuf de Lussigny, 1969) have enabled a correlation to be worked out between the area S (km2) of water and the absolute elevation Z (m) of the water surface, valid for Z lying between 280 and 283:S = 4 300 (Z -278). More recently, M.A. Roche (1971, 1973) has performed a new estimate for Z = 281.8, the average level of the lake from 1967 to 1969, using the 1/200 000 scale IGN maps (France), the 1/50 000 scale topographical material of the Federal Survey Department (Nigeria) and his own personal observations. To do this, he divided the lake into 13 zones (Fig. 8), the water areas of which are given in Table 2. The total surface of these 13 zones (22 700 km2) constitutes our reference area.
As a result of aerial photographic coverage of the lake in June–July 1973 by the Lake Chad Basin Commission, we were able to estimate the new areas in July 1973. In order to be able to make comparisons with previous results, the lake was divided into the same 13 zones, in which the water areas and the islands were surveyed. The results are given in Table 2. The water areas were only 8 940 km2, i.e., 40 percent of the reference area, as against an area of 18 140 km2 in 1967–69, i.e., 80 percent of the total reference area. This reduction is due mainly to the emergence of the Great Barrier (Zone II) of the southern tip (Zones XII and XIII) and of the eastern archipelago (Zones VIII, IX, X and XI). The southern basin was therefore almost totally exposed except for the peridelta region (open water in the south), which covered an area of only 1 650 km2.
After the flooding, we attempted in December 1973 a rough estimate of the swamp area. During aerial observations we endeavoured to estimate as accurately as possible the water areas under vegetation. At this degree of accuracy, open water covered the same area as in July and the swamp areas were estimated at about 5 000 km2, that is, 22 percent of the reference area. The swamps concerned mainly occupied Zones II, VII, VIII, XI and XII. The total water area was therefore about 60 percent of the reference area, i.e., three quarters of what it was in 1967–69.
In this note and with the use of numerical data, we have described the changes in Lake Chad throughout a phase of exceptional subsidence probably comparable to that observed by Tilho in 1904 and 1905. At the beginning of the years 1904 and 1973, the Great Barrier was still open and the northern basin navigable. In 1905 and 1974, the Great Barrier was closed with a steady drying-up of the northern part. This drying-up became total in 1906, following which abundant shrubby vegetation developed, subsequently hampering the return of the water in 1908 (Fig. 9).
At time of writing, the Chari flood of 1974–75 is well under way and it is to be assumed that it will be more or less average and around that of 1971–72 (Q = 3 410 m3/sec - V = 31.2. 109 m3). The water will therefore cross the Great Barrier in the northward direction and the level in the southern basin will be under great pressure with respect to the northern basin. The rise in each of the basins will depend on the way in which the water crosses the vegetation and the shelves of the Great Barrier. Even with this uncertainty, it is still possible to predict a maximum limit of water rise at Bol not exceeding H = 2 m on the scale.
In this borderline case, the rise in level in the northern basin will be small, about 0.3 to 0.5 metres. If, for various reasons, passage through the Great Barrier is relatively easy, the gain in level will be greater in the northern basin and therefore smaller in the southern basin. The lake will therefore not return, at the beginning of 1975, to a “Normal Chad” state, which can only be reached after several average floods.
Table 2
Estimate of the water areas of Lake Chad in 1967–69 (from Roche, 1971) and in 1973
| Zone | Total area km2 | Water area 1967–69 km2 | % water 1967–69 | Water area July 1973 km2 | % water July 1973 | Swamp area December 1973 km2 | %swamp December 1 |
| I | 1 890 | 1 890 | 100 | 1 430 | 76 | 450 | 24 |
| II | 2 600 | 2 055 | 79 | 150 | 6 | 1 020 | 39 |
| III | 4 180 | 4 160 | 100 | 3 460 | 83 | 210 | 5 |
| IV | 1 240 | 970 | 78 | 830 | 67 | 0 | 0 |
| V | 2 200 | 1 140 | 52 | 1 040 | 47 | 0 | 0 |
| VI | 2 320 | 2 000 | 86 | 1 600 | 69 | 0 | 0 |
| VII | 1 610 | 1 020 | 64 | 230 | 14 | 450 | 28 |
| VIII | 1 360 | 766 | 56 | 70 | 5 | 270 | 20 |
| IX | 560 | 240 | 42 | 0 | 0 | 0 | 0 |
| X | 1 190 | 760 | 64 | 130 | 11 | 530 | 45 |
| XI | 334 | 120 | 36 | 0 | 0 | 0 | 0 |
| XII | 1 880 | 1 880 | 100 | 0 | 0 | 1 880 | 100 |
| XIII | 1 340 | 1 140 | 85 | 0 | 0 | 230 | 17 |
| Total | 22 700 | 18 140 | 80 | 8 940 | 40 | 5 040 | 22 |
Billon, B., 1965 La prévision des crues du lac Tchad. ORSTOM, N'Djamena, 41 p.
Billon, B. and G. Oberlin, 1969 Monographie hydrologique du Chari; 4e partie. Interprétation des donnés. ORSTOM, Paris, 180 p.
Billon, B. et al., 1974 Le bassin du fleuve Chari. ORSTOM, Paris, Monographie hydrologique, 450 p.
Bouchardeau, A. and R. Lefèvre, 1957 Monographie hydrologique du lac Tchad. ORSTOM, Paris, 112 p.
Carmouze, J.P., A. Chouret and J.R. Durand, 1973 Données récentes sur l'évolution du lac Tchad en 1972–1973. ORSTOM, N'Djamena, 11 p. multigr.
Carmouze, J.P., A. Chouret and J. Franc, 1973 Etiage du lac Tchad en 1973: Assèchement de la cuvette sud. ORSTOM, N'Djamena, 8 p. multigr.
Chouret, A. and J.R. Durant, 1972 Note sur la crue exceptionnellement faible du Chari à Fort Lamy en 1972 et ses incidences sur le niveau du lac Tchad. ORSTOM, N'Djamena 7 p. multrig.
Chouret, A., J. Franc and J. Lemoalle, 1974 Evolution hydrologique du lac Tchad de juillet à décembre 1973. ORSTOM, N'Djamena, 9 p. multigr.
Riou, C., 1964 Résultats récents des mesures d'évaporation au Tchad. ORSTOM, N'Djamena, multigr.
Roche, M.A., 1971 Géographie et éléments numériques sur la superficie et la bathymétrie du lac Tchad. ORSTOM, N'Djamena, 7 p. multigr.
Roche, M.A., 1973 Traçage naturel salin et isotopique des eaux du système hydrologique du lac Tchad. Thèse de Doctorat d'Etat, Université de Paris
Tilho, J., 1910 Documents scientifiques de la mission Tilho 1906–09. Imprimerie Nationale Paris, t. I, 412 p., t. II, 598 p.
Tilho, J., 1928 Variations et disparition possible du Tchad. Annales de Géographie. 37, 238–60
Touchebeuf de Lussigny, P., 1969 Monographie hydrologique du lac Tchad. ORSTOM, Paris, 169 p.
Touchebeuf de Lussigny, P., 1969a Complément à la monographie hydrologique du lac Tchad: note hydrologique sur l'El Béïd et la Komodougou-Yobé. ORSTOM, Paris, 57 p. + annexes
 |  |
| Figure 1 | Figure 4 |
 |  |
| Figure 3 | |
| Figure 2 |
Figure 1 Régions naturelles du lac Tchad à la cote du plan d'eau 281,5 m Natural regions of Lake Chad at altitude of the water surface 281.5 m
Figure 2 Hydrogrammes caractéristiques du Chari à N'Djamena Typical flow rate hydrographs of the Chari River at N'Djamena
Figure 3 Variations interannuelles du niveau du lac Tchad de 1900 à 1972. En tireté, niveaux reconstitués, en trait plein, niveaux observés Interannual variation of Lake Chad level from 1900 to 1972. (dotted line, reconstructed levels; black line, observed levels)
Figure 4 Carte schématique du lac Tchad en juillet 1973. Le tireté indique les limites du lac à la cote 281, 8 m (Tchad normal) Map of Lake Chad in July 1973. (dotted line shows the limits of the water surface of the Lake at altitude 281.8 m (normal Lake Chad)
 |  |
| Figure 5 | Figure 7 |
 | |
| Figure 6 | |
 |  |
| Figure 8 | Figure 9 |
Figure 5 Variations de niveau dans la cuvette sud à Kalom et Baga Kawa Level variations in the southern basin at Kalom and Baga Kawa
Figure 6 Variations du niveau à Bol Level variations at Bol
Figure 7 Variations de niveau dans la cuvette nord à Malamfatori, Kindjéria et Baga Kiskra Level variations in the northern basin at Malamfatori, Kindjeria and Baga Kiskra
Figure 8 Découpage du lac en treize zones pour l'évaluation des surfaces (d'après M.A. Roche, 1971) Division of the Lake in thirteen zones for evaluation of water areas (from A. Roche, 1971)
Figure 9 Le lac Tchad au début de 1908, d'après les documents de la mission Tilho (1910) Lake Chad beginning of 1908, from Tilho's mission documents (1910)
by
Abdoul Oumar Fall
Ingénieur Principal des Travaux des Eaux et Forêts
Direction des Eaux et Forêts
Ministère du Développement Rural et de l'Hydraulique
Dakar, République du Sénégal
The last five years are featured by a decrease of the production and the multiplying of fishing gear.
Fish production of the Senegal Valley has decreased and although accurate recordings are impossible the Service des Eaux et Forêts estimates show a drop from 30 000 tons in 1967 to 12 000 tons in 1973 of the total production, as can be seen from the Table below:
| Year of fishing campaign | Catches from Lake Guiers | Value at fishing grounds (millions CFA) | Estimates of total production (river and Lake Guiers) | Marketing value (millions CFA) |
| 1967 | 1 500 t 1 | 8.5 | 30 000 t | 750 |
| 1968 | 1 212 t 1 | 12. | 25 000 t | 650 |
| 1969 | 532 t 1 | 7. | 20 000 t | 500 |
| 1970 | no fishing campaign (stop depletion of stocks) | - | 18 000 t | 540 |
| 1971 | " | - | 18 000 t | 540 |
| 1972 | " | - | 15 000 t | 450 |
| 1973 | " | - | 12 000 t | 420 |
Overexploitation of fish resources is due to:
lack of an integrated approach for the exploitation
stocks depleting fishin methods
intensification of floodplain fishing, and
utilization of small mesh net (less than 15 m/m)
![]()
![]()
![]()