![]()
![]()
Asia and the Pacific region continue to be the world's largest producer of fish. In 2006, this amounted to 94.2 million tonnes65 — 47.9 million tonnes from capture fisheries and 46.3 million tonnes from aquaculture (excluding aquatic plants). This represents 52 percent and 90 percent of the global production, respectively. When aquatic plants are included in the total aquaculture figures, aquaculture production outstrips that of capture fisheries for the first time (total aquaculture production of 61 million tonnes and 92 percent of the world's production). Capture fisheries increased by 3.5 percent over that of 2004 (driven mainly by growth in Southeast Asia) and 13 percent for total aquaculture (driven mainly by growth in China and Southeast Asia). Of the top ten producers of capture fish, six states were from Asia and the Pacific region (China (1st), Indonesia (4th), Japan (5th), India (7th), Thailand (9th) and the Philippines (10th)). For aquaculture, China is reported to have produced 70 percent of the world's aquaculture production (about six times greater than the fisheries production of Peru, the number two fisheries producer in the world).
|
Box 8 China's revised statistics Based on the 2006 agricultural census, China has adjusted its fisheries and aquaculture production figures. For marine and inland capture fisheries the estimated production is decreased by 13.3 and 13.6 percent respectively. Similarly for aquaculture, the decrease is 12.6 and 13.7 for marine and freshwater respectively. As these figures were adjusted after reporting to FAO, the data analyzed in this report is the higher reported figures. Additionally, China will work on reviewing historical data back to 1996 when the previous agricultural census was performed. Hence, as China is such a major part of regional and global trends it is expected that major changes will occur. One conclusion is that using revised data a decline in global and regional marine capture production will be seen. |
The capture fisheries of Asia and the Pacific region are dominated by pelagic species - in many subregions it is small pelagics that are the dominant group. The proportion of low-value/trash fish is increasing in many areas, a trend that is meeting the growing demand for these fish for use as feeds for livestock and aquaculture. Freshwater fish dominate aquaculture production.
As expected, there is considerable variation in general trends among the five main subregions of Asia and the Pacific region. Production from China, South Asia and Southeast Asia continues to grow. Capture fisheries production from Japan and Democratic People's Republic of Korea have shown a steady decline over many years, partly because of declining stocks,66 whereas aquaculture pro-duction has remained relatively stable. Oceania's production is minor compared with the other subregions, and has seen a steady increase until last year when there was a sudden decrease. Many of the fisheries in the Pacific small island developing states, which operate at subsistence level, are not recorded.
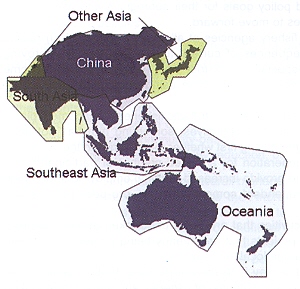
Map B Asia and the Pacific region and an imprecise outline of the subregions analyzed in this report
Production from Asia and the Pacific region's capture fisheries has increased by 1.6 million tonnes since 2004 and totalled 47.6 million tonnes in 2006. This represents an overall increase of 3.5 percent over 2004. Inland capture fisheries production increased by 19 percent whereas that of marine capture fisheries increased by only 1.3 percent. The respective figures in the previous biennium were 5 and 2.5 percent, hence, although marine capture production is still increasing, it is at a lower rate.
|
Box 9 Top capture producers 2006 Top ten producers of capture fish in 2004 were China, Peru, USA, Indonesia, Japan, Chile, India, Russian Federation, Thailand, and Philippines. Six of these are in Asia and the Pacific region. The top ten producers amount to 60 percent of the total global production. |
The region has been the world's largest producer of fish for decades, and has further increased to 52 percent of global capture production in 2006, from 49 percent in 2004. Of the top ten producers of capture fish in the world, six states are in Asia and the Pacific region. Total capture fisheries production in the region has steadily increased since 1950, mainly from the marine capture fisheries sector (Figure 15), whereas global capture fisheries catches levelled off already in the mid 90s (including regional catches). In inland waters, the regional share increased to 65.9 percent (62.4 in 2004). China is still by far the largest producer in the region with a reported production of 17.1 million tonnes in 2006, representing 40 percent of regional production. This is more than 3.6 times greater than the second largest producer in the region, Indonesia, and four times higher then the third largest producer, Japan.
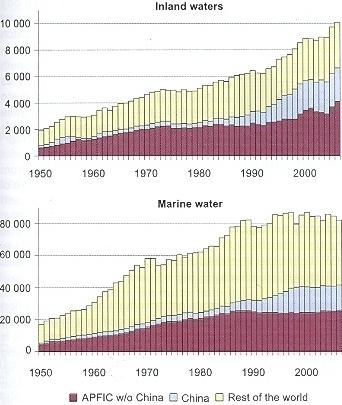
Figure 15 Trends in global capture production (1 000 tonnes)
Because of this enormous scale of pro-duction, China67 is treated as a distinct subregion in this review.
Marine Waters
Excluding China, total capture fishery production from marine waters has recorded its highest catch ever, with 25.6 million tonnes in 2006. The previous peak in total catch was 25.4 million tonnes in 1989, which then gradually declined. However, there has since been a gradual increase in recent years.
Southeast Asia has continued to increase its production and has main-tained the largest share (excluding China) of the APFIC region since 1994 (Figure 16a). Growth in South Asia has occurred but is relatively slow. The subregion Other Asia used to be the top contributor to the region, but has experienced a serious and continuous decline in production since 1988 that now show signs of levelling of. This can partly be explained by the fact that the Japanese and Democratic People's Republic of Korea fisheries are not decreasing at the same rate as in previous years and that the Republic of Korea catch is increasing.
The increase in marine capture fisheries since 2004 has occurred mainly in Southeast Asia, in particular Myanmar (+21 percent) and Cambodia (+ 8 percent), but also in Viet Nam (+5 percent). Major decreases have been reported by Sri Lanka (-30 percent), Australia (-17 percent), New Zealand (-14 percent) and Pakistan (-9 percent). The decrease in the Sri Lankan catch was even more pronounced in 2005 with an unrivalled 51 percent decrease, followed by a 43 percent increase in 2006. The decreases in Australian and New Zealand catch are mainly a result of the decreased catch of demersal marine fish that make up a large fraction of total production.
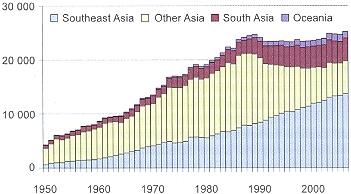
Figure 16a Trends in marine capture production by subregion outside China (1 000 tonnes)
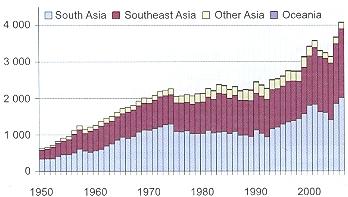
Figure 16b Trends in inland capture production by subregion outside China (1 000 tonnes)
Inland waters
Excluding China, total inland production of the region reported in 2006 was 4.8 million tonnes (3.1 million tonnes in 2004). The increase over that of 2004 has come mainly from Cambodia (69 percent), India (63 percent), Pakistan (49 percent), Myanmar (39 percent) and Bangladesh (31 percent). China reported an increase of 124 000 tonnes, which corresponds to an increase of 5 percent, compared to 2004. South Asia and Southeast Asia contributed the greatest amount of production compared with other subregions (Figure 16b) and combined was almost as high as the inland capture catch of China (79 and 74 percent, res-pectively). The increases in the South Asia states were mainly reported as freshwater fishes "not elsewhere included" (nei) and additionally India reported a major increase of cyprinids nei.
Large decreases were reported from inland capture production in Republic of Korea (37 percent), Japan (25 percent) and Indonesia (9 percent) since 2004. The Republic of Korea decrease is because of immense decrease in freshwater mollusc production compared to 2004 and for Japan the trend is mainly because of the decreased catch of salmon and molluscs.
The overall increase in inland fisheries is probably a result of more enhancement and growing effort that increases the yield. However, part of the increase is probably because of a significant re-evaluation of the contribution of inland fisheries that greatly revised the previous underestimates upwards. This is also a cause for concern when analyzing the inland fisheries status and trends: if the reported increasing production mainly relies on improved reporting, then the real production may de facto be decreasing. This is in line with feedback from fishers reporting general decreasing catches. However, it should also be noted that there is an increasing number of fishers in the sector. There is still considerable uncertainty about inland production figures — the production from Southeast Asia has been estimated to be underreported possibly by a factor of between 2.5 and 3.6 and recent figures from MRC estimate the underreporting to be as high as four times on occasion.68 Additionally, inland capture fisheries production in Thailand has been estimated to 1.0 million tonnes, compared to the reported 0.2 million tonnes.69 Hence, in future years, increases in inland capture fisheries are expected, but these increases will mainly be attributed to adjusted data collection strategies and inclusion of rural and subsistence fisheries in official statistics. However, the large regional share of global catches could possibly reflect better reporting or estimates of inland catch compared to other regions, such as Africa and Latin America.
The region's catch is dominated by pelagic marine species and in many subregions small pelagic species (e.g. Japanese jack mackerel, Japanese anchovy, chub mackerel, Pacific saury, Indian oil sardine, Indian mackerels and scads). The increasing catches of small pelagic species is a recent trend that can be explained by two factors: a) a more targeted fishing for these species (because of increased value); and, more seriously, b) as an effect of fishing down the food chain, i.e. when the large pelagic are less abundant the fishers target the small pelagics.
The catch of pelagic marine fish peaked at 11.7 million tonnes in 1988 and subsequently decreased to the production levels seen in the early 1980s (Figure 17). The catches have since started increasing and reached 10.3 million tonnes in 2006. Other species groups such as molluscs, crustaceans and cephalopods have levelled off whereas production of freshwater and diadromous fish continues to grown steadily.
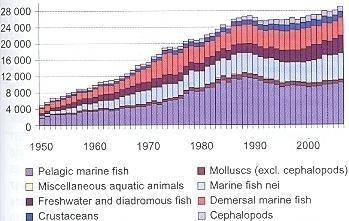
Figure 17 Trends in capture production by species group outside China
Demersal marine fish production in Asia and the Pacific region peaked at 5.2 million tonnes as early as 1974 and declined to around 4.4 million tonnes where it has been relatively stable since 1991. These figures highlight the overfishing of demersal stocks in the region and their disappearance from the catch. The top 20 species in the region (Table 9) show considerable changes in rankings over time. It is significant that the reduction in catch of a single dominant species such as Alaska pollock in the early 1970s and chub mackerel in the late 1970s resulted in changes in the relative ranking of large pelagic marine species (i.e. skipjack tuna and yellowfin tuna) that has carried through to 2006 as these fisheries have increasingly expanded. When the Chinese figures are included, the large catches of largehead hairtail, akiami paste shrimp (Acetes spp) and marine molluscs have an increased importance in the overall rankings. It is important to note that Alaska pollock is a cold water species, whereas tunas are tropical species, indicating the shift of effort of fishing fleets from cold water fisheries to tropical waters fisheries in the region.
The proportion of low-value/trash fish in the catch is increasing throughout much of the region.70 Unfortunately there are very few records of the amount of low-value/trash fish currently being taken in the APFIC region. This is partly because the term "trash fish" is still used to mean different things in different states making reporting difficult. It is also important to point out that in some countries (e.g. Cambodia) the term is not even used, as all the catch, independent of size and quality, is processed.
The percentage of low-value/trash fish recorded for some countries in the region ranged from 4 percent to 38 percent of the total marine capture landings.71, 72 In some cases the percentage was in excess of 50 percent, especially in areas where low-value/trash fish are being targeted. The weighted average percentage across the region was 25 percent.
For 2006, the recorded Asian capture fishery landings amounted to about 38.3 million tonnes (for all carnivorous and omnivorous fish and excluding molluscs, crustaceans and seaweeds) and the latest estimate for discarding is 1.8 percent, giving a total capture figure of 39 million tonnes. Applying a 25 percent low-value/trash fish factor to the landed catch gives a figure of 9.6 million tonnes being used for livestock/fish, and 28.8 million tonnes being used directly for human consumption.
Table 9 Top twenty capture production species in Asia and the Pacific region
APFIC w/o China |
APFIC | |||||
1960 |
1990 |
2006 |
(1 000 |
2006 |
(1 000 | |
1 |
Japanese jack mackerel |
Jap. pilchard |
Skipjack tuna |
1 708 |
Skipjack tuna |
1 756 |
2 |
Flatfishes nei |
Alaska pollock |
Chub mackerel |
810 |
Jap. anchovy |
1 657 |
3 |
Jap. flying squid |
Skipjack tuna |
Jap. anchovy |
682 |
Largehead hairtail |
1 561 |
4 |
Alaska pollock |
Nat. decapods |
Scads nei |
570 |
Chub mackerel |
1 285 |
5 |
Jap. anchovy |
Jap. anchovy |
Yellowfin tuna |
537 |
Scads nei |
1 197 |
6 |
Chub mackerel |
Scads nei |
Nat. decapods |
503 |
Marine molluscs nei |
987 |
7 |
Pacific saury |
Yellowfin tuna |
Croakers, drums |
457 |
Croakers, drums nei |
798 |
8 |
Indian oil sardine |
Chub mackerel |
Sardinellas nei |
425 |
Nat. decapods |
748 |
9 |
Nat. decapods |
Various squids nei |
Jap. flying squid |
387 |
Akiami paste shrimp |
729 |
10 |
Yellowfin tuna |
Croakers, drums |
Indian oil sardine |
338 |
Various squids nei |
602 |
11 |
Scads nei |
Pacific saury |
Pacific saury |
318 |
Threadfin breams |
577 |
12 |
Indian mackerel |
Indian oil sardine |
Cephalopods nei |
302 |
Yellowfin tuna |
551 |
13 |
Sharks, rays etc. |
Jap. flying squid |
Cyprinids nei |
298 |
Seerfishes nei |
436 |
14 |
Clams, etc. nei |
Cyprinids nei |
Alaska pollock |
293 |
Sardinellas nei |
425 |
15 |
Ok. atka mackerel |
Arg. shortfin squid |
Clupeoids nei |
288 |
Gazami crab |
417 |
16 |
Yellow croaker |
Sardinellas nei |
Hilsa shad |
280 |
Dag. pike conger |
414 |
17 |
Skipjack tuna |
Stol. anchovies |
Indian mackerel |
276 |
Freshwater molluscs |
410 |
18 |
Bombay-duck |
Clupeoids nei |
Arg. shortfin squid |
275 |
Silver pomfrets nei |
396 |
19 |
Jap. carpet shell |
Bigeye tuna |
Short mackerel |
275 |
South rough shrimp |
392 |
20 |
Clupeoids nei |
Jap. jack mackerel |
Kawakawa |
274 |
Jap. flying squid |
387 |
As aquaculture fish production is about the same, it is clear that the diversion of marine fish via aquaculture is still providing a very significant proportion of the total fish provided to human consumption (both within Asia and exported to other more developed countries). An increasing proportion of this production is high-value carnivorous species and hence the production is increasingly dependent on imported fish meal/oil.
There is still a considerable capture production that is not identified to the species level but instead recorded as marine/freshwater fishes nei,73 marine/freshwater molluscs nei and marine/freshwater crustaceans nei (Figure 18). The quantity reported under these categories has for some subregions been increasing significantly in recent years, which indicates a worrying trend in the quality of the available statistical information. It may also reflect the trend towards smaller lower-value species, which are considered not worth reporting in detail (this especially hides the effects of overfishing on the capture of juveniles).
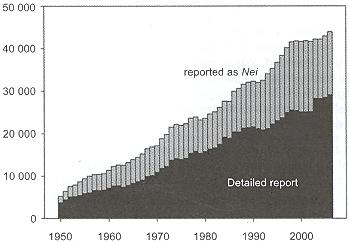
Figure 18 Capture production in Asia-Pacific region by detail of reporting
In 2006, 14.8 million tonnes or 34 percent of capture production was not identified to species, order, or family level. It is notable that China has improved its reporting on individual species. The reporting on nei species has been reduced by more than 3 million tonnes or from 52 percent on reported capture production in 2002 to 34 percent in 2006.
APFIC RECOMMENDATION
TARGETED SURVEYS TO ASSESS COMPOSITION OF "NEI" REPORTS TO GET BETTER ESTIMATES.
Temperate and tropical seas — fishing down the food chain
There is no doubt that the fisheries of Asian waters have been increasingly exploited since the late 1960s, but there remains a remarkable lack of comprehensive data as to whether these fishing activities in Asia and the Pacific region have affected the catch composition, with a tendency to find fewer larger fish in the catch and increased numbers of faster recruiting species. There seems to be empirical evidence of this and certainly the fishers themselves report this effect in many coastal fisheries, but to find this clearly documented is a challenge.
The practise of fishing for smaller and less-valuable species when the larger more-valuable species are fished out is sometimes referred to as "fishing down the food chain". Looking at the reported statistics for the region, there is no clear evidence of fishing down the food chain when the regional data are analyzed as a whole (Figure 10). This is almost certainly a result of the high level of aggregation of fishing areas (where continental shelf fisheries and pelagic fisheries are combined) as well as the often highly aggregated nature of reporting from some fisheries. The most extreme example is the reporting of significant amounts of the catch as nei. Despite these constraints, there are still indications when viewing groupings of species (according to ecology/feeding characteristics) that there has been a changeover in the catch from large pelagics, high-value demersals and high-value crustaceans to smaller-sized and less-valuable species (small pelagics and demersals), low-value crustaceans and increased catches of cephalopods (Table 9).
Table 10 World fishery fleet74
Year |
Number of boats |
% increase |
1970 |
595 100 |
– |
1975 |
702 500 |
18.0 |
1980 |
824 100 |
38.0 |
1985 |
984 400 |
65.0 |
1989 |
1 162 400 |
95.0 |
1990 |
1 202 300 |
102.0 |
1991 |
1 221 900 |
105.0 |
1992 |
1 225 700 |
106.0 |
1993 |
1 239 900 |
108.0 |
1994 |
1 238 200 |
108.0 |
1995 |
1 258 200 |
111.0 |
The history of fishing in the region must also be taken into account. Although it is certain that fishing capacity in the region and the world has increased over the past 50 years (more than doubled between 1970 and 1990, see Table 10), it is also clear that effort has shifted its focus too, as deeper water fisheries have been developed and the effort has shifted from temperate to tropical waters.
Splitting the reported data into the two distinct regions, temperate and tropical, allows a degree of analysis of the changes in composition of reported catch and some trends in the fisheries. Ideally, the reported areas would follow ecosystem type boundaries, allowing far more accurate analysis of the trends between and within ecosystems. The FAO reporting areas which cover temperate and tropical seas are still rather large, with FAO reporting areas 61 and 81 being temperate and the others being predominantly tropical (FAO areas 51, 57, 71 and 77). It is also important to include the reported catch of all countries fishing in the region (e.g. catch reportedly caught within the region by countries from outside the region is included in the analysis). To look at trends in broad groupings, the species were aggregated into some clear functional groups to illustrate better the effect of targeted fishing for larger or more valuable species.
The divisions used are as follows:
Temperate seas
The catch from the temperate seas in Asia and the Pacific region amounts to a total of 22.2 million tonnes, of which 11 percent is reported as marine fishes nei. The groups included in the analysis cover an additional 75 percent of the total catch (2006). From the trends there is a reasonably clear indication that there has been a "fishing down the food chain" effect in the temperate waters of Asia and the Pacific region (Figure 19). The trend of increasing total production of larger/high-value demersal species stopped in the mid 1980s and went into a decline sub-sequently (Figure 10).
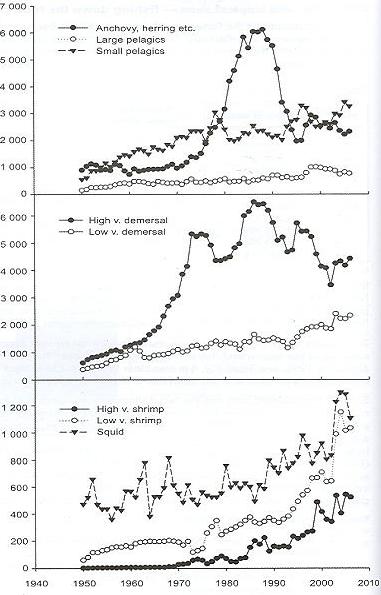
Figure 19 Catches (1 000 tonnes) divided into groups from all countries (world) in FAO areas 61 and 81 (temperate).
The anchovy-herring fisheries peaked in the late 1980s (6.1 million tonnes, mainly Japanese catch of Japanese pilchard) and then rapidly declined by over 60 percent to 1.9 million tonnes in 1995. They later recovered and were up to 2.9 million tonnes in 1998 (mainly because of the Chinese catch of Japanese anchovy), but have since declined again. The trend in "small pelagics" fisheries is the opposite of the anchovy-herring fishery, with a marked reduction when the anchovy-herring fisheries increased in the early 1980s and a rapid increase when the anchovy-herring fisheries declined in the early 1990s. As the small pelagic species to a large extent feed on the anchovies and herrings this trend is perhaps not surprising, but the connection has not been clearly reported.
The large pelagics show a steady increase up until 1996, when they suddenly increased by 60 percent in two years reaching 1.1 million tonnes in 1998. This increase can be explained by the increased production from China and Japan of seerfishes nei. The production has since fallen again to 0.8 million in 2006. The main changes in catches are decreased catches of seerfishes nei, but also decreased catches of skipjack tuna and albacore.
The high-value demersal species group has shown variations. The first rapid increase in the early 1970s was mainly because of increased catches by Japan and the Soviet Union of Alaska pollock. There was a sharp decrease in the late 1970s and then a rapid increase between 1981 and 1986, again largely caused by increasing catches of Alaska pollock by the Soviet Union. Catches subsequently decreased until 1994 when there was another rapid increase as a result of the increased catch from China and Russia of mainly Alaska pollock, and a greatly increased catch of largehead hairtail and croakers, drums nei. The demersal fisheries group has generally declined from its highest level in the mid 1980s to almost 40 percent to the current level of the reported catch in 2006 of 4.2 million tonnes.
The low-value demersal catch increased relatively slowly until 1993 when the production started to increase rapidly from 1.1 million tonnes to 2.4 million tonnes in 2004, hence more then doubling in ten years time. The main increases in catch have been in the catches of threadfin breams nei, daggertooth pike conger and Pacific sandlance.
The catches of high-value shrimps started to increase in the 1970s and there was an increase in the rate during the mid 1980s. Although fluctuating, the overall trend is still increasing and is mainly because of increased catches of southern rough shrimp and, to a lesser extent, fleshy prawn.
Low-value shrimp catches increased steadily until the early 1970s when the catch of akiami paste shrimp (Acetes) sharply dropped. It then recovered and increased from 13 000 tonnes in 1975 to 730 000 tonnes in 2006. The production of natantian decapods nei increased steadily until 1984 (150 000 tonnes) after which it started to decline until 2002 (50 000 tonnes). Then it increased rapidly and production is up to 460 000 tonnes in 2004 (increased catch almost exclusively from China). This trend is most likely a result of Chinese improvements in disaggregating their reported catch. The marine crustaceans nei catch drops from 1.2 million in 2002 to 0 in 2003 and has since remained at this level. Part of the recent increase in high-value shrimp can be explained also by this improvement in reporting.
The squid catch shows strong cyclical changes, but the main trend is a stable catch until the mid 1980s when the catch starts to increase more rapidly. The increase then levels off and stabilizes around 800 000 tonnes (2002) before increasing rapidly until 2004 (1.3 million tonnes). The increase in catch is reported as "various squids nei" and mainly by China. China only started reporting a squid catch in 1998; hence it is likely that this recent trend is the result of a targeted, recently developed squid fishery in China.
APFIC RECOMMENDATION
THE UNCERTAINTY CREATED BY THE 30 PERCENT OF CATCH REPORTED AS "MARINE FISH NEI", COULD TO SOME EXTENT BE RESOLVED BY TARGETED SAMPLE SURVEYS IN THOSE COUNTRIES REPORTING HIGH QUANTITIES OF MARINE FISH NEI. THIS WOULD AT LEAST GIVE AN INDICATION OF THE PERCENTAGE COMPOSITION AND VALUE OF THE SPECIES IN THIS CATEGORY.
Tropical seas
The total catch in the tropical areas of Asia and the Pacific region is currently 23.1 million tonnes and the trends of rise and decline seen in the temperate areas are less obvious in the tropical waters (Figure 20). In tropical waters, coastal stocks (typically the demersal and small pelagic species) may be more diverse and perhaps more resilient in the face of heavy fishing pressure (in terms of biomass) than in temperate waters. However, it is important to note that a relatively large proportion of the catch from tropical waters is reported as "marine fish nei" (almost 30 percent). Reporting in this category suggests poor reporting systems (which is a known feature of many of the tropical mixed fisheries), but also suggests that the catch is very small and mixed and does not lend itself easily to categorization into the larger higher-value species. It is therefore tempting to assume that the majority of this catch is actually small-sized low-value/trash fish and hence a strong indicator of an already fished down food chain.
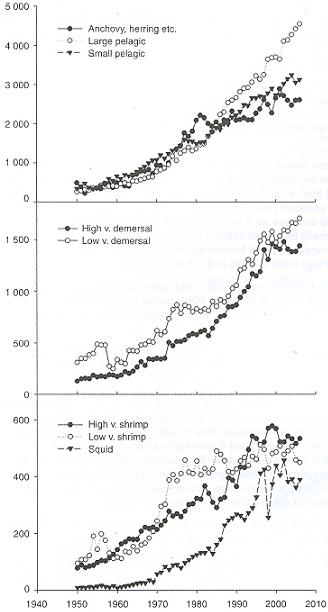
Figure 20 Catches (1 000 tonnes) divided into groups from all countries (world) in FAO areas 51, 57, 71 and 77 (tropical)
The anchovy and herring fisheries have followed a cyclic pattern with re-occurring small increases and decreases (oscillations) that can be expected by species heavily depen-dent on natural variations in the environment (e.g. cyclical trends observed according to the El Niño). These fisheries showed a rapid increase in production until 1981 (2.2 million tonnes). Then levelled off and increased slowly to 2.6 million tonnes (2006) with a maximum pro-duction in 2001 (2.9 million). Another observation is that the oscillations in catch have become greater over the years, indicating that fishing pressure might be too high.
The catch in 1981 was mainly made up of California anchovy, Indian oil sardine, California pilchard, Sardinellas nei and Stolephorus anchovies and caught by Mexico (711 000 tonnes), India (419 000 tonnes), Indonesia (273 000 tonnes), Philippines (241 000 tonnes) and Thailand (150 000 tonnes). In 2006 the catch consisted mainly of California pilchard, Sardinellas nei, Indian oil sardine, anchovies, etc. nei and Stolephorus anchovies. The main countries catching these fish are Mexico (546 000 tonnes), Indonesia (488 000 tonnes), India (453 000 tonnes), Philippines (386 000 tonnes) and Thailand (257 000 tonnes).
The catch of large pelagics has increased at an accelerating rate with some marked increases in production in 1998 and 2002. The main species caught in 2006 were skipjack tuna, yellowfin tuna, bigeye tuna, kawakawa and longtail tuna by Indonesia, Philippines, Japan, Taiwan POC and Republic of Korea. The increase in 1998 and 2002 was mainly a result of the increase in catch of skipjack tuna.
The small pelagics component has increased steadily until 2006 with a short period of stable production between 1977 and 1982. The main catch in 2006 was scads nei (566 000 tonnes), Indian mackerels nei (275 000 tonnes), short mackerel (274 000 tonnes) and Indian mackerel (261 000 tonnes), mainly from Indonesia (1 002 000 tonnes), Philippines (814 000 tonnes),) and Thailand (416 000 tonnes).
The high-value demersal species increased steadily until 1999 when production levelled off about 1.4 million tonnes. The main species caught in 2006 were croakers, drums nei (415 000 tonnes) and the catch came mainly from India (408 000 tonnes) and Indonesia (385 000 tonnes).
The low-value demersals catch increased until 1975 (867 000 tonnes) when it levelled off until 1987 when it started to increase again (1.6 million tonnes in 2006). There was a rapid increase between 1972 and 1975 mainly because of the increased production from India, whereas the increase between 1987 and 1997 also included increased production from Indonesia, Thailand and Pakistan.
High-value shrimp increased steadily until 1982 when it suddenly decreased rapidly until 1985. Almost the whole drop can be explained by decreased production from Thailand of Penaeus shrimps nei (this coincided with the significant expansion of cultured Penaeus monodon in Thailand). The production then continuously increased until 1999 when it showed a small drop and levelled off at 534 000 tonnes. The increase in production is mainly from the increased catch of giant tiger prawn (Penaeus monodon) which makes up 50 percent of the production in 2006, mainly from India and Indonesia.
Low-value shrimp increased rapidly between 1960 and 1977 (460 000 tonnes) and has since levelled off. In 1977, more than 50 percentage of the catch came from India. In 2006, India is still the biggest producer, but now accounts for only 30 percentage of the catch. The catch is made up of more than 90 percent of natantian decapods nei.
The production of squid increased rapidly until the late 1980s when it levelled of for a few years before it almost doubled between 1992 and 1997, mainly because of the increased production of jumbo flying squid and opalescent inshore squid from Mexico and the United States of America. The production then rapidly declined in one year (40 percent), because of the decreased catches from Mexico and the United States of America. The catches again rapidly increased and have levelled off about 389 000 tonnes (2006), with the main catch coming from Thailand (85 000 tonnes). Interestingly, Thailand's increasing squid catch is associated with the decline in availability of large and more valuable species in the Gulf of Thailand.
Sharks
The catches of sharks show remarkable differences between the tropical and temperate seas of Asia and the Pacific region (Figure 21). The catches in temperate waters show a steady decline, where Japan has historically been the biggest producer until 2004 when Taiwan Province of China doubled its produc- tion of sharks nei, rays nei, skates nei. The tropical catches have in contrast displayed a steady increase until 2003 with the main producers being Indonesia and India, thereafter they fell drastically (2003 to 2005) mainly because of the decreased catch by Taiwan Province of China (from 48 to 8 000 tonnes or -82 percent), Sri Lanka (-77 percent), Spain (-77 percent), Thailand (-36 percent) and Pakistan (-31 percent). Also, the large producers, Indonesia and India, reduced the catch of sharks by 15 and 4 percent respectively. Again the species are not reported at a disaggregated level and the reduced catch is reported as sharks, rays, skates, etc. nei and rays, stingrays, mantas nei.
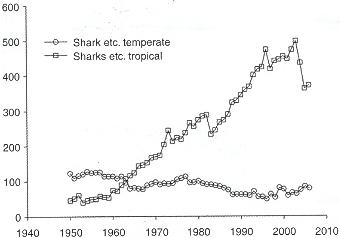
Figure 21 Sharks caught in either temperate (FAO areas 61 and 81) or tropical seas (FAO areas 51, 57, 71 and 77) in Asia and the Pacific region
APFIC RECOMMENDATION
THERE NEEDS TO BE AN EXPLAINATION OF THIS REDUCTION IN CATCH. IS IT CAUSED BY DECREASED EFFORT, LESS TARGETING OR IMPROVED CATCHING TECHNIQUES? OR IS IT BECAUSE OF REDUCED REPORTING OR INCREASED DISCARDING?
Tuna
A most valuable and the largest tonnage part of the pelagic catch is the catch of tuna species. It is clear that tuna catches in temperate waters have declined steadily since 1965 in Asia and the Pacific region (Figure 22). The main reason is declining catches of bluefin, bigeye and yellowfin tuna in temperate waters. Whether the decline was entirely the result of fishing pressure or also linked to management controls and a general decline in temperate water fishing fleets and a shift to tropical zones is not clear. In contrast, the tropical tuna fisheries have increased production over the same period (perhaps reflecting this shift in effort from temperate to tropical waters), and yellowfin catches are still good, although declining. The bulk of the catch in both regions is today made up of skipjack and to a smaller degree albacore tuna in the temperate waters.
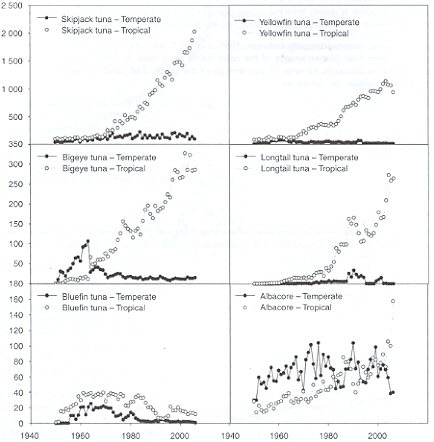
Figure 22 Tuna catches (1 000 tonnes) by species in temperate (FAO areas 61 and 81) and tropical seas (FAO areas 51, 57, 71 and 77) of Asia and the Pacific region
Globally, tuna catches are declining, but prices are rising75 (2007 data). The main reason behind this is the increase in fuel prices, which make long tuna catching fishing trips uneconomical. The main decreases in catch came in the Eastern Pacific and in the Indian Ocean (20 to 30 percent decrease compared to 2006). The catch for Asia-Pacific countries in the Indian Ocean for 2006 was 921 000 tonnes (tunas, bonitos, billfishes). The top three species caught were skipjack (made up 39 percent of the total), yellowfin (15 percent) and kawakawa (12 percent).
The regional tuna stocks are managed by the Indian Ocean Tuna commission (IOTC) and the Western and Central Pacific Fisheries Commission (WCPFC). These organizations regularly follow up on the status of the regional tuna stocks, and the latest assessments show that bigeye is overfished in the Pacific Ocean and fully fished in the Indian Ocean (Table 11). Additionally, yellowfin is on the verge of being overfished in both regions.
Table 11 Tuna stock assessment 2008 | ||
Species |
IOTC |
WCPFC |
Skipjack |
Not overfished (likely underfished) |
No overfishing |
Yellowfin |
Not overfished (likely fully fished) |
High risk of overfishing |
Bigeye |
Not overfished (likely fully fished) |
Overfishing occurring |
Albacore |
Not overfished (likely underfished) |
No overfishing |
To address the issue of overfishing and the sustainable management of the tuna stocks in the region the two principal regional fisheries management organizations, IOTC and WCPFC, have highlighted the following management measures that need to be implemented (Table 12).
Conclusion
There are many more countries fishing in the tropical region than in the temperate region (Table 13). Even so, the total catch in both regions is about the same — 23 million tonnes in the tropical region and 22 million tonnes in the temperate region.
Tropical coastal fisheries have mixed assemblages and the fishers exploiting them are able to utilize almost every species. This means that although biomass may continue to rise for the fishery these figures are certainly hiding some changes in species composition. The shift in composition towards faster recruiting small species is already clear from the quality of landings. The fisheries of the coastal regions in the Yellow Sea, the South China Sea, Timor and Arafura Sea and several other seas are also rather shallow and highly productive. This enables them to sustain significantly higher fishing pressure before stock collapses and there is a significant crash in the total catch.
The same cannot be said for tropical pelagic fisheries where ecosystem linkages to the lifespan of fish are probably far less resilient than in coastal waters. Here, overfishing can almost certainly be seen to impact stocks and the data available for several of the tuna species illustrates this. Skipjack tunas are considered to be rather resilient in the face of fishing pressure and is a faster recruiting species, nonetheless there are question marks raised about the status of this species in some fisheries.
Table 12 Tuna management measures that need to be implemented according to IOTC and WCPFC
| IOTC | WCPFC | |
Target |
IOTC considers the most important issue in management of tuna is to control fishing capacity.76 |
WCPFC is advocating the management goal of reducing fishing mortality on bigeye and yellowfin tuna with minimal impact on skipjack catches.77 |
Approach to achieve the target |
The members of IOTC are leaning towards effort control, which is easier to enforce than catch quotas. Another factor in favour of this measure is that it produces less incentive to underreport. |
|
Measures |
The IOTC is looking to freeze capacity for tropical tuna fisheries at 2006 levels, with the exception of:
|
The way to achieve this goal is to implement a variety of management measures. Most of these have already been agreed by WCPFC and include:
Additionally, WCPFC is considering proposing the measure of a 25 percent reduction in bigeye —targeting longline effort. |
Remarks |
IOTC sees it as important to combat IUU fishing and highlights the important role of port state controls. As most boats are unregistered boats or registered in nonmember states, the ways to improve the control of IUU fishing are:
|
There remains a considerable disparity between scientific advice and the WCPFC response. Overfishing of bigeye and yellowfin is likely to continue, and possibly worsen, unless further measures are implemented. Current measures proposed by PNA/FFA could be effective in reducing or even removing overfishing. However, evolution of the purse seine fishery (FADs) is critical — any long-term solution will need incentives for industry to minimize catches of small bigeye (and yellowfin). Potential role for the Vessel Days Scheme. |
Table 13 Number of countries reporting catch for the different groups in Asia and the Pacific region
Temperate (Areas 61 & 81) |
Tropical (Areas 51, 57, 71 & 77) | |||
Total 1950 to 200678 |
2006 |
Total 1950 to 200679 |
2006 | |
Pelagics | ||||
Large |
13 |
10 |
92 |
77 |
Small |
15 |
10 |
83 |
57 |
Anchovies, herrings etc. |
10 |
9 |
41 |
27 |
Demersals | ||||
High value |
13 |
10 |
59 |
46 |
Low value |
13 |
10 |
57 |
40 |
Sharks, mantas etc. |
9 |
9 |
68 |
49 |
Shrimp, prawns, krill etc. | ||||
High value |
5 |
5 |
27 |
22 |
Low value |
9 |
8 |
45 |
25 |
Squid |
15 |
10 |
31 |
19 |
South Asia
The South Asian subregion has shown continuous growth since 1980, with a small dip in production for 2004. The region has doubled its capture production from 3.1 million tonnes in 1980 to 6.2 million tonnes in 2006 and increased capture production by 14 percent since 2004 (Figure 23).
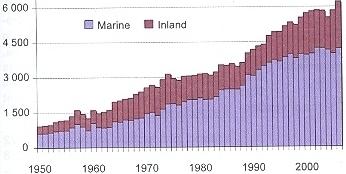
Figure 23 Trends in capture production of South Asia by environment
Most of the growth is a result of increased production in marine waters, but the last years have also seen a large relative increase in inland production (+43 percent since 2004). This increase can partially be accounted for by an increase in production of freshwater fishes nei in Bangladesh and India (60 percent of increase), but also by an increase in production of cyprinids nei from India (20 percent of increase). South Asia now has the largest share of inland capture production among subregions in Asia and the Pacific region (Figure 16) and is approaching the values of Chinese inland production (Figure 15). The bulk of this production (75 percent) is freshwater fish nei from Bangladesh, India and Pakistan (0.9, 0.4 and 0.3 million tonnes respectively).
APFIC RECOMMENDATION
THERE NEEDS TO BE A DISAGGREGATION OF THE CATCH OF FRESHWATER FISHES NEI, AS THIS MAKES UP THE BULK OF TOTAL INLAND CATCH.
After remaining relatively stable during the late 1970s and 1980s, inland production grew rapidly from the early 1990s. It reached the highest level of production at 1.8 million tonnes in 2001 and then decreased again. It has since started to increase and totalled 2.0 million tonnes in 2006.
In comparison with top production species of other subregions, the combination of South Asian species is unique in the sense that freshwater species (cyprinids nei: 3rd), diadromous species (hilsa shad: 2nd), demersal species (croakers/drums: 4th), crustaceans (natantian decapods: 8th) and pelagic species (Indian oil sardine: 1st) are all ranked high in the list (Table 14). This reflects the relative lack of offshore fisheries exploitation.
Table 14 South Asian capture fisheries production, top ten species (2006). Excluding all other species reported at species level
Species |
(1 000 tonnes) |
Indian oil sardine |
320 |
Hilsa shad |
277 |
Cyprinids nei |
275 |
Croakers, drums nei |
254 |
Giant tiger prawn |
207 |
Bombay-duck |
188 |
Skipjack tuna |
184 |
Natantian decapods nei |
170 |
Clupeoids nei |
134 |
Hairtails, scabbard fishes nei |
128 |
Freshwater fishes nei |
1 421 |
Marine fishes nei |
972 |
Among marine species, both pelagic fishes and demersal fishes showed almost parallel increasing trends with similar levels of production in 2006 (1 304 000 tonnes and 1 146 000 tonnes, respectively).
Freshwater fish and diadromous fish have been the number one production group for the last four decades (except in 1992) and achieved very rapid growth in the 1990s and in the last few years (+37 percent since 2004). The marine fish production has been relatively stable since the 1990s with an increase of 1.5 percent since 2004. Crustacean production has been relatively stable and production levels of molluscs including cephalopods in this area are declining (Figure 24).
Southeast Asia
Production growth in Southeast Asia has also been very strong in the past four decades with marine capture production increasing almost linearly throughout this period. The total capture production in 2006 was 15.4 million tonnes, of which marine capture was 88 percent. Since 2004 the increase in marine pro-duction can be attributed to increases in production from Myanmar, Indonesia, Viet Nam and the Philippines, whereas Thailand and Malaysia saw a small drop in production (2 and 3 percent respectively).
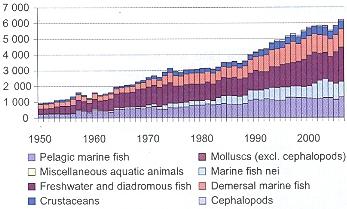
Figure 24 Capture production of South Asia by major species groups
Inland production increased by 22 percent since 2004 and reached 1.8 million tonnes in 2006. Even so, consi-dering the rich freshwater resources in the area, it is likely that a figure of only 12 percent of total production80 coming from inland waters is also a gross underestimate (Figure 25).
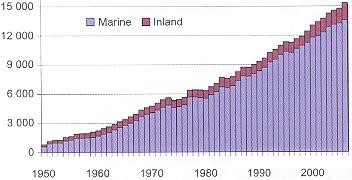
Figure 25 Trends in capture production of Southeast Asia by environment
APFIC RECOMMENDATION
THERE NEEDS TO BE A DISAGGREGATION OF THE CATCH OF MARINE FISHES NEI, AS THIS MAKES UP A LARGE PART OF THE TOTAL CATCH.
The main species groups are pelagic marine fish and marine fish nei. Marine fish nei, in particular, keep growing strongly (+9 percent) and is a major driving force of the overall production growth together with the recent increases (+24 percent since 2004) in freshwater and diadromous fishes (Figure 26).
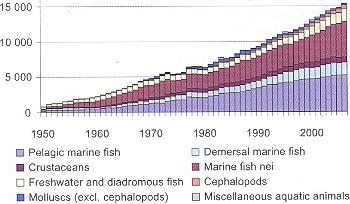
Figure 26 Capture production of Southeast Asia by major species groups
Demersal fish, crustaceans and pelagic marine fish have maintained nearly the same share of production as in 2004. The proportion of unidentified marine fish (marine fish nei) is still notably high (33 percent of total production) in this subregion and has increased since 2004. It is even more pronounced in inland capture fisheries with 75 percent being unidentified. This indicates a declining size of the individual fish in the catch and a move towards very small species or nei species, which in most cases can be assumed to be increasing quantities of trash/low-value fish. As this catch usually is marketed as mixed catch, the statistics reported are not broken down to species level and thus usually reported as nei. If this is in fact the case, this is a clear indication that the Southeast Asian capture fisheries have come a long way in fishing down the food chain and this should require the immediate attention of the relevant authorities. Another reason may just be weak reporting by countries, but it is nevertheless an important issue to investigate and clarify.
Table 15 Southeast Asian capture fisheries production, top ten species (2006)
Species |
(1 000 tonnes) |
| Scads nei | 559 |
| Skipjack tuna | 437 |
| Sardinellas nei | 425 |
| Natantian decapods nei | 276 |
| Indian mackerels nei | 276 |
| Short mackerel | 275 |
| Threadfin breams nei | 248 |
| Stolephorus anchovies | 240 |
| Kawakawa | 223 |
| Frigate and bullet tunas | 206 |
| Marine fishes nei | 5 072 |
| Freshwater fishes nei | 1 366 |
Eight of the top ten production species are marine pelagic fishes and small pelagic fishes (scads and sardinellas) are found among the top three ranks (Table 15). Large pelagic fishes (skipjack tuna, frigate and bullet tunas) also feature high in the rankings. One factor confounding the figures is that a substantive share of the catch may come from outside the region and hence distort the real picture of the fishery.
China
The Chinese statistics show four periods with distinct trends (Figure 27). The first period, 1950 to 1985, has relatively low rates of growth, and all species groups exhibit very similar patterns, albeit with some annual fluctuations.
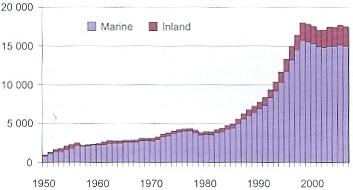
Figure 27 Trends in capture production of China by environment
In the second period, 1986 to 1998, China reported very rapid and substantial growth in production in almost all types of capture fisheries (especially marine). Between 1993 and 1997, annual increments of total production always exceeded one million tonnes (the highest annual increment was 1.7 million tonnes in 1995). Subsequent to this amazing period, the third period started with the introduction of the zero growth policy in 1998; total production started to decline for the first time in almost twenty years with the degree of decline greater in marine production than in inland production. This continued until 2001 when a fourth period with small annual increase started. In 2006, total production was 17.5 million tonnes, almost back to the 18.0 million tonnes reported in 1998. However, as China has since revised the figures for 2006 (see Box 8) and is expected to revise data back to 1996, these trends are likely to be adjusted in the coming years.
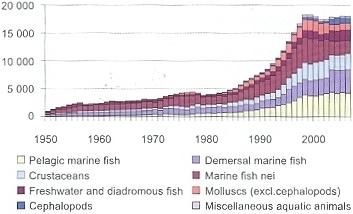
Figure 28 Capture production of China by major species groups
The effect on trends in species composition is however believed to be minimal as in Chinese statistics species breakdown is calculated from fractions of total catch. Most species groups showed similar rapid growth trends during the second period. However, trends in the third and fourth periods varied widely. The proportion of marine fish nei group declined sharply, whereas the crustacean group continued to grow. During this period, molluscs maintained the same production level (Figure 28). However, the most striking trend is the apparent rapid increase of demersal marine fish production since 2002, part of which can be explained by improved reporting at species level (there is a similar decrease in marine fishes nei).
For inland capture production, there was a rapid increase up until 1999 and then a decline until 2003 when it increased again (Figure 29). Up until 2003 the catch was disaggregated into three categories but is now disaggregated into eight categories. However, most of the catch is still reported as freshwater fishes nei and freshwater molluscs nei. China is, however, addressing this issue and improved species reporting for inland capture fisheries is expected within a few years.
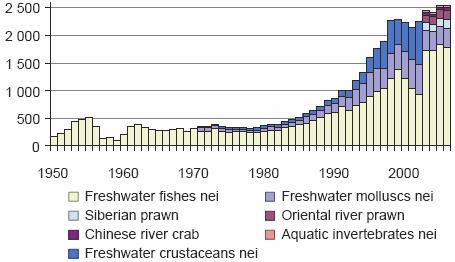
Figure 29 Inland water capture production of China by species
Catches of largehead hairtail and Japanese anchovy remained high in 2006 with the largehead catch approaching 1.5 million tonnes (Table 16). A second group includes a variety of species groups such as small pelagic fish (scads and chub mackerel), bentho-pelagic fish (silver pomfrets), crustaceans (akiami paste shrimp and gazami crab) and cephalopods.
Table 16 China capture fisheries production, top ten species (2006)
Species |
(1 000 tonnes) |
| Largehead hairtail | 1 429 |
| Japanese anchovy | 976 |
| Akiami paste shrimp | 721 |
| Scads nei | 632 |
| Chub mackerel | 530 |
| Various squids nei | 448 |
| Gazami crab | 407 |
| Daggertooth pike conger | 400 |
| Seerfishes nei | 398 |
| Silver pomfrets nei | 396 |
The Chinese production figures show some notable differences compared with other subregions: a) Total quantity reported under unidentified groupings was 5.3 million tonnes in 2006 representing 34 percent of the Chinese total capture production (Table 17), which far exceeded that of the other subregions; b) a much smaller amount of small pelagic fish in the catch compared with other subregions, especially compared with South Asia; c) consistently high catches of some major species such as the largehead hairtail that hasn't shown any signs of decreasing. In contrast, the Japanese anchovy is showing signs of decreasing catch again after its record increase between 1996 and 1997 (from 671 to 1 200 000 tonnes). However, this decrease could be part of a larger natural oscillation for the species in connection with climatic cycles (e.g. El Niño years);81 and d) there is a disproportionately large catch of crustaceans compared to other regions, especially of the small akiami paste shrimp, indicating that fishers are fishing down the food chain.
Table 17 Unidentified capture production in China (1 000 tonnes)
Species group |
2002 |
2006 |
| Marine fishes nei | 3 512 |
2 287 |
| Marine molluscs nei | 1 376 |
904 |
| Marine crustaceans nei | 1 214 |
210 |
| Freshwater fishes nei | 924 |
1 788 |
| Freshwater molluscs nei | 551 |
340 |
| Freshwater crustaceans nei | 772 |
0 |
| Total of "nei" groups | 8 351 |
5 322 |
| Total capture production | 15 823 |
15 828 |
| % contribution of "nei" groups | 53 |
34 |
Other Asia
Total production increased towards its peak production of 13.5 million tonnes in 1986, and thereafter decreased steadily, but now shows signs of levelling off (Figure 30). Of the countries within this region four dominate and account for 99.2 percent of the catch, namely Japan, Republic of Korea, Iran and Democratic People's Republic of Korea, in descending order. Hence, trends in this region are closely connected to developments in these countries, especially the Japanese fishery (65 percent of total). However, if inland catch is considered alone, Kazakhstan contributes significantly to the produc-tion also.
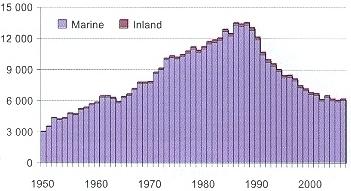
Figure 30 Trends in capture production of Other Asia by environment
During the late 1960s to early 1970s, demersal fish became the most important production group with a very rapid growth rate, achieving a threefold increase in fifteen years (Figure 31). It started to decline, however, after the peak production of four million tonnes in 1974, gradually at first, but with a sharp decline after 1976. The current level of demersal fish production is now as low as in the early 1950s. This reduction was compensated for by increased production of marine pelagic fish until 1988, but then a similar decline to that of demersal fish production occurred. Current production levels of pelagic marine fish have dropped to three million tonnes, similar to those of the early 1970s.
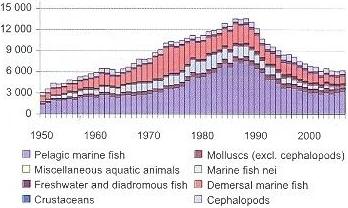
Figure 31 Capture production of Other Asia by major species groups
In terms of major production species, pelagic species predominate in this area. It is also notable that there is high production of cephalopods (Japanese flying squid) and molluscs (yesso scallop) (Table 18).
Oceania
Oceania's capture production also consists mainly of fish taken from marine waters, but unlike Other Asia there was an increasing trend until 2006 (Figure 32). In 2006 there was a rapid drop of almost 12 percent compared to the year before. The decrease can also be seen in the absolute values of pelagic marine fish, demersal marine fish and also crustaceans (Figure 33). Capture fisheries are often subsistence fisheries in many small island states and production may not be well represented in the official statistics. General trends in production are basically determined by a few larger states such as Australia and New Zealand with well established commercial fisheries sectors, with the exception of offshore pelagic fisheries. Rapid growth of pelagic marine fish production from the late 1990s has mainly come from skipjack tuna in Papua New Guinea (Figure 33). Commercial offshore production has also increased in many small island states and contributed to the increase in total production.
Table 18 Other Asia capture fisheries — top ten species (2006)
Species |
(1 000 tonnes) |
| Chub mackerel | 754 |
| Japanese anchovy | 681 |
| Skipjack tuna | 585 |
| Japanese flying squid | 387 |
| Alaska pollock (= Walleye pollock) | 293 |
| Yesso scallop | 272 |
| Pacific saury | 257 |
| Chum (= Keta = Dog) salmon | 243 |
| Japanese jack mackerel | 191 |
| Argentine shortfin squid | 149 |
| Marine fishes nei | 206 |
| Marine crustaceans nei | 63 |
Many of the top ten species produced from capture fisheries in Oceania (Table 19) are from the temperate waters of New Zealand and Australia.
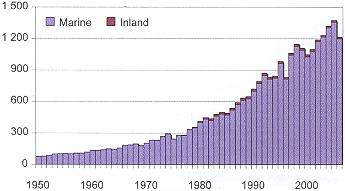 Figure 32 Trends in capture production of Oceania by environment
Table 19 Oceania capture fisheries production � top ten species (2006)
Species |
(1 000 |
| Skipjack tuna | 303 |
| Blue grenadier | 109 |
| Yellowfin tuna | 83 |
| Wellington flying squid | 69 |
| Albacore | 44 |
| Jack and horse mackerels nei | 36 |
| Clupeoids nei | 34 |
| Snoek | 26 |
| Southern blue whiting | 23 |
| Orange roughy | 18 |
| Marine fishes nei | 106 |
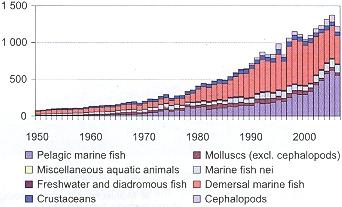
Figure 33 Capture production of Oceania by major species groups
Asia and the Pacific region produced 46.3 million tonnes of aquaculture — 90 percent of global aquaculture production (total aquaculture production less aquatic plants).82 In terms of value, the region's share is slightly less, but is still 78 percent of total value of global aquaculture. When aquatic plant production is included (the vast majority of which originates in Asia and the Pacific region), the region becomes even more dominant, representing 92 percent of global aquaculture production by quantity and 79 percent by value.
Table 20 Top ten aquaculture producer states in 2006 (excluding aquatic plant production)
By Quantity |
By Value |
||
(1 000 |
US$ | ||
| China | 35 818 |
China | 42 809 |
| India | 3 409 |
Chile | 8 320 |
| Viet Nam | 2 365 |
India | 4 946 |
| Thailand | 2 273 |
Viet Nam | 4 377 |
| Indonesia | 2 150 |
Indonesia | 4 272 |
| Philippines | 1 546 |
Thailand | 3 930 |
| Chile | 1 459 |
Japan | 3 105 |
| Egypt | 1 189 |
Norway | 2 716 |
| Bangladesh | 1 056 |
Philippines | 2 394 |
| Japan | 736 |
Mexico | 2 296 |
| Other | 8 153 |
Other | 24 414 |
| Total | 60 153 |
Total | 103 578 |
|
Box 10 Top aquaculture producers 2006 Top ten aquaculture producer states by quantity (excluding aquatic plants) in 2004 were China, India, Viet Nam, Thailand, Indonesia, Philippines, Chile, Egypt, Bangladesh and Japan. Asian states hold the top six positions. By value, China, India, Viet Nam, Indonesia, Thailand, Japan, and Philippines are among the top ten producer states (see Table 20). |
The growth of aquaculture production in the region has continued to be very strong, reflecting the trend for the last 15 years. This results mainly from the continuously increasing production from China.83 Between 2004 and 2006, production in China increased by 3.8 million tonnes (12.3 percent) in line with similar increase between 2002 and 2004 (12.8 percent).
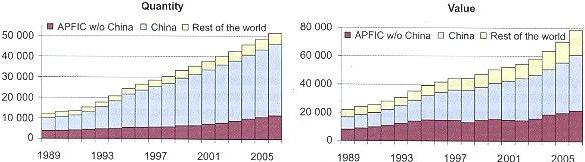
Figure 34 Trends in global aquaculture production
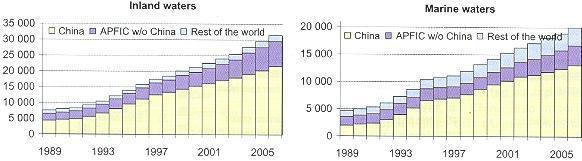
Figure 35 Trends in aquaculture production in Asia and the Pacific region by environment
In terms of tonnage, other countries that showed large increases included India (12 percent), Indonesia (24 percent), Republic of Korea (27 percent), Myanmar (44 percent), Philippines (22 percent), Thailand (10 percent), and Viet Nam (38 percent). Both inland culture and mariculture showed steady growth, but the growth rate of the inland culture sector was more rapid in Asia and the Pacific region, if China is excluded (Figure 34).
China84 alone reported a production of 45.6 million tonnes or 68 percent of the world aquaculture production in 2006 (including aquatic plants). The production of China was 80 and 71 percent of world production in 2002 and 2004. Thus, although production is increasing, the world market share is decreasing. Since China is such a predominant producer, the scale of reported production can mask other regional trends and China85 is treated separately in this report.
|
Box 11 Top cultured species 2006 Top five cultured species in 2006 were all freshwater carps (silver carp, grass carp, common carp, bighead carp and crucian carp) and their aggregated production was 15 753 000 tonnes accounting for 34 percent of total aquaculture production of the subregion. |
If China is excluded, Asia and the Pacific region still remains an important production area for aquaculture, exhibiting steady growth regardless of the culture environment. In particular, inland culture has more than doubled production from 2.6 million tonnes in 1991 to 7.9 million tonnes in 2006. Such advances far exceed the growth of aquaculture in the rest of the world (Figure 35).
APFIC RECOMMENDATION
MEMBER COUNTRIES SHOULD PROVIDE IMPROVED DISAGGREGATED REPORTS OF THE PRODUCTION IN AQUACULTURE, AS A LARGE PART OF THE TOTAL PRODUCTION IS REPORTED AT GROUP LEVEL.
There has been little change in the top twenty cultured species86 in the region between 1990 and 2006 (excluding aquatic plants and molluscs). The top species are all inland waters species, which are dominated by Chinese and Indian carps.
It is worth noting that the number of carnivorous species has increased during the past 15 years. In marine waters, major cultured species are generally dominated by high-value carnivorous species such as penaeid shrimp, jacks and sea breams. Productions of crabs as well as the whiteleg shrimp have made significant advances in recent years. Whiteleg shrimp is now the top production species in the region at 1.3 million tonnes (Table 21).
Table 21 Top fifteen cultured species in Asia and the Pacific region by quantity
Inland Waters |
Marine Waters | ||||||
1990 |
(1 000 |
2006 |
(1 000 |
1990 |
(1 000 |
2006 |
(1 000 |
| Silver carp | 1 432 |
Silver carp | 4 309 |
Giant tiger prawn | 290 |
Whiteleg shrimp | 1 300 |
| Grass carp | 1 042 |
Grass carp | 4 002 |
Fleshy prawn | 185 |
Giant tiger prawn | 636 |
| Common carp | 678 |
Common carp | 2 954 |
Jap. amberjack | 162 |
Jap. amberjack | 155 |
| Bighead carp | 672 |
Bighead carp | 2 392 |
Milkfish | 75 |
Pen. shrimps | 107 |
| Milkfish | 359 |
Crucian carp | 2 096 |
Silver seabream | 52 |
Indo-Pacific swamp crab |
107 |
| Roho labeo | 245 |
Nile tilapia | 1 626 |
Banana prawn | 33 |
Banana prawn | 97 |
| Catla | 235 |
Roho labeo | 1 332 |
Metapenaeus shrimps | 29 |
Japanese seabass | 96 |
| Crucian carp | 216 |
Catla | 1 331 |
Sea squirts nei | 28 |
Milkfish | 91 |
| Nile tilapia | 199 |
White amur bream | 594 |
Coho salmon | 24 |
Swimming crabs | 83 |
| Japanese eel | 164 |
Whiteleg shrimp | 515 |
Penaeus shrimps | 20 |
Silver seabream | 76 |
| White amur bream | 162 |
Pangas catfishes | 500 |
Aq. invertebrates | 12 |
Jap. sea cucumber | 76 |
| Mrigal carp | 160 |
Milkfish | 495 |
Kuruma prawn | 9 |
Large yellow croaker | 70 |
| Mud carp | 80 |
Chinese river crab | 475 |
Bastard halibut | 7 |
Groupers nei | 64 |
| Tilapias nei | 80 |
Mrigal carp | 360 |
Indian white prawn | 7 |
Lefteye flounders | 63 |
| Silver barb | 47 |
Black carp | 351 |
Jap. jack mackerel | 6 |
Porgies | 57 |
| Freshwater fish | 800 |
Freshwater fish | 2 042 |
|
| ||
Aquaculture is an expanding sector in Asia and the Pacific region and very important for many economies in the region. The current trend and current expectations are that aquaculture will play an even more important role in the future, both in terms of a highly internationally traded and export-friendly sector, but also as an invaluable source of protein for both poor and rich in Asia and the Pacific region.
To highlight the changes taking place within the sector, a review of the major groups of species that are currently cultured in the region is presented below. Species are grouped according to the trophic needs of the species and in some cases the degree of reliance on external inputs (such as feeds and infrastructure for culture). Often the lower trophic levels of aquaculture do not generate the same amount of attention as the higher level trophic species. The lower trophic levels of aquaculture that require fewer inputs are often the cornerstone of the diet for both the rural and the urban poor. Production is presented per species (family, order) from all environments (i.e. freshwater, brackish and mariculture) except for salmonids, in which case production is presented per environment.
Carnivorous species or species requiring higher production inputs
Freshwater carnivorous species
Eels (order Anguilliformes and Synbranchiformes)
The global production of eels was 458 000 tonnes in 2006, which corresponds to a doubling of production since 2002 (Figure 36). Of this production, 98 percent was produced in Asian farms. Eel production in Japan (Anguilla japonica) has remained stable for the past five years at about 20 000 tonnes. The production of Taiwan Province of China has declined greatly to 23 000 tonnes in 2006, compared to the top production year in 1990 (55 000 tonnes). In contrast, production in China has risen steadily, reaching a new high in 2006 of 202 000 tonnes. Taiwan Province of China and Republic of Korea also produced some quantities of Japanese eel through aquaculture. All of this production is reported as Japanese eel. However, as China also imports European glass eels (Anguilla anguilla) some of this reported production is likely to include the European eel. Chinese swamp eel (lai) production is also high at 192 000 tonnes for 2006.
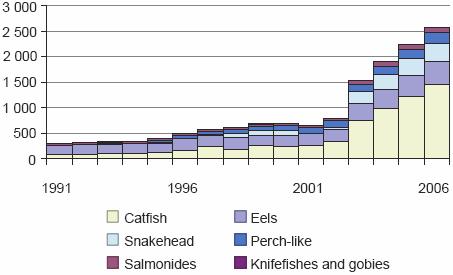
Figure 36 Changes in freshwater carnivorous species production, 1991 to 2006 (1 000 tonnes) in Asia and the Pacific region
Europe has increasingly supplied Asian eel farms with glass eels, and the region has gradually become more dependent on the wild-caught eels of Europe. In 1997, for example, France exported more than 266 tonnes of European eels to destinations outside the European Union, amounting to 55 percent of all European Union eel exports outside Europe that year.87 Correspondingly, the Chinese import of eel in 2006 was 213 tonnes. The recent listing of European eel under CITES Appendix II now means that export outside of Europe is restricted and thus sourcing of elvers within Asia and the Pacific region has now become a priority, with reports of several countries looking to their own resources for possible export to China and other eel culturing countries.
Salmonids (family Salmonidae)
Freshwater production of salmonid species in the region has developed rapidly in the last four years. In part because of the development of the rainbow trout industry in Iran, which has almost tripled the production in four years (to 46 000 tonnes) and in part because of the salmonid (four species) production in China that now amounts to 44 000 tonnes (0 tonnes in 2002).88
Perch-like fishes (family Percichthyidae)
China reported a production of 202 000 tonnes for mandarin fish (Siniperca chuatsi) in 2006. The production has been steadily increasing since 1995 when it was first reported. Other reported species in this family are Murray cod and golden perch. The culture of mandarin fish in China is worth mentioning since being highly carnivorous it is considered only possible to raise it on live food. There has now developed a complete service sector of farmers who produce small bream as live feed for this fish. A good example of a low trophic level fish being cultured as feed for a carnivore, with little or no reliance on marine sources of feed in the system. A lesson here is that small-scale farmers can use low risk systems to service more intensive or higher-value aquaculture operations.
Catfish (order Siluriformes)
This is by far the most popular of the cultured freshwater carnivorous species group. The top five producing states are China, Viet Nam, Thailand, Indonesia and India. Total production in 2006 was 1.5 million tonnes, which is an increase of 47 percent since 2004. China started to report on this group in 2003 and now produces 41 percent of the total production in the region. Part of this increase can also be explained by the inclusion of Viet Nam's production of pangas catfishes.
The top five species are pangas catfishes, amur catfish (Silurus asotus), channel catfish, hybrid catfish (C. batrachus x C. gariepinus) and yellow catfish (approximately 90 percent of the total production for the group). The production of torpedo-shaped catfishes nei (Clarias spp.) is stable and has fallen out of the top five list because of increases in the other species.
Viet Nam have seen a dramatic increase in the production of tra (Pangasianodon hypophalmus) and basa (Pangasius bocourti), the two main catfish species cultured in that country. The production is mainly located in a few provinces in the south of Viet Nam in the Mekong River Delta. The production in 2006 reached a record 825 000 tonnes and it is forecasted that the production will surpass 1 million tonnes in 2008. The United States used to be the largest market for Vietnamese produced catfish, but during a trade dispute in 2003 the Vietnamese exporters diversified away from the US market. The export to the European Union increased and today accounts for more than 50 percent of the export. The Vietnam Association of Seafood Exporters (VASEP) estimates that Viet Nam accounts for about 40 percent of the total European (27 countries) frozen freshwater fillets market.
Snakeheads (family Channidae)
The total production in 2006 was 358 000 tonnes in Asia and the Pacific region and the top four producing states are China, India, Thailand and Indonesia. China has just started to report snakehead production separately (as with the catfish) in 2003. In 2006 China produced 85 percent of the total Asian production.
The trend for this group is hard to define because of inclusion of the Chinese production in 2003. Indonesia and Thailand show a stable trend at a low level (approximately 10 000 tonnes). India has fluctuated in the past ten years with a high in 2000 of 80 000 tonnes and a low in 2001 of 13 000 tonnes, but is again showing an increase to almost 35 000 in 2006. The production in China has increased by 27 percent to 203 000 tonnes since 2004.
The snakehead species, although generally popular in some countries do not enjoy a large export market, even within the region. There is certainly no intra-regional trade, the fish has no real fillet value and is generally sold live or whole. However, some of it is exported from China to Hong Kong SAR. The rapid rise of pangasius and tilapia have effectively marginalized this species, which once had greater prominence as a cultured species.
Knifefish and gobies (order Osteoglosiformes and Gobiformes)
These species are not widely cultured but have a good market price in certain countries. The sand goby production in Asia is almost totally based on on-growing of wild caught fingerlings. The total production of knifefishes and marble goby was 814 tonnes in 2004 which is an increase by 600 tonnes since 2004. Almost all this increase can be attributed to the Indonesian production of marble goby.
Marble goby is hence also the most cultured species in the orders. Thailand has shown a declining trend and in Malaysia the production has declined by half to about 100 tonnes in 2006, except for a peak in 2003 of 700 tonnes. The slow growth rate and carnivorous habit as well as the requirement for moving or well-aerated water make culture of this species comparatively costly. The low densities of culture also mean that returns per unit area are low and the rerun period is long. Farmers may now be tending to move away form this species towards more rapid turnover and intensive systems of tilapia, where margins and lower, but cash flow is more regular.
Marine and brackish water carnivorous species
Amberjacks (family Carangidae)
Japanese culture of amberjack (Seriola) is the leader within this family with production stable at 155 000 tonnes in 2006 (Figure 37). The Japanese fishery for fingerlings for this species (mojako) is an interesting example of what might be considered a sustainable fish seed fishery for aquaculture. The juveniles are caught in a fishery using seaweed as attractants and the juveniles are transported live to the farms for on-growing. The system is demonstrably sustainable because of the length of time it has been pursued and the fishery catch records show no discernable impact on the adult fishery.
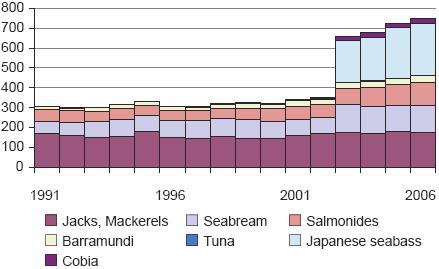
Figure 37 Marine and brackish water carnivorous species production in the last 15 years
Barramundi and Japanese seabass (family Centropomidae and Percichthyidae)
China reported large production of Japanese seabass ((Lateolabrax japonicus) starting in 2003 and 2004 (256 000 tonnes in 2006), which may be an effect of China's improved reporting on individual species (these species may have previously been reported under marine finfish nei). Also Republic of Korea is producing Japanese seabass — 1 600 tonnes in 2006). Barramundi (Lates calcarifer) is gaining ground with the regional total reaching 32 000 tonnes in 2006. Thailand has become the top producer in the region with a still increasing trend. There is some interest in other species within these families, especially the Nile perch (Lates niloticus) which has particularly white flesh and is widely traded as a commodity. Lates calcarifer does not have such good flesh colour, but may still offer some potential as an alternative in some markets. The recent declines in the Nile perch fishery in Africa's Lake Victoria have certainly enabled species such as pangasius and even barramundi to penetrate markets that had previously only been accessible to Nile perch.
Salmonids — Brackishwater/Mariculture
Culture of salmonids (chinook, coho, and Atlantic salmon) in brackish water and mariculture is reported from Australia, New Zealand and Japan and currently the production amount is 41 000 tonnes. Japanese coho salmon culture peaked in 1991 and has declined sharply since, however in 2006 the production again increased and reached 12 000 tonnes. New Zealand's chinook salmon production has increased in the last two years and has now reached 7 700 tonnes. Over the past ten years the Australian Atlantic salmon industry has developed considerably to a current figure of 20 000 tonnes in 2006.
Grouper (family Serranidae)
Production of grouper has increased rapidly from 22 000 tonnes in 2002 to 69 000 tonnes in 2006. This increase is because China started to report on this species in 2003. The major producers include China, Taiwan POC, Malaysia, Indonesia and Thailand. In 2006, production of six different grouper species was reported, however the bulk production (91 percent) was reported as groupers nei. Additionally, Viet Nam is producing grouper, but has yet to report on this species separately.
There are at least 16 species of groupers that are cultured in many Southeast Asian countries, including Indonesia, Malaysia, Philippines, Taiwan, Thailand, Hong Kong SAR, the southeast of China, and Viet Nam — as well as other parts of the tropics in the south eastern USA and the Caribbean.89 Grouper culture is also undertaken in India, Sri Lanka, Saudi Arabia, Republic of Korea and Australia.
Despite the huge popularity of live fish in China and Southeast Asia, only 15 to 20 percent of the amount consumed each year comes from aquaculture, as culture is principally constrained by limited and unreliable supplies of wild seed and the difficulties of spawning in captivity.90 The grouper trade has come under the spotlight (see APFIC's Status and potential of fisheries and aquaculture published in 2004) with respect to the live reef fish trade. This is not strictly classified as aquaculture as it involves the taking of fish and "holding them" (rather than significantly increasing size or weight through feeding/growth). However, the distinctions become difficult when juvenile fish are taken from the wild and on-grown. The culture of fingerlings in hatcheries has been achieved from some species and there is a contribution to supply fingerlings/juveniles from hatcheries, however reporting on this remains weak. Since grouper are particularly difficult to culture in closed systems, full-cycle culture of most grouper species is not yet possible (although several important advances have been made in recent years). For this reason, about two-thirds of all grouper culture involves the capture and grow-out of wild seed (Sadovy, 2000). There needs to be greater desegregation from grouper produced from hatchery reared fingerlings versus that dependent on wild caught fingerlings and juveniles. This is an area that would benefit from improved labelling and traceability, possibly under a certification scheme. The starting point for this would be to target those countries that are producing significant numbers of grouper fingerlings from hatcheries, to determine the relative percentage contribution of fingerlings from each source (and the species that this comprises).
Cobia (Rachycentridae)
Cobia (Rachycentron) culture has increased rapidly from 13 tonnes in 1996 to 2 400 tonnes in 2002 and is now 25 000 tonnes in 2006. One main reason for the rapid increase is that China is reporting this species separately. Chinese production in 2006 was 22 000 tonnes whereas Taiwan Province of China reports a production of 2 900 tonnes. Culture of this species is believed to take place in other states such as Viet Nam and Thailand, largely as a result of the increasing availability of fingerlings from Taiwan Province of China. This production is, however, not reported widely, therefore the total production can be considered conservative. The very rapid growth rate of this species and relative hardiness in ponds make it an attractive species for aquaculture. It has been dubbed the "tropical salmon" because of these characteristics, however, feed conversion ratios (FCRs) are currently rather high suggesting we are some way from industrializing its production. The fish does not enjoy wide acceptance in Asia, partly because of it being an unusual catch item (it has a solitary habit) and hence an unfamiliar species to many. Its firm flesh makes good sashimi and it bakes well, but in other places it is more commonly known as a dried or salted fish.
Southern bluefin tuna (Scombridae)
Southern bluefin tuna culture in Australia has emerged as a significant industry for the country over the past ten years reaching 4 000 tonnes in 2002 and has stayed at this level in 2006. Although the quantity is relatively low compared with other species, the very high value of this product makes its production a significant economic activity wherever it is practiced. The total value of the Australian southern bluefin tuna wild harvest component of the fishery was approximately US$50.5 million, and the value added from grow out of wild caught fish in sea cages is approximately US$97.3 million91 (2002 to 2003).
Seabream (Sparidae)
Seabream production is confined to Japan, China, Taiwan Province of China, Republic of Korea and Hong Kong SAR. The Japanese production of seabream was 71 000 tonnes in 2006. China reported over 40 000 tonnes from 2003 (the first year figures for seabream production were reported), in 2006 the production was 53 000 tonnes. The production of this species was probably reported earlier as "other marine finfish nei".
Other marine finfish not elsewhere identified (nei)
Most of these fish are assumed to be carnivorous and are fed by trash fish from the Chinese capture fisheries. China's production of European turbot is estimated at about 3 000 tonnes, representing about 33 percent of global aquaculture production.92
Table 22 Aquaculture production reported under "marine fishes nei"
Country/Entitiy |
Tonnes |
Tonnes |
| China | 202 587 |
278 970 |
| India | 8 000 |
18 510 |
| Japan | 6 951 |
5 930 |
| Malaysia | 1 458 |
3 276 |
| Taiwan POC | 3 027 |
3 122 |
| Indonesia | 1 602 |
826 |
| Hong Kong SAR | 493 |
728 |
| Philippines | 162 |
416 |
| RO Korea | 3 |
262 |
| Singapore | 55 |
40 |
This group of fish is of interest because of the large reported production from China. Even though China has decreased its reporting on nei species by 64 percent from 2002 to 2004, it has since increased again (Table 22). The quantity of "marine fish nei" reported by China equals the total aquaculture production of Malaysia. Since the individual species are not reported, trends cannot be determined.
Finfish requiring lower inputs
Freshwater omnivorous and herbivorous fish have been important food fish for developing states in Asia and the Pacific region. Traditional production methods have become diversified and intensified, starting with fertilized polyculture systems and moving towards systems using supplemental feeds and even complete feeds. As demand for fish increases and prices rise, further pressure on intensification and the use of feeding can be expected in many states.
APFIC RECOMMENDATION
MEMBER COUNTRIES SHOULD IMPROVE ESTIMATIONS OF THE EXTENT OF PRODUCTION FROM BACKYARD SYSTEMS IN ORDER TO ASSESS THEIR CONTRIBUTION.
Backyard ponds are an increasingly common sight in many states; however this production is frequently not captured in national statistical surveys, mainly because of the small unit size. In many cases ponds may be below the size required for registration and production from these ponds is not viewed as a significant economic activity. However, the large number of these ponds and the aggregated production and value to the households engaging in the activity is probably very significant. The lack of reliable information about this part of the sector currently limits evaluation of the grassroots impact of rural aquaculture in the region.
It has been suggested that the wide range of species that is currently produced from aquaculture will reduce as greater rationalization and aggregation of production operations focus on a small number of species. This lesson has been taken from the livestock sector and is considered to be an essential part of the "industrialization" of aquaculture. This trend does not appear to be the case so far in the region with farmers increasingly seeking out new species that give them a marketing or profit advantage.
Tilapia
This "industrialization" trend is seen in some states with species such as tilapia. There is a trend towards standardization of size, feeds and production systems, some quality control, avoidance of off-flavours, and marketing to supermarket chains. The top eight producers in the region together produced 1.6 million tonnes of tilapia in 2006 (Table 23).
Table 23 Tilapia top eight producer states (2006)
Country |
Tonnes |
| China | 978 135 |
| Indonesia | 189 570 |
| Philippines | 163 004 |
| Thailand | 109 742 |
| Taiwan POC | 83 435 |
| Malaysia | 28 635 |
| Lao PDR | 19 590 |
| Myanmar | 2 000 |
Reported exports of tilapia are 14 percent of total regional production, which can be considered low. The continuing domestic demand and the high quality required for export targeted fish mean that domestic marketing is still attractive in many states. The biggest exporter of frozen whole tilapia and frozen fillets to the USA was China (mainland and Taiwan Province), accounting for 90 percent of total supply in 2006 (Table 24).93
Table 24 Countries exporting tilapia (2006)
Country |
Tonnes |
| China | 164 008 |
| Taiwan POC | 37 071 |
| Thailand | 18 735 |
| Bangladesh | 112 |
Carps and barbs (cyprinids)
Carps and barbs continue to be the most popular species group among Asia-Pacific states. The top five cultured species are carps in freshwater production (Table 21). Their production is particularly important in terms of the vital supply of protein in the major populous states in the region such as China, India and Bangladesh. Silver carp has maintained the highest production for decades. Grass carp was once in a distant second place but the gap between the two species closed in 2006. Common carp, bighead carp and crucian carp follow on the list. Common carp is literally the most commonly cultured species in the region with 20 states and areas having reported culturing this species (Table 25).
Table 25 Carps and barbs top ten producer states (2006)
Country |
Tonnes |
| China | 15 807 420 |
| India | 2 704 883 |
| Bangladesh | 642 554 |
| Indonesia | 287 737 |
| Myanmar | 263 000 |
| Pakistan | 121 740 |
| Thailand | 81 400 |
| Iran | 77 463 |
| Lao PDR | 58 410 |
| Nepal | 25 409 |
Although production of most of the species in this group generally exhibits an increasing trend, the rate of growth since 2001 for silver carp has started to show signs of slowing down. There are reports that the profitability of production of these species in India and China is declining and farmers are starting to explore the production of alternative higher value species. Since the markets of these species are largely domestic, there is little opportunity for export, although India for example does export to neighbouring Nepal and Bangladesh. Moreover, Myanmar, has recently strongly developed its exports of carp to neighbouring Bangladesh and also to the Middle East.
Pacus and pirapatinga (Collossoma spp. and Piaractus spp.)
These Latin American species are not reported in detail for most countries, instead they are grouped under "freshwater species nei". China began reporting production of pirapatinga (Piaractus brachypomus) separately since 2003 and there was a reported 90 000 tonnes in 2006.
Freshwater fish nei
Latest reported statistics from China has seen the reduction of "freshwater fish nei" from 2 million tonnes in 2002 to less than 540 000 tonnes in 2004 and up again to 714 000 tones in 2006. These fish are now reported by species and interestingly are mostly carnivorous species with the exception of pirapatinga. The species which are now reported in detail are amur catfish (307 000 tonnes ), snakehead (303 000 tonnes), swamp eel (lai) (192 000 tonnes), channel catfish (170 000 tonnes), pond loach (127 000 tonnes), yellow catfish (100 000 tonnes), pirapatinga (90 000 tonnes), Chinese longsnout catfish 24 000 tonnes), sturgeons nei (17 000 tonnes), trouts (15 000 tonnes), pond smelt (10 000 tonnes), and salmonids nei (1 500 tonnes). Of these, the channel catfish and Chinese longsnout catfish have seen the biggest increases (in terms of percentage) since 2004.
Table 26 Milkfish top four producer States (2006)
Country |
Culture Environment |
Tonnes |
| Philippines | Brackish | 220 602 | Marine | 59 907 |
Freshwater | 34 565 |
| Indonesia | Brackish | 212 883 | Marine | 49 |
| Taiwan POC | Brackish | 29 375 | Freshwater | 26 760 |
Singapore | Marine | 1 183 |
Milkfish
Milkfish culture is a strong tradition in the Philippines and this reflects the country's preference for the species (Table 26). There are also traditions of milkfish culture in some of the Pacific Islands (Kiribati, Nauru, Cook Islands and Palau. Of these countries, only Kiribati reported production to FAO in 2006. Milkfish have typically been produced in brackish water ponds but there is an increasing trend in reported mariculture production, indicating the use of more intensive cage systems. These systems are fed with either pellets or trash fish and are part of the general trend of intensification of mariculture in the Philippines. Indonesia and the Philippines are traditionally the largest producers. Taiwan Province of China is reducing its production, possibly because of increasing attention to higher-value species. Singapore has steadily developed its mariculture of milkfish.
Mullet
Pond-based brackishwater culture of mullet is typical but Republic of Korea has been reporting increasing mariculture production since 2000, and the freshwater culture from 2006 is almost zero. Indonesia has the largest production of this species and although the country experienced a sharp decline in 1998, it has since shown a stable positive trend. Taiwan Province of China has seen a gradual reduction in production and Thailand has greatly reduced production in recent years. Although not reported as a separate species, China also has noteworthy production of mullet (reported as marine finfish nei).
Crustaceans
Although a large number of crustacean species are cultured, the predominant commercial species are brackishwater shrimps, freshwater prawns and freshwater/brackish water crabs.
Penaeid shrimp culture
Marine shrimp continued to dominate crustacean aquaculture, with two major species accounting for over 60 percent of the total crustacean production in 2006 (the whiteleg shrimp Penaeus vannamei and giant tiger shrimp Penaeus monodon). Whiteleg shrimp production in Asia and the Pacific region increased from 2 000 tonnes in 2000 to over a million tonnes in 2004 and was 1.8 million tonnes in 2006. A significant amount of this production comes from China (1.0 million tonnes) and Thailand (0.5 million tonnes) as well as increasing amounts from Viet Nam and Indonesia (increases of 275 and 165 percentage respectively). Many other countries are now producing this species, but not yet at a level that it is entering the statistics. Whiteleg shrimp ranked tenth by weight in terms of regional aquaculture production in 2006 (excluding plants). However, it ranked first by value at US$6 485 million, which is almost a doubling since 2004. Production trends in the region have increased over the past ten years for the major producers (Table 27). China suffered a major setback in shrimp farming in the mid-1990s because of the occurrence of viral diseases in shrimp culture, but since that time production has slowly recovered and has been increasing rapidly in recent years.
Other major producers, Thailand and Viet Nam, have also encountered fluctuations in production primarily associated with the impact of viral diseases. Production in the Philippines, India, Sri Lanka and Indonesia has also been affected by the impact of viral diseases, typically WSSV.94 There are good indications that the development of more biosecure shrimp farming systems and better farm management practices have made it possible for shrimp farmers to limit the negative impact of viral diseases. The introduction of specific pathogen free (SPF) broodstock and post-larvae has also been important in this development. Generally, the high demand from the international market has maintained interest in the culture of shrimp for export.
Table 27 Penaeid shrimp top ten producer states (2006)
Country |
Tonnes |
| China | 1 242 385 |
| Thailand | 500 800 |
| Viet Nam | 349 000 |
| Indonesia | 339 703 |
| India | 144 347 |
| Bangladesh | 64 700 |
| Myanmar | 60 000 |
| Philippines | 40 654 |
| Malaysia95 | 34 973 |
| Taiwan POC | 12 571 |
Total production of P. vannamei in Asia was approximately 1.8 million tonnes in 2006 (1.1 in 2004). The main reason for importing P. vannamei to Asia has been the poor performance, slow growth rate and disease susceptibility of the major indigenous cultured shrimp species, P. chinensis in China and P. monodon virtually everywhere else.
The trend in shifting production away from P. monodon to P. vannamei is quite clear now and has been reported in previous APFIC publications. The massive increase in volume of production of whiteleg shrimp coupled to the similar size ranges produced by all countries has led to severely depressed prices for whiteleg shrimp. With so many states now producing essentially the same product, global prices dropped dramatically during 2002 to 2003. There has been a trend of decreasing shrimp prices for a number of years now especially the smaller sized whiteleg shrimp. This has follow up effects regarding the actual value of the product sold and disagreements regarding possible dumping of shrimp onto markets.
Producers are attempting to overcome the problem of low prices and narrow profit margins through greater intensification. This echoes the trend in the early 1990s and although systems have improved with the use of limited water exchange and SPF stock, there are still aggregated environmental impacts at the system level because of the total loadings. P. monodon prices remain very high because of a lack of supply, however, until SPF broodstock can be produced, the disease risks for intensive systems remain too high for farmers. It can be anticipated that there will be a significant shift back to P. monodon production once reliable and commercially available supplies of SPF stocks can be accessed in the region.
Freshwater prawns
China and India have recently increased the production of freshwater prawns (their respective productions were zero and 311 tonnes in 1994 as compared to 341 000 tonnes and 34 000 tonnes in 2006). Even Thailand and Bangladesh show increasing trends in production of freshwater prawns. Other producers have had relatively stable production figures (Table 28).
Table 28 Freshwater prawn top eight producer states (2006)
Country |
Tonnes |
| China | 341 159 |
| India | 34 154 |
| Thailand | 29 500 |
| Bangladesh | 20 810 |
| Taiwan POC | 9 878 |
| Indonesia | 1 199 |
| Iran | 270 |
| Malaysia | 194 |
| Myanmar | 50 |
Since it is not easy to intensify production of fresh-water prawns because of their territorial habits and divergent growth effects, the development of this sector is reasonably slow. In some states the sector has shrunk as attention and resources have been diverted to brackishwater shrimp production. Although the principle species cultured in freshwater (M. rosenbergii) does not suffer the same problems with viral diseases that impact the brackishwater shrimp industry so severely, export markets for freshwater prawns are much smaller and less developed. This is because consumers in general are not as familiar with these species as with brackishwater shrimp. Freshwater prawns, however, enjoy good domestic markets especially in South and Southeast Asian states.
Crabs
Chinese river crab (Eriocheir sinensis) and Indo-Pacific swamp crab (Scylla serrata) constituted the major cultured crabs in the region in 2006. Indo-Pacific swamp crab has shown stable increasing production trends for the past decade. The reporting of marine crabs nei from China has declined from 178 185 tonnes in 2002 to around 15 000 tonnes in 2006. At the same time, Indo-Pacific swamp crab nei and swimming crabs nei increased from zero to 120 000 tonnes and 89 000 tonnes respectively.
Molluscs
Mollusc culture is split into low-value species produced in extensive cultured systems (e.g. seeded blood cockle mudflats, mussel and oyster stake culture) and high-value species produced in intensive systems (fed systems, and possibly recirculation).
Recent improved breakdown by species of aquaculture production of Chinese molluscs has given a better indication of the proportion of low- and high-value mollusc production. China's reported production of "molluscs nei" has dropped from 1.25 million in 2002 to 1.05 million tonnes in 2006, which is still an increase of 0.2 million tonnes since 2004 (the major drop between 2002 and 2004).
Although it is possible to separate species such as abalone or giant clam as high-value species, there are difficulties with some species such as mussels that may be cultured in low-input systems in one country (e.g. Thailand) but relatively high-input systems in another (e.g. New Zealand). Many states report their mollusc production in a large grouping such as marine molluscs nei. The IFPRI/WFC outlook on fish supply96 projected increasing mollusc production, although this may have been based on current production trends rather than the resource potential. The issue of site availability is likely to constrain future development of mollusc culture in several states as can be seen in the cases of Japan and Republic of Korea (Tables 29 and 30). In these two states, the production of molluscs and seaweeds has been relatively stable for many years. This indicates that the suitable sites may now all be taken.
Table 29 Lower value molluscs top ten production (2006)
Country |
Species |
Tonnes |
| China | Japanese carpet shell | 3 018 803 |
| China | Constricted tagelus | 679 010 |
| China | Blood cockle | 315 950 |
| Thailand | Green mussel | 272 901 |
| New Zealand | New Zealand mussel | 97 000 |
| RO Korea | Korean mussel | 81 617 |
| Thailand | Blood cockle | 66 062 |
| Malaysia | Blood cockle | 45 674 |
| Philippines | Green mussel | 19 690 |
| Republic of Korea | Japanese carpet shell | 14 327 |
Table 30 Higher value molluscs top ten production (2006)
Country |
Species |
Tonnes |
| China | Pacific cupped oyster | 3 892 027 |
| China | Yesso scallop | 1 148 764 |
| RO Korea | Pacific cupped oyster | 283 296 |
| Japan | Yesso scallop | 212 094 |
| Japan | Pacific cupped oyster | 208 182 |
| Taiwan POC | Pacific cupped oyster | 28 547 |
| Thailand | Cupped oysters nei | 21 612 |
| Philippines | Slipper cupped oyster | 16 838 |
| Australia | Pacific cupped oyster | 7 924 |
| Australia | Sydney cupped oyster | 4 071 |
Unlike fish culture, the intensification of mollusc culture is quite difficult and probably not economically viable. The trend in mollusc culture is more likely to be a shift from lower-value species to higher-value species in those areas where sites are suitable. A further dimension is the development of intensive onshore culture operations such as those for abalone and a number of gastropod species.
Aquatic plants
Aquatic plant production can be divided into two distinct groups. The first group consists of seaweeds of temperate waters solely and traditionally used for food purposes and the second group consists of tropical species mainly processed as a source of commercially valuable biopolymers (carrageenan, agar) that are used for various food and non-food purposes (Table 31).
Table 31 Aquatic plants top ten producer states (2006)
Country |
Tonnes |
| China | 10 867 410 |
| Philippines | 1 468 905 |
| Indonesia | 910 636 |
| RO Korea | 765 595 |
| Japan | 490 062 |
| DPR Korea | 444 300 |
| Malaysia97 | 30 000 |
| Viet Nam | 30 000 |
| Cambodia | 16 000 |
| Taiwan POC | 5 949 |
Seaweeds for food purpose
This group includes Japanese kelp, laver (nori), green laver and wakame. The production of these species is confined to East Asian states and has a relatively stable production.
The only exception to this is Japanese kelp culture, which has the largest share of production. Its production has doubled from two million tonnes in three years to 1993 and another one million tonnes was added in the next six years. This rapid increase was probably a result of continued expansion of cultured areas in China. Production of Japanese kelp peaked in 1999 and since then has stabilized, which might indicate that the rapid expansion of production area reached a limit and further sites are not available.
|
Box 12 Top cultured aquatic plants Major cultured aquatic plants in East Asia are Japanese kelp, Laver (nori) and wakame. They are all seaweeds for food purposes in contrast to those produced in Southeast Asia, which are mainly used as a source of commercially valuable biopolymers. |
Recent detailed reporting from China has given a clearer picture of aquatic plant production (Table 32).
Table 32 Aquatic plants top ten cultured species (2006)
Species |
Tonnes |
| Japanese kelp | 4 923 618 |
| Aquatic plants nei | 2 423 265 |
| Wakame | 2 364 263 |
| Laver (nori) | 1 506 102 |
| Zanzibar weed | 1 299 642 |
| Warty gracilaria | 1 062 754 |
| Red seaweeds | 910 636 |
| Fusiform sargassum | 132 330 |
| Eucheuma seaweeds nei | 119 209 |
| Elkhorn sea moss | 85 634 |
Seaweeds for biopolymers
This group98 consists of Eucheuma cottonii, Kappaphycus alvarezzi, Gracilaria spp., red seaweeds and others. The Philippines has the highest production of these aquatic plants and Eucheuma cottonii (also known as Zanzibar weed), production in the Philippines far exceeds the production of other seaweeds (1.3 million tonnes in 2006).
New areas are being investigated for the expansion of seaweed production since global demand for carrageenan and other alginates is expected to continue to rise.
Reptiles and amphibians
Reported species are soft shell turtle, crocodiles and frogs. China has greatly increased its reported production of soft shell turtle in the past five years to a total production of 189 000 tonnes in 2006. Other states that reported production of turtles are Thailand, Taiwan Province of China and Republic of Korea. There are limited data on frog production, although frogs are being increasingly cultured in many states. China has reported a production of 74 000 tonnes of frogs in 2006. The small size of a typical frog farm (using small cement tanks or even pens) means that quantification of this type of operation is problematic.
Crocodile production is growing quickly in the region with Cambodia exporting juvenile crocodiles to both Viet Nam and China. Thailand and Papua New Guinea also have crocodile farms. This production is rarely reported in fishery or aquaculture statistics.
Niche aquaculture species
There are a number of niche aquaculture species which this review does not cover. These species are either cultured at the pilot or experimental level, or simply not reported by many states. Some of the species are not food type commodities (e.g. sponge and pearls, ornamental shells, ornamental fish) and are therefore not routinely monitored by the authority reporting fisheries information (Table 33).
Table 33 Niche aquaculture species (2006)
Species |
Tonnes |
| Japanese sea cucumber | 75 725 |
| Jellyfishes | 37 678 |
| Sea squirts nei | 16 931 |
| Sea urchins nei | 9 780 |
| Aquatic invertebrates nei | 4 527 |
| Sea cucumbers nei | 96 |
South Asia
South Asia's aquaculture production has tripled in the last 15 years, from 1.4 million tonnes in 1991 to 4.2 million tonnes in 2006. The majority of production comes from inland waters and hence the growth of the sector has been mostly because of increasing freshwater culture (Figure 38). This increase is probably not heavily dependent on marine sources of feed and therefore a real contribution in terms of food security.
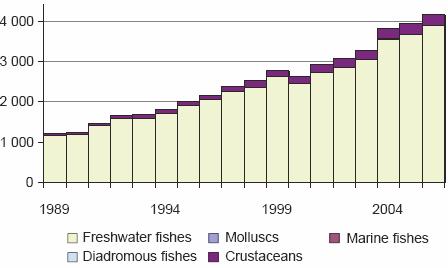
Figure 38 Trends in aquaculture production of South Asia by major species groups
There has been a major increase in roho and catla production since 2003. Although Indian carps (roho, catla and mrigal carp) have been the main group cultured in the region, there have been notable increases in the production of introduced Chinese carps in recent years. Silver carp production also increased almost fivefold in two years (1999 to 2001) and became the top cultured species in 2001. Since then, the production has declined by half, but is now up to almost the 2003 quantity again (Figure 39).
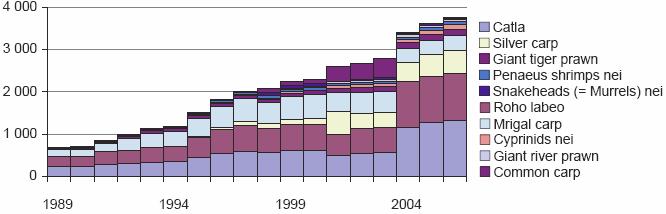
Figure 39 Aquaculture production of major species in South Asia
Marine crustacean production, giant tiger prawn, penaeid shrimp and giant river prawn, have increased steadily and reached 260 000 tonnes in 2006. In general, the level of diversification of cultured species is relatively low in this area and there has been very limited reported marine finfish production in the past, but it has increased to 18 000 tonnes in the last years for which statistics are available.
Southeast Asia
Aquaculture production in Southeast Asia is very diversified and in 2006 production of eighty-three different species was reported. The number of cultured species and the details of reporting have increased rapidly in the last five years (Figure 40).
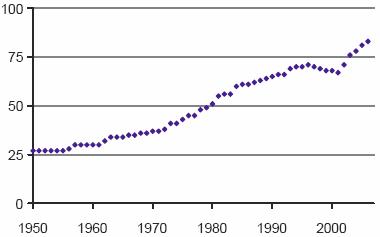
Figure 40 Number of species reported from Southeast Asian aquaculture
In terms of value, highly-priced crustaceans have an increased share of 45 percent of the total production, followed by freshwater fish at 41 per-cent (Figure 41). The main difference is that the relatively low volume of crustaceans gives a high value in return, whereas freshwater fishes have a relatively high value but a large quantity is produced. In contrast, the large production of aquatic plants results in a relatively small value.
|
Box 13 Top cultured species Southeast Asia 2006 Top ten cultured species in Southeast Asia (by quantity, excluding aquatic plants) were whiteleg shrimp, Nile tilapia, milkfish, pangas catfish, common carp, green mussel, giant tiger prawn, rohu catfish and silver barb. |
Freshwater finfish culture has increased from 0.6 million tonnes in 1991 to 3.2 million tonnes in 2006, with an average annual increment of 0.17 million tonnes. In the mariculture sub-sector, the production of aquatic plants has shown a surprisingly strong growth. Crustaceans have been a major cultured species throughout the subregion, with rapid growth in recent years (Figure 42).
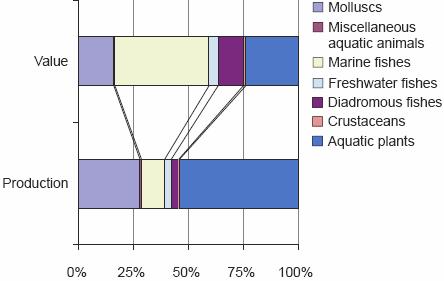
Figure 41 Aquaculture production of Southeast Asia: proportion of major species groups
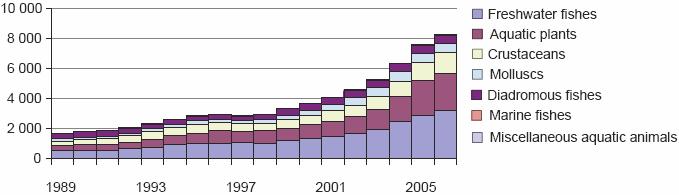
Figure 42 Trends in aquaculture production of Southeast Asia by major species groups
Eucheuma cottonii is still the most widely cultured aquatic plant in the region with a production of 1.3 million tonnes in 2006. The massive growth of aquatic plants in this region reflects the strong promotion and good conditions in the islands of Philippines and Indonesia. But it is also partly because of improvement and development of market chains. The growth rate has, however, slowed down in 2006 after seeing two years with more than 30 percent growth (Figure 43).
Apart from aquatic plants, whiteleg shrimp (P. vannamei is the top produced species, and has very recently surpassed the previous top species, giant tiger shrimp (Penaeus monodon).
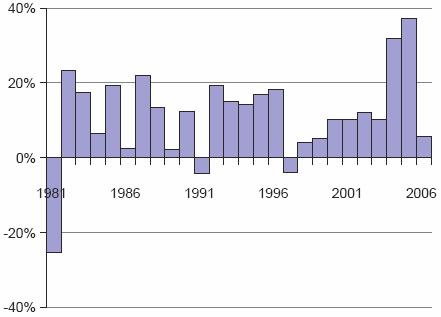
Figure 43 Growth rate (percent: year to year) the last 25 years in Southeast Asian aquatic plant production
China
China's aquaculture production has now reached 45.6 million tonnes or 70 percent of the world aquaculture production in 2006 (including aquatic plants). Growth in inland culture has continued, mainly from increased production of finfish culture, which has increased by an average of 9.2 percent since 2004. This increase is being achieved through the intensification of existing systems rather than any significant increase in production area. Growth in production from marine waters has been driven by molluscs and aquatic plants in the past; however, the pro-duction of aquatic plants has levelled off in the last two years (Figure 44).
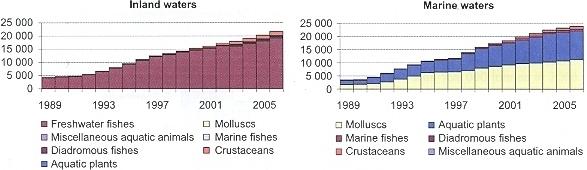
Figure 44 Trends in aquaculture production of China by environment
The production of most cultured species continued to increase. However, there are a number of species worth highlighting, as follows:
Japanese kelp (Laminaria japonica): growth in its production is remarkable; increasing from 1.2 million tonnes in 1990 to 4.3 million tonnes in 2006 with a minor decline to 4.0 million tonnes in 2004, compared to the 2002 value of 4.3 million tonnes.
Miscellaneous aquatic plants: this massive volume of aquatic plants is not reported at the species level. However, production jumped from 0.2 million tonnes in 1990 to 3.9 million tonnes in 2002. The large decline in aquatic plant production in 2003 is explained by improved reporting at species level by China. The reported figure for aquatic plant production in 2006 is 2.3 million tonnes. As a result of the improved reporting by China, wakame (Undaria pinnatifida) has become the second largest cultured plant with a total of 2.0 million tonnes in 2006. Most of the Chinese plant production is for food purposes in contrast to other large producer regions (Southeast Asia) where most of the production is for processing.
Pacific cupped oyster: this is another cultured species that has achieved outstanding growth; increasing from 0.5 million tonnes in 1990 up to 4.6 million tonnes in 2004. Mollusc production is also difficult to intensify and increased production suggests developments of new production areas as in the case of aquatic plants (Figure 45). Additionally, the production of blue mussels has declined (-28 percent) and instead has been replaced by an increased production of Korean mussels (300 percent) and Chilean mussels (69 percent) since 2004.
Carnivorous species: Rapid growth in production of high value carnivorous species such as mandarin fish, Chinese river crab and marine finfish started to occur in 1995. More recently there have been large increases in the production of snakehead, grouper and lai.99 Many of the carnivorous species show very similar patterns of growth in production (Figure 46).
Other Asia
Aquatic plants continue to predominate aquaculture in Other Asia, particularly in East Asian states. They account for 54 percent of total production. This is followed by molluscs (28 percent) and marine finfish (10 percent). However, the high economic value of marine finfish makes this species group the largest contributor in terms of value, constituting 41 percent of total production value (Figure 47).
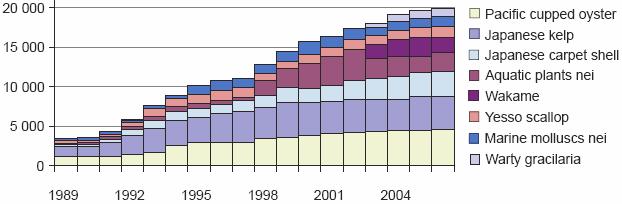
Figure 45 Trends in top eight cultured species in China (aquatic plants and molluscs included)
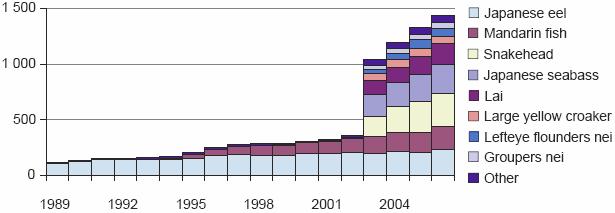
Figure 46 Trends in major cultured carnivorous species production in China
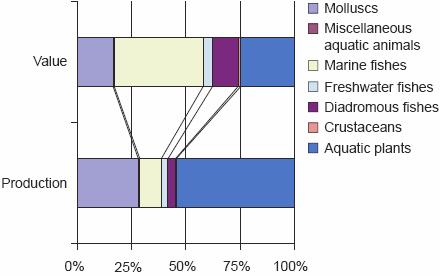
Figure 47 Aquaculture production in Other Asia: proportion of major species groups
Excluding aquatic plants, the aquaculture production in this region has been very stable; most of the major species groups have been maintained at the current level of production for the last ten years. The exception then is aquatic plant production, which peaked in 1993 at 2.3 million tonnes then decreased by almost 35 percent to 1.3 million tonnes in 2000, but has since steadily increased and is 1.7 million tonnes in 2006 (Figure 48).
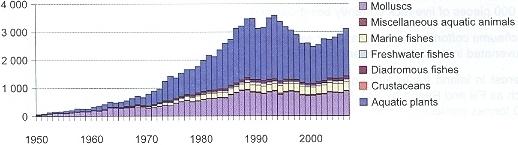
Figure 48 Trends in aquaculture production of Other Asia by major species groups
It is notable that the percentage of carnivorous fish in the total for fish production is very high in this subregion (77 percent in 2006) compared with South Asia, Southeast Asia and China, which all have levels below 10 percent (1, 2.3 and 7 percent respectively).
Oceania
Aquaculture production from Oceania is relatively limited. The production was 159 000 tonnes in 2006 (Figure 49) and out of this production New Zealand and Australia where responsible for 98 percent.
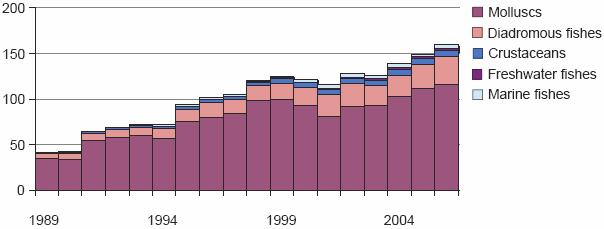
Figure 49 Aquaculture production in Oceania by major species group
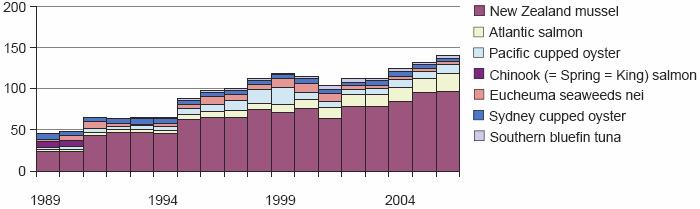
Figure 50 Top seven species aquaculture production in Oceania
Molluscs and diadromous fish are the main cultured groups. The main cultured species are New Zealand mussels and different salmon species, and this also makes up the bulk of the production (Figure 50). However, live reef fish, aquarium fish and pearls, bring significant income to some Pacific Islands, although relatively low in quantity. Although the target species are mostly caught from the wild, there is an increasing desire for culture-based sources. Giant clam culture for the ornamental trade is widespread throughout the region and the total export is probably in the range of 30 000 to 50 000 pieces/annum. The Pacific is also a major supplier of "live rock" (rock encrusted with coralline algae) with approximately 50 000 pieces of live rock currently being cultured in the Fiji Islands.
Eucheuma cottonii seaweed (Zanzibar weed) culture is well established in the Kiribati atolls and is being rejuvenated in the Solomon Islands and Fiji.
Interest in inland freshwater aquaculture is growing, particularly among the larger Melanesian states such as Fiji and Papua New Guinea. At present the most commonly farmed species is tilapia with about 400 tonnes produced in 2006.
65 Including all FAO Fishing Areas.
66 http://www.fao.org/fishery/countrysector/FI-CP_JP/en
67 In the following sections, unless otherwise indicated, "China" refers to the subregion that includes China, Hong Kong SAR, Macao SAR and Taiwan POC.
68 Hortle, K.H. 2007. Consumption and the yield of fish and other aquatic animals from the Lower Mekong Basin. MRC Technical Report No. 16, Mekong River Commission, Vientiane. 88 pp.
69 Lymer, D., Funge-Smith, S. et al. 2008. A review and synthesis of capture fisheries data in Thailand. RAP Publication (in progress). FAO. Bangkok.
70 In this report, this term refers to fish that are generally of relatively low economic value and typically small size.
71 Funge-Smith, S., Lindebo, E. & Staples, D. 2005. Asian fisheries today: The production and use of low-value/trash fish from marine fisheries in the Asia-Pacific region, RAP publication 2005/16.
72 Edwards, P., Tuan, L.A. & Allen, G.L. 2004. A survey of marine trash fish and fish meal as aquaculture feed ingredients in Vietnam. ACIAR Working paper 57.
73 Nei = not elsewhere included
74 FAO. 1998. Bulletin of fishery statistics - fishery fleet statistics, No. 35, Rome.
75 Tuna commodity update GLOBEFISH, May 2008 issue.
76 Tuna in the Indian Ocean: current status and new challenges. Presentation at the INFOFISH Tuna conference, Bangkok, May 2008.
77 Status of tuna stocks and management challenges in the Western and Central Pacific Ocean.Presentation at the INFOFISH Tuna conference, Bangkok, May 2008.
78 The Soviet Union and the Russian Federation are counted as one.
79 The Soviet Union and the Russian Federation are counted as one.
80 see footnote 8
81 Klyashtorin, L.B. 2001. Climate change and long-term fluctuations of commercial catches: the possibility of forecasting. FAO Fisheries Technical Paper. No. 410. Rome. 86 pp.
82 However, see Box 1 about revised data for Chinese aquaculture.
83 Growth rate for the period of 1991-2006 was 11.3 percent, excluding aquatic plants production.
84 This figure is for all China, but the massive scale of China's aquaculture production challenges statistical collection and there are uncertainties regarding the quantities reported.
85 See footnote 67
86 There is significant volume of aquaculture production reported by large group of species, e.g. not identified at family, order or species level. Consequently, the species items totals could have underestimated the real production of the individual species.
87 TRAFFIC report. Available at http://www.traffic.org/dispatches/archives/march2001/eel.html
88 No reported production, although probably included in nei group.
89 Sadovy, Y. 2000. Regional survey for fry/fingerling supply and current practices for grouper mariculture: evaluating current status and long-term prospects for grouper mariculture in Southeast Asia. Final report to the Collaboration APEC grouper research and development network (FWG 01/99). December, 2000.
90 Tupper, M. & Sheriff, N. 2007. Capture-based aquaculture for groupers. A report to the FAO international workshop on technical guidelines for the responsible use of wild fish and fishery resources for capture-based aquaculture production, Hanoi, Viet Nam, 8 to 12 October 2007.
91 http://www.afma.gov.au/fisheries/tuna/sbt/default.htm; http://www.australianaquacultureportal.com/PDF/industry_bluefin_1.pdf
92 http://www.ices.dk/committe/acfm/comwork/report/2005/may/Wild%20cultured%20fish%20interactions.pdf
93 http://www.eurofish.dk/indexSub.php?id=3529
94 White spot syndrome virus.
95 The figure of 34 973 has been changed to 34 612 since the data was submitted to FAO in 2007.
96 Delgado, C.D, Wada, N., Rosegrant, M.W., Meijer, S. & Ahmed, M. 2003. Fish to 2020. Supply and demand in changing global markets. WorldFish Centre Technical Report 62. 226 pp.
97 Malaysia now reports a production of 43 200 for 2006 and this will replace the FAO estimate of 30 000 in future communications.
98 The taxonomy for Eucheuma is confusing. The name cottonii is a general word used to describe a number of Eucheuma species (Doty, 1988). Recent taxonomic revisions have added to the confusion. Eucheuma striatum var. tambalang and E. alvarezii var. tambalang are now Kappaphycus alvarezii [common name "tambalang"], Eucheuma striatum var. elkhorn is Kappaphycus striatum [common name "elkhorn"], Eucheuma cottonii is Kappaphycus cottonii, and Eucheuma spinosum is now Eucheuma denticulatum [common name "spinosum"] source: "Seaweeds" in "Introduction of commercially significant aquatic organisms to the Pacific Islands", SPC.
99 The word "lai" is Thai and is generally used for eel (i.e. pla lai; probably swamp eel Monopterus albus). This reporting from China could be because of the import of elvers from Thailand.
![]()
![]()