

ALINORM 04/27/23
APENDIX III
PROPOSED DRAFT GENERAL GUIDELINES ON SAMPLING
(At Step 8 of the Procedure)
TABLE OF CONTENTS
DRAFT GENERAL GUIDELINES ON SAMPLING
rationale
Codex Food Standards are aimed at protecting consumers’ health and ensuring fair practices in the food trade.
Codex Methods of Sampling are designed to ensure that fair and valid sampling procedures are used when food is being tested for compliance with a particular Codex commodity standard. The sampling methods are intended for use as international methods designed to avoid or remove difficulties which may be created by diverging legal, administrative and technical approaches to sampling and by diverging interpretation of results of analysis in relation to lots or consignments of foods, in the light of the relevant provision(s) of the applicable Codex standard.
The present guidelines have been elaborated to facilitate the implementation of these goals by Codex Commodity Committees, governments and other users.
basic recommendations for the selection of codex sampling plans
The present clause represents a pre-requisite to the use of these Guidelines, and is intended to facilitate the selection of Codex sampling plans, as well as to follow a systematic approach for this selection.
The following enumerates the essential points that the Codex commodity committees, Governments and other users should address for the selection of appropriate sampling plans, when setting-up specifications.1
1) Existence (or not) of international reference documents on sampling of the considered products
2) Nature of the control
• Characteristic applicable to each individual item of the lot
• Characteristic applicable to the whole lot (statistical approach)
3) Nature of the characteristic to control
• Qualitative characteristic (characteristic measured on a pass/failed or similar basis, i.e. presence of a pathogen micro-organism)
• Quantitative characteristic (characteristic measured on a continuous scale, for example a compositional characteristic)
4) Choice of the quality level (AQL or LQ)
• In accordance with the principles laid down in the Codex Manual of Procedures
and with the type of risk: critical/ non-critical non-conformities.
5) Nature of the lot
• Bulk or pre-packed commodities
• Size, homogeneity and distribution concerning the characteristic to
control
6) Composition of the sample
• Sample composed of a single sampling unit
• Sample composed of more than one unit (including the composite sample)
7) Choice of the type of sampling plan
• acceptance sampling plans for statistical quality control
§ for the control of the average of the characteristic
§ for the control of per-cent non-conforming items in the lot
- Definition and enumeration of non-conforming items in the sample (attribute
plans)
- Comparison of the mean value of the items forming the sample with regards
to an algebraic formula (variable plans).
• Convenience (or pragmatic, empirical) sampling plans2
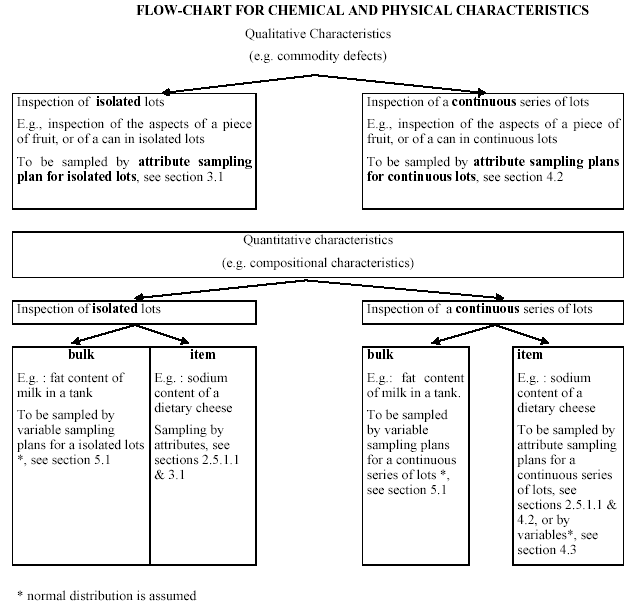
The two flow-charts in the following pages sum up a systematic approach for
the selection of a sampling plan and reference to the appropriate sections in
the document, which does not cover sampling of heterogeneous bulk lots.
FLOW-CHART FOR MICROBIOLOGICAL CHARACTERISTICS
Micro-organisms with severe hazard or with moderate direct health hazard of potentially extensive spread in food. E.g., pathogenic E. coli, Salmonella spp, Shigella, Clostridium botulinum, Listeria monocytogenes (risk groups) |
Micro-organisms with no or low direct health hazard (spoilage, shelf-life and indicator organisms) or with moderate direct health hazard (limited spread).
| |
|
||
Sampling by two-class attributes plans,
|
Sampling by three-class attributes plans, see sec. 3.2.2 | |
8) Decision rules for the lot acceptance/rejection
See the appropriate references in Sections 3, 4 or 5.
Sampling plans are required which ensure that fair and valid procedures are used when food is being controlled for compliance with a particular Codex commodity standard.
Since numerous, yet often complex, sampling plans are available it is the purpose of these guidelines to help those responsible for sampling to select sampling plans that are appropriate for statistical inspections under specifications laid down by Codex standards.
No sampling plan can ensure that every item in a lot conforms. These sampling plans are nevertheless useful for guaranteeing an acceptable quality level.
These guidelines contain the elementary principles of statistical control at reception, which complete the basic recommendations laid down in the Preamble.
These Guidelines are above all aimed at Codex Commodity Committees which select from the plans recommended in sections 3, 4, and 5 those which at the time of the drafting of a commodity standard appear to them best suited for the inspection to be made. These Guidelines can also be used, if applicable, by governments in case of international trade disputes.
The Codex commodity committees, Governments and other users should be provided with the competent technical experts needed for good use of these guidelines, including the selection of appropriate sampling plans.
The sampling plans described in these Guidelines may be implemented either by Governmental food control authorities, or by professionals themselves (self-inspection performed by producers and/or traders). In the latter case, these Guidelines enable the governmental authorities to check the appropriateness of the sampling plans implemented by the professionals.
It is recommended that the different parties concerned with sampling come to an agreement on the implementation of the same sampling plan for the respective controls.
These Guidelines define at first in Section 2 general notions on food sampling, applicable in any situations, and then in Sections 3 to 5 cover certain situations of statistical food control, for whose certain sampling plans have been selected.
The following sampling situations are covered: for the control of only homogeneous goods:
• control of percentage of defective items by attributes or by variables, for goods in bulk or in individual items,
• control of a mean content.
These Guidelines do not cover the control of :
• non-homogeneous goods;
• for homogeneous goods, the cases where measurement error is not negligible compared to sampling error (see 2.4), as well as the control of a qualitative characteristic in a bulk material and;
• they do not deal with double, multiple and sequential sampling plans, deemed too complex in the frame of these Guidelines.
Detailed sampling procedures do not lie within the scope of these general guidelines. If necessary, they should be established by the Codex commodity committees.
These Guidelines are applicable for control at reception, and may not be applicable for control of end-products and for process control during production.
The following Table 1 summarises the situations covered by these Codex Guidelines and those, which are excluded. It also gives, where applicable, useful international references for some of the situations not covered by these Codex Guidelines.
TABLE 1 : GUIDE TO SELECTION OF SAMPLING PLANS FOR HOMOGENEOUS LOTS3
Lots consisting of individualisable bulk material |
Lots consisting of individual4 items | |||
Quantitative Measurements |
Qualitative Measurements5 |
Quantitative Measurements | ||
Isolated lots |
Inspection by Variables of Bulk Materials for Percentage Non-conforming -Section 5.1
|
Inspection by Attributes for percentage non-conforming - Section 2.5.1.1
|
Inspection by Variables for percentage non-conforming -Section 4.3.2 (s method)
|
Average Content –
|
Continuous series of lots |
Inspection by Variables of Bulk Materials for Percentage Non-conforming - Section 5.1
|
Inspection by Attributes for percentage non-conforming - Section 2.5.1.1
|
Inspection by Variables for percentage non-conforming -Section 4.3.3 (σ method)
|
Average Content -
|
1.5 RELATIONSHIP OF THE GUIDELINES WITH THE ISO GENERAL STANDARDS
In the cases of control situations dealt with by this document, the sampling shall only follow the rules of the sampling plans of this document, even if this document refers to the following ISO Standards for the details of the scientific and statistical background.
In the cases of control situations not dealt with by this document, and if they are dealt with by a general ISO Standard (see below), the product Committee or the governments should refer to them, and define how to use them6.
The ISO Standards are provided in the following:
ISO 2854 : 1976(E) : Statistical interpretation of data – Techniques of estimation and tests relating to means and variances
ISO 2859-0:1995(E): Sampling procedures for inspection by attributes - Part 0: Introduction to the ISO 2859 attribute sampling system
ISO 2859-1:1999(E): Sampling procedures for inspection by attributes - Part 1: Sampling plans indexed by acceptable quality level (AQL) for lot-by-lot inspection
ISO 2859-2-1985(E): Sampling procedures for inspection by attributes - Part 2: Sampling plans indexed by limiting quality (LQ) for isolated lot inspection
ISO 3494:1976 : Statistical interpretation of data – Power of tests relating to means and variances
ISO 3951:1989(E): Sampling procedures and charts for inspection by variables for percent nonconforming
ISO 5725-1:1994 (E): Application of statistics – Accuracy (trueness and precision) of measurement methods and results – Part 1: General principles and definitions
ISO 7002:1986 (E) : Agricultural food products - Layout for a standard method of sampling a lot,
ISO 8423:1991(E): Sequential sampling plans for inspection by variables for percent nonconforming (known standard deviation)
ISO 8422:1991(E): Sequential sampling plans for inspection by attributes
ISO/TR 8550:1994(E)): Guide for the selection of an acceptance sampling system, scheme or plan for inspection of discrete items in lots
ISO 10725:2000(E): Acceptance sampling plans and procedures for the inspection of bulk material
ISO/FDIS 11 648-1 : Statistical aspects of sampling from bulk materials – Part 1 : General principles
ISO/DIS 14 560 : Acceptance sampling procedures by attributes – Specified quality levels in non-conforming items per million
The standards listed above were valid at the time of publication of these guidelines. However, since all standards are subject to revision, parties to agreements based upon these guidelines should ensure that the most recent editions of the standards are always applied.
This section presents:
• the rationale and the procedure to be followed before sampling a lot and selecting a sampling plan (section 2.1.2);
• the vocabulary and the main notions used in sampling (section 2.2), particularly the principle of the operating characteristic curve of a sampling plan (section 2.2.12) and the related notions of acceptable quality and the limiting quality level (section 2.2.14). These notions are essential for risk assessment prior to selecting a plan;
• sampling techniques, which are methods to collect and form the sample to be analysed (section 2.3);
• the different types of errors associated to the sampling plan (section 2.4);
• the types of sampling plans which lay down the rule for reaching a decision on the basis of the results obtained on samples taken from the inspected lot, in other words the acceptance or refusal of the lot after inspection (section 2.5);
• the principle of the inspection by single sampling plans by attributes (section 2.5.1.1) and by single sampling plans by variables (section 2.5.1.2) of percent nonconforming is presented and illustrated by the corresponding and compared operating characteristic curves (section 2.5.1.3);
• the selection of an attributes plan or a variables plan is illustrated by a diagram of the decision to be taken in terms of the inspection situations encountered (section 2.5.1.4);
• a table summarises the comparative advantages and disadvantages of an attribute plan and a variable plan (section 2.5.1.5).
Most of sampling procedures involve the selection of a sample (or samples) from a lot, the inspection or analysis of the sample, and the classification of the lot (as ‘acceptable’ or ‘not acceptable’) based upon the result of the inspection or analysis of the sample.
An acceptance sampling plan is a set of rules by which a lot is to be inspected and classified. The plan will stipulate the number of items, to be randomly selected from the lot under inspection, which will comprise the sample. A sampling procedure which involves ‘switching’ (see Section 2.2.16) from one sampling plan to another is referred to as a ‘sampling scheme’. A collection of sampling plans and sampling schemes constitutes a ‘sampling system’.
Before elaborating any sampling plan, or before the Codex Committee on Methods of Analysis and Sampling endorses any plan, the Commodity Committee should also indicate the following:
• The basis on which the criteria in the Codex Commodity standards have been drawn up, for example;
° whether on the basis that a specified high proportion of items in a lot, should comply with the provision in the standard, or
° whether the average of a set of samples extracted from a lot must comply and, if so, whether a minimum or maximum tolerance, as appropriate, is to be given
• Whether there is to be any differentiation in the relative importance of the criteria in the standards. If so, the appropriate statistical parameter to be applied to each criterion should be indicated
Instructions on the procedure for implementing the sampling plan should indicate the following:
• The measures necessary in order to ensure that the sample taken is representative of the consignment or of the lot. (If a consignment consists of several lots, samples should be collected that are representative of the individual lots.)
• The samples shall be taken randomly, since they are more likely to reflect the quality of the lot, however information from a sample may still not be identical with that from the whole lot due to sampling error.
• The size and number of individual items forming the sample taken from the lot or consignment
• The procedures to be adopted for collecting, handling and recording the sample(s)
The following issues should also be addressed when selecting a sampling procedure, in addition to the foreword:
• The distribution of the characteristic(s) in the population to be sampled
• The cost of the sampling plan
• Risk assessment (see Sections 2.2.11 and 2.2.14): Inspection systems, incorporating appropriate sampling plans, and designed to ensure food safety should be operated on the basis of objective risk assessment appropriate to the circumstances. Whenever possible, the risk assessment methodology employed should be consistent with internationally accepted approaches; and should be based on current available scientific evidence.
The precise definition of an acceptance sampling procedure will require the setting or selection of:
• The characteristic to be measured
• Lot size
• An attribute or variables plan
• The Limiting Quality (LQ) level, for isolated lots; or the AQL (Acceptable Quality Level), for a continuous series of lots
• The level of inspection
• The size of the sample
• The criteria for acceptance or rejection of the lot
• The procedures to be adopted in cases of dispute
The definitions of sampling terms used in these guidelines are mostly those specified in ISO 7002.
Some of the more commonly used terms in acceptance sampling are described in this section.
2.2.1 Lot
A lot is a definite quantity of some commodity manufactured or produced under conditions, which are presumed uniform for the purpose of these Guidelines.
For the goods presumed heterogeneous, sampling can only be achieved on each homogeneous part of this heterogeneous lot. In that case, the final sample is called a stratified sample (see 2.3.3).
NOTE: A continuous series of lots is a series of lots produced, manufactured or commercialised on a continuous manner, under conditions presumed uniform. The inspection of a continuous series of lots can only be achieved at the production or processing stage.
2.2.2 Consignment
A consignment is a quantity of some commodity delivered at one time. It may consist in either a portion of a lot, either a set of several lots.
However, in the case of statistical inspection, the consignment shall be considered as a new lot for the interpretation of the results.
• If the consignment is a portion of a lot, each portion is considered as a lot for the inspection.
• If the consignment is a set of several lots, before any inspection, care shall be given to the homogeneity of the consignment. If not homogeneous, a stratified sampling may be used.
2.2.3 Sample (representative sample)
Set composed of one or several items (or a portion of matter) selected by different means in a population (or in an important quantity of matter). It is intended to provide information on a given characteristic of the studied population (or matter), and to form a basis for a decision concerning the population or the matter or the process, which has produced it.
A representative sample is a sample in which the characteristics of the lot from which it is drawn are maintained. It is in particular the case of a simple random sample where each of the items or increments of the lot has been given the same probability of entering the sample.
Note: Sections A.11 to A.17 of Annex A of the Standard ISO 7002 define the composite sample, the reference sample, the global sample, the test sample, the laboratory sample, the primary sample and the reduced sample.
Procedure used to draw or constitute a sample.
Empirical or punctual sampling procedures are sampling procedures, which are not statistical-based procedures that are used to make a decision on the inspected lot.
In the estimation of a parameter, the total estimation error is the difference between the calculated value of the estimator and the true value of this parameter.
The total estimation error is due to:
• sampling error,
• measurement error,
• rounding-off of values or sub-division into classes,
• bias of the estimator.
2.2.6 Sampling error
Part of the total estimation error due to one or several of the following parameters:
• the heterogeneity of the inspected characteristics,
• the random nature of a sampling,
• the known and acceptable characteristics of the sampling plans.
Item or increment of individualisable goods
a) Individualisable goods : Goods which can be individualised as items (see b) or in increments (see c), for example :
• a pre-package,
• a flask or a spoon containing a quantity of goods determined by the sampling plan, and taken from a lot, for example :
- a volume of milk or of wine stored in a tank,
- a quantity of goods taken from a conveyor belt,…
b) Item: An actual or conventional object on which a set of observations may be made, and which is drawn to form a sample.
Note: The terms “individual” and “unit” are synonymous with “item”
c) Increment: Quantity of material drawn at one time from a larger quantity of material to form a sample.
2.2.8 Sampling plan
Planned procedure which enables one to choose, or draw separate samples from a lot, in order to get the information needed, such as a decision on compliance status of the lot.
More precisely, a sampling plan is a scheme defining the number of items to collect and the number of non-confirming items required in a sample to evaluate the compliance status of a lot.
2.2.9 The Characteristic
A characteristic is a property, which helps to identify, or differentiate between, items within a given lot. The characteristic may be either quantitative (a specific measured amount, plan by variables) or qualitative (meets or does not meet a specification, plan by attributes). Three types of characteristic and associated types of sampling plan are illustrated in Table 2.
Table 2: Sampling plans to be associated with the type of characteristic
Type of Characteristic |
Type of Sampling Plan |
Commodity defects : characteristics that may be expressed by two excluding situations as passed/not passed, yes/not, integer/not integer, spoiled/not spoiled (e.g. as applied to visual defects such as loss of colour, mis-grading, extraneous matter etc) |
‘Attributes’ (e.g. as in Codex Sampling Plans for Pre-packaged Foods, CAC/RM 42-19697) |
Compositional characteristics: characteristics that may be expressed by continuous variables. They may be normally distributed (e.g. most analytically determined compositional characteristics such as moisture content) or they may be non-normally distributed. |
‘Variables with unknown standard deviation’ for normally distributed characteristics and ‘attributes’ for characteristics whose distributions deviate significantly from normal |
Health-related properties (e.g. in the assessment of microbial spoilage, microbial hazards, irregularly occurring chemical contaminants etc) |
Specified sampling plans to be proposed appropriate to each individual situation (e.g. for microbiological control, see Section 3.2). Plans to determine incidence rates in a population may be used. |
2.2.10 Homogeneity
A lot is homogenous relative to a given characteristic if the characteristic is uniformly distributed according to a given probability law throughout the lot8.
NOTE: A lot being homogeneous for a given characteristic does not mean that the value of the characteristic is the same throughout the lot.
A lot is heterogeneous relative to a given characteristic if the characteristic is not uniformly distributed throughout the lot. Items in a lot may be homogenous on one characteristic whilst heterogeneous on another characteristic.
2.2.11 Defects (Nonconformities) and Critical Nonconformities
A defect (nonconformity) occurs within an item when one or more, quality characteristic does not meet its established quality specification. A defective item contains one or more defects (see 3.2.3 for some examples).
Lot quality may be judged in terms of the acceptable percentage of defective items or the maximum number of defects (nonconformities) per hundred items, in respect of any type of defects (see also Section 2.2.7 for the definition of an item).
Most acceptance sampling involves the evaluation of more than one quality characteristic, which may differ in importance with respect to quality and/or economic considerations. Consequently, it is recommended that nonconformities be classified as follows, according to their degree of seriousness (see also Section 2.2.9 for the definition of a characteristic):
• Class A: Those nonconformities considered to be of the highest concern in terms of the quality and/or safety of the product (such as health-related properties, see Table 2);
• Class B: Those nonconformities considered to be less important than the Class A nonconformities (such as commodity defects or compositional characteristics, see Table 2).
This classification should be determined by the Codex Commodity Committees.
2.2.12 Operating Characteristic Curve
For a given sampling plan, an Operating Characteristic (OC) curve describes the probability of acceptance of a lot as a function of its actual quality. It relates the rate of defective items in lots (x-axis) with the probability of accepting these lots at control (y-axis). Section 4.1 develops the principle of such a curve and illustrates it with an example.
2.2.13 Producers’ risk and consumers’ risk
Producers’ risk (PR)
On the OC curve (see 2.2.12) of a sampling plan, the producers’ risk corresponds to the probability to reject a lot having a proportion P1 of defective items (generally low), fixed by the sampling plan. According to the producer, such a lot should not be rejected.
In other words, the PR is the probability to wrongly reject a lot.
Generally, the PR is expressed by a proportion noted P95 corresponding to the proportion of defective items in the lot accepted in 95 % of the cases (i.e. rejected in 5 % of the cases).
Consumers’ risk (CR)
On the OC curve (see 2.2.12) of a sampling plan, the consumers’ risk corresponds to the probability to accept a lot having a proportion P2 of defective items (generally low), fixed by the sampling plan. According to the consumer, such a lot should be rejected.
In other words, it is the probability to wrongly accept a lot.
Generally, the CR is expressed by a proportion noted as P10 which corresponds to the proportion of defective items in the lot accepted in 10 % of the cases (i.e. rejected in 90 % of the cases).
Discrimination Distance (D)
The discrimination distance (D) is the distance between the producers’ risk (PR) and the consumers’ risk (CR), and should be specified, taking into account the values of the population standard deviations of sampling and of measurements.
D = CR - PR
Discrimitation ratio (DR)
The discrimination ratio (DR) is the ratio between the consumers’ risk (CR) and the producers’risk (PR). It is generally given by the ratio between P10 and P95.
![]()
This ratio enables to appreciate also the efficiency of a sampling plan. A ratio below 359 characterises a sampling plan with a particularly low efficiency.
2.2.14 The Acceptable Quality Level (AQL) and Limiting Quality (LQ) Level
The inspection of a lot using either an attributes or variables sampling plan will allow a decision to be made on the quality of the lot.
The Acceptable Quality Level (AQL) for a given sampling plan is the rate of non-conforming items at which a lot will be rejected with a low probability, usually 5 %.
The Acceptable Quality Level (AQL) is used as an indexing criterion applied to a continuous series of lots which corresponds to a maximum rate of acceptable defective items in lots (or the maximum number of defective items per hundred items). This is a quality goal fixed by the profession. This does not mean that all the lots having a rate of defective items greater than the AQL will be rejected at the control, but this means that the higher the rate of defective items exceeds the AQL, the greater is the probability of rejection of a lot. For any given sample size, the lower the AQL, the greater the protection for the consumer against accepting lots with high defective rates, and the greater the requirement for the producer to conform with sufficiently high quality requirements. Any value for AQL should be realistic in practice and be economically viable. If necessary, the value of AQL should take into account safety aspects.
It should be recognised that the selection of a value for the AQL depends on the specific characteristic considered and of its relevance (economic or other) for the standard in its whole. A risk analysis may be undertaken to assess the possibility and severity of negative impacts on public health caused, for example, by the presence in food products of additives, contaminants, residues, toxins or pathogenic micro-organisms.
The characteristics which may be linked to critical defects (for example to sanitary risks) shall be associated with a low AQL (i.e. 0,1 % to 0,65 %) whereas the compositional characteristics such as the fat or water content, etc may be associated with a higher AQL (e.g., 2,5 % or 6,5 % are values often used for milk products). The AQL is used as an indexing device in the tables of the Standards ISO 2859-1, ISO 3951 and in some tables of ISO 8422 and ISO 8423 (see section 1).
The AQL is particular producers’ risk, generally different from P95 (see 2.2.13).
The Limiting Quality (LQ) for a given sampling plan is the rate of non-conforming items at which a lot will be accepted with a low probability, usually 10 %.
The Limiting Quality (LQ) is applied when a lot is considered in isolation. It is a quality level (expressed, for example, as percentage nonconforming items in the lot) which corresponds to a specified and relatively low probability of acceptance of a lot having a rate of defective items of LQ. Generally, the LQ corresponds to the rate of defective items of lots accepted after control in 10 % of the cases. LQ is an indexing device used in ISO 2859-2 (where it is recommended that the LQ is set at least three times the desired AQL, in order to ensure that lots of acceptable quality have a reasonable probability of acceptance).
The LQ is generally very low when the plans aim at the control of food safety criteria. It is often higher when the plans aim at the control of quality criteria.
The LQ is a particular consumers’ risk, it corresponds to P10 (see 2.2.13).
The users of sampling plans shall mandatory agree on the choice on the AQL or LQ of the plan used for the quality control of the lots.
For a given product, a single AQL (or LQ) should be allocated to each of the two classes of nonconformities specified in Section 2.2.11, a low AQL (e.g. 0,65 %) being allocated to Class A nonconformities (e.g. pesticide content in follow-up milk), and a higher AQL (e.g. 6,5%) being allocated to Class B nonconformities (e.g. protein content in follow-up milk).
Consequently, there is a separate sampling plan for each of the two AQLs (LQs), and a lot is accepted only if it is accepted by each of the plans. The same sample may be used for each class provided the evaluation is not destructive for more than one type of nonconformity. If two samples must be collected they can be taken simultaneously for practical reasons.
2.2.15 Responsible Authority
The responsible authority will be the official designated by the importing country; and will normally be responsible, for example, for setting the ‘inspection level’ and for the introduction of ‘switching rules’ (see 2.2.16).
2.2.16 Inspection Levels and Switching Rules
The inspection level relates the sample size to the lot size and hence to the discrimination afforded between ‘good’ and ‘poor’ quality. For example, Tables I and I-A of ISO 2859-1:1989 (E) and ISO 3951:1989 (E) respectively provide seven and five inspection levels. For a given AQL the lower the inspection level number the greater is the risk of accepting poor quality lots.
The inspection level should be set by the ‘responsible authority’. Unless otherwise specified, the normal (II) inspection level shall be used. Reduced (I) level or tightened (III) level should be used when less or more discrimination, respectively, is required. Level II affords less than double the sample size of Level I, Level III gives about one and a half times the sample size of Level II. The ‘special’ levels (S-1 to S-4) should be used where relatively small sample sizes are required and large sampling risks can and/or must be tolerated.
A sampling scheme involves ‘switching’ between normal, tightened and reduced inspection sampling plans. It is recommended that all Commodity Committees include switching rules in those sampling plans applied to a continuing series of lots.
Normal inspection is designed to protect the producer against having a high proportion of lots rejected when the quality of the product is better than the AQL. However, if two out of any five (or fewer) successive lots are not accepted, then tightened inspection must be introduced. On the other hand, if production quality is consistently better than the AQL, sampling costs may be reduced (at the discretion of the responsible authority) by the introduction of reduced-inspection sampling plans.
Switching rules for a continuous series of lots are described in detail in Sections 4.2.2.4 and 4.3.4.
2.2.17 Acceptance Number
For a given attributes sampling plan, the acceptance number is the maximum number of nonconforming units, or the maximum number of nonconformities, allowed in the sample if the lot is to be accepted. Zero acceptance number plans are described in Sections 2.5.2.
Lot Size and Sample Size
For internationally traded commodities, the lot size is usually specified in the shipping manifest. If a different lot size is to be used for sampling purposes, this should be clearly stipulated in the standard by the appropriate Commodity Committee.
There is no mathematical relationship between sample size (n) and lot size (N). Therefore, mathematically, there is no objection to take a sample of small size to inspect an homogeneous lot of large size. However, the designers of the plans in the ISO and other reference documents have deliberately introduced a relationship to reduce the risk of making an incorrect decision for larger lots. The ratio f = n/N influences the sampling error only when the lot size is small. Moreover, in an objective of consumer protection (in particular health), it is recommended, as illustrated in the following example, to choose samples of larger sizes when the lot sizes are large.
Example : Inspection of the fat content in whole milk of 8500 items by attribute sampling plans at AQL of 2,5 %.
Two different plans could be used : plan 1 (n = 5, c = 0, LQ = 36,9 %) and plan 2 (n = 50,
c = 3, LQ = 12,9 %).
Given the LQ of plan 1, lots having a non-conforming rate of 36,9 % (that is 3136 non-conforming items) are accepted in 10 % of cases.
Given the LQ of plan 2, lots having a non-conforming rate of 12,9 % (that is 1069 non-conforming items) are accepted in 10 % of cases.
The choice of plan 2 enables the avoidance of the risk in 10 % of the cases in placing on the market (3136-1069) = 2067 non-conforming items.
When the ratio f = n/N (where n is the sample size and N is the lot size) is less than or equal to 10 %, and when the lots are assumed to be homogenous, it is the absolute sample size that is more important rather than its relationship to the size of the lot.
However, in order to reduce the risk of accepting large numbers of defective items, it is usual to increase the sample size as the lot size increases, especially when it is assumed that the lot is not homogenous.
With a large lot it is possible and economical to take a large sample whilst maintaining a large lot-to-sample ratio and, thereby, achieving better discrimination (between acceptable and unacceptable lots). Furthermore, for a given set of sampling efficiency criteria, the sample size will not increase as rapidly as the lot size and will not increase at all after a certain lot size. However, there are a number of reasons for limiting the lot size:
• the formation of larger lots may result in the inclusion of a widely varying quality
• the production or supply rate may be too low to permit the formation of large lots
• storage and handling practicalities may preclude large lots
• accessibility for drawing random samples may be difficult with large lots
• the economic consequence of non-acceptance of a large lot is large.
Refer to the tables of ISO 2859 and ISO 3951 for correspondence between sample size and lot size.
2.3.1 General
Sampling procedures should be performed in accordance with appropriate ISO Standards related to the commodity of concern (for example ISO 707 for sampling of milk and milk products).
2.3.2 Employment of Sampling Officers
Sampling should be performed by persons trained in the techniques of sample collection by the importing country.
2.3.3 Material to be Sampled
Each lot that is to be examined must be clearly defined. The appropriate Codex Commodity Committee should stipulate how a consignment should be handled in instances where no lot designation exists.
Representative sampling
The representative sampling is a procedure used for drawing or forming a representative sample10.
The requirements of this clause shall be, if needed, completed by procedures (such as how to collect and to prepare a sample). These procedures shall be defined by the users, in particular the Codex Products Committees.
Random sampling involves the collection of n items from a lot of N items in such a way that all possible combinations of n items have the same probability of being collected. The randomness can be obtained by use of table of random number which can be generated by using computer software.
In order to avoid any dispute over the representativeness of the sample, a random sampling procedure should be chosen, whenever possible, alone, or in combination with other sampling techniques.
Assuming the items can be numbered or ordered, even virtually when it is not possible to have individual items (e.g., in the case of a tank of milk or of a silo of grains), the choice of the items or of the increments entering into the sample should be done as follows:
1. To number all the items or increments of the lot (true or virtual)
2. The numbers of the items or increments to be sampled are determined randomly using Table 3 of the Standard ISO 2859-0:1995 or any approved table of random numbers.
The collection of samples is to be performed in a random manner, whenever possible during the loading or unloading of the lot.
If the lot is heterogeneous, a random sample may not be representative of the lot. In such cases, stratified sampling may be a solution. Stratified sampling consists of dividing the lot into different strata or zones, each stratum being more homogenous than the original lot. Then a random sample is drawn from each of these strata, following specified instructions which may be drafted by the Codex product committees. Each stratum can then be inspected by random sampling which usually includes from 2 to 20 items or increments per sample. (see the sampling plans of ISO 2859-1 of letter-codes A to F at the inspection level II). But before sampling, it is necessary, where appropriate, to refer to the specific instructions of the Codex product committees.
When it is not possible to sample at random11, for example in a very large store where the goods are badly tidied or when the production process includes a periodic phenomenon (e.g. a contaminant which is specifically located in a particular area of the silo or a regulator detuned every each k seconds, such as every k seconds the products packaged by this regulator have defaults), it is mandatory :
1. To avoid preferentially choosing items which are more easily accessible or which can be differentiated by a visible characteristic.
2. In the case of periodic phenomena, to avoid sampling every k seconds or every kth package, or every kth centimetres, to take an unit from every nth palette, pre-package,…
A primary sample is the ‘portion of product’ collected from a lot during the first stage of the sampling process, and will normally be in the form of an item (if collected from a lot of prepacked products) or of an increment (if collected from a bulk lot). (However, an ‘increment’ may be considered to be an ‘item’ if measurements are made on individual increments.) As far as is practicable, primary samples should be taken throughout the lot and departures from this requirement should be recorded. Sufficient primary samples of similar size should be collected to facilitate laboratory analysis. In the course of taking the primary samples (items or increments), and in all subsequent procedures, precautions must be taken to maintain sample integrity (i.e., to avoid contamination of the samples or any other changes which would adversely affect the amount of residues or the analytical determinations, or make the laboratory sample not representative of the composite sample from the lot).
When required by the sampling plan, a composite sample is produced by carefully mixing the primary samples (items) from a lot of pre-packaged products; or by carefully mixing the primary samples (increments) from a bulk (not pre-packaged) lot.
Except for economical reasons, this sampling technique is not to be recommended given the loss of information on sample-to-sample variation due to the combination of primary samples.
The bulk or bulked sample should, if possible, constitute the final sample and be submitted to the laboratory for analysis. If the bulk/bulked sample is too large, the final sample may be prepared from it by a suitable method of reduction. In this process, however, individual items must not be cut or divided.
National legislative needs may require that the final sample be subdivided into two or more portions for separate analysis. Each portion must be representative of the final sample.
Packaging and Transmission of Laboratory Samples
The sample finally submitted to the laboratory is described as the laboratory sample and will take the form of either the final sample or a representative portion of the final sample.
The laboratory sample should be kept in such a manner that the controlled characteristic is not modified (e.g., for microbiological controls, mandatory use of a sterile and cooled container). Moreover, the laboratory sample should be placed in a clean inert container offering adequate protection from external contamination and protection against damage to the sample in transit. The container should then be sealed in such a manner that unauthorised opening is detectable, and sent to the laboratory as soon as possible taking any necessary precautions against leakage or spoilage, e.g., frozen foods should be kept frozen and perishable samples should be kept cooled or frozen, as appropriate.
2.3.7 Sampling reports
Every sampling act implies the drafting of a sampling report as described in clause 4.16 of the Standard ISO 7002 and indicating in particular the reason for sampling, the origin of the sample, the sampling method and the date and place of sampling, together with any additional information likely to be of assistance to the analyst, such as transport time and conditions. The samples, in particular the ones for the laboratory, shall be clearly identified.
In case of any departure from the recommended sampling procedure (when it was necessary, for any reason, to deviate from the recommended procedure), it is necessary to append to the sampling report another detailed report on the deviating procedure which has been actually followed. However in this case, no decision can be taken at control, this decision is to be taken by the responsible authorities.
Quantitative results are of only limited value if they are not accompanied by some estimate of the random (unpredictable) and systematic (predictable) errors in them. (Random errors affect the precision of the result, whereas systematic errors affect accuracy.).
Sampling plans are associated with two types of error:
• sampling error (caused by the sample failing to accurately represent the population from which it was collected); and
• measurement error (caused by the measured value of the characteristic failing to accurately represent the true value of the characteristic within the sample).
It is desirable that the sampling errors associated with any sampling plan, as well as the measurement errors associated with the analysis should be quantified and minimised.
The total standard deviation σ is given by the formula:
![]()
where σs is the sampling standard-deviation, σm the measurement standard-deviation
- First case (the most frequent one) : the analytical error is negligible compared to the sampling error, i.e the analytical error is at most equal to one third of the sampling error
In this case, σm ≤ σs/3, and ![]()
The standard deviation for the observed results will be at most 5 % larger than the sampling standard deviation taking into account the analytical error.
- Second case: the analytical error is larger than one third of the sampling error
This case is not covered by these Guidelines.
The following text and curves present simply the principles of inspection by single sampling plans by attributes and by variables of percent nonconforming as well as their efficacy.
A sampling plan for inspection by attributes is a method for evaluating the quality of a lot which operates by classifying each increment of the sample as a conforming or nonconforming characteristic or attribute, depending on whether the Codex standard specification is complied with or not. This characteristic is either qualitative (for example the presence of a blemish on fruit) or quantitative (for example the sodium content of a dietary food, classified as conforming or non-conforming in relation to a limit noted). The number of increments having the nonconforming attribute are then counted and if the acceptance number set by the plan is not exceeded the lot is accepted, otherwise it is refused.
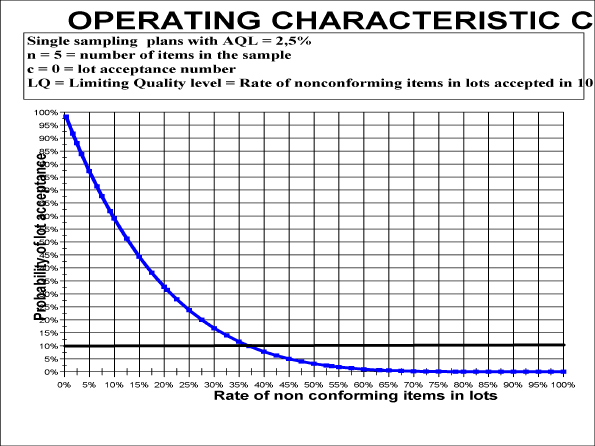
EXAMPLE 1 : A single sampling plan by attributes of AQL = 2,5 % to inspect the sodium content of a lot of dietary cheese low in sodium for which the maximum sodium content is set by Codex standard 53-1981 at 120 milligrams per 100 grams of commodity (noted U = 120 mg/100 g).
Decision to be taken according to this plan:
The lot is accepted if there is no nonconforming increment (c = 0) in a sample of five increments (n = 5), a nonconforming increment being one whose sodium content -given the analytical tolerances- is higher than the specification relative to sodium in dietary cheeses, i.e. 120 milligrams.
The following Figure 1 is the characteristic operating curve of this plan. It shows that in 50 % of the cases, lots having 13 % of defective items are accepted at inspection.
Figure 1: OC Curve, attribute sampling plan
EXAMPLE 2 : Single sampling plan by attributes, AQL = 6,5 %, for the inspection of the quality of pre-packed quick frozen peas.
Characteristics of the plan:
Criterion of non-conformity: the pre-packed bag contains more than 15 % m/m of defective peas (blond peas, blemished peas,…)
Number of sample units: n=13
AQL = 6,5 %
Acceptance number: c = 2 = maximum acceptable number of defective bags in the sample (acceptance criterion of the lot)
Rejection number: Re = 3 = minimum number of defective bags in the sample which implies the rejection of the lot (rejection criterion of the lot)
Decision to be taken according to this plan:
The lot is accepted if there is no more than 2 defective bags in a sample of 13 bags.
A sampling plan by variables is a method for evaluating the quality of a lot which consists of measuring for each item the value of a variable characterising the inspected commodity.
EXAMPLES (To illustrate the difference between the attribute and variable sampling plans, the example for dietary cheese at maximum content of sodium is used for the variable plans):
• The maximum sodium content U of a dietary cheese low in sodium, for which the maximum sodium content is fixed by the Codex standard 53-1981 at 120 milligrams per 100 grams of product ;
• The minimum fat content L of a whole milk;
• A range of values, such as the vitamin A content of an infant formula, between L and U.
The inspection consists of measuring the variable characterising the inspected good for each of the n items forming the sample, then in calculating the mean value ![]() of these n items in the sample.
of these n items in the sample.
The decision concerning acceptance or rejection of the lot is made by comparing this mean content x with the numeric value of an algebraic expression including :
• either U the maximum value of the specification (case of a maximum value to inspect), either L the minimum value of the specification (case of a minimum value to inspect), either L and U (case of a range of values to inspect) ;
• the standard deviation of the values of the variable inspected in the lot ;
• an acceptance constant K, determined by the sampling plan and depending on the AQL distribution law of the measured variable.
The algebraic expression depends also on the fact that the standard deviation is known or unknown. The decision formulae are given in 2.5.1.2.2 and 2.5.1.2.3.
The σ-method (see 2.2.19) is used for example in the case of inspections made by professionals who, owing to the large number of inspections they make, know the standard deviation sufficiently precisely to consider it as known. The following table 3 defines the acceptance/rejection rules of the lots.
Table 3: Lot acceptance/rejection criteria for σ-method
Inspection of a minimum value L
|
Inspection of a maximum value U
|
Inspection of a range of values L ≤ | |
Lot is accepted |
|
|
L + Kσ ≤ |
Lot is refused |
|
|
|
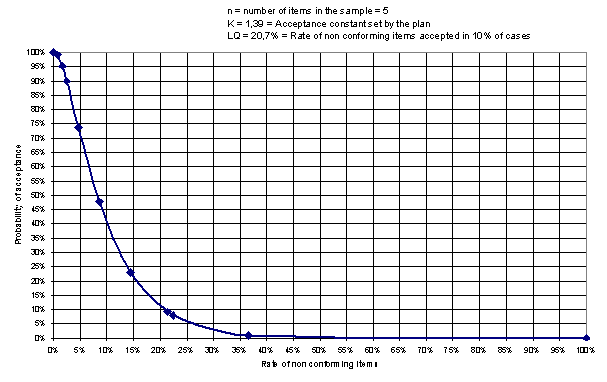
EXAMPLE : inspection of the maximum sodium content U of a lot of dietary cheese low in sodium for which the maximum sodium content is set by the Codex standard 53-1981 at 120 milligrams per 100 grams of commodity.
Inspected value U = 120 milligrams of sodium per 100 grams of dietary cheese
Data of the chosen sampling plan, from the Standard ISO 3951 (see Table 19):
- n = 5, number of items in the sample;
- K = 1,39, acceptance constant;
- AQL = 2,5 %.
- σ = 3,5 mg, the known standard deviation according to experimental data on an extended period of production, made available to the inspectors by the professionals.
Results of measurements:
• x1 denotes the sodium content measured in the first item, = 118 mg ;
• x2 denotes the sodium content measured in the second item, = 123 mg ;
• x3 denotes the sodium content measured in the third item, = 117 mg ;
• x4 denotes the sodium content measured in the fourth item, = 121 mg ;
• x5 denotes the sodium content measured in the fifth item, = 111 mg ;
• ![]() denotes the mean of the sodium contents obtained on the sample of five items
denotes the mean of the sodium contents obtained on the sample of five items![]()
= ![]() = 118 mg
= 118 mg
• Conclusion: knowing that U - Kσ = 120 – (1,39 x 3,5) = 115,1 mg, then ![]()
> U - Kσ and the lot is rejected.
• The operating characteristic curve of the plan by variables is given in the figure 2.
Figure 2: OC curve, single sampling plan by variable, known standard deviation
When the standard deviation ![]() of the distribution of values is unknown (for example in the case of inspections made by official inspection departments which, owing to the insufficient number of inspections they make, do not know the standard-deviation sufficiently precisely to consider it as known), the method is called the s-method, since the standard deviation
of the distribution of values is unknown (for example in the case of inspections made by official inspection departments which, owing to the insufficient number of inspections they make, do not know the standard-deviation sufficiently precisely to consider it as known), the method is called the s-method, since the standard deviation ![]() is estimated by
is estimated by
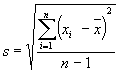
s =  , called the standard deviation estimator (see 2.2.20).
In this case, the distribution of means calculated on the sample follows a Student distribution with n-1 degrees of freedom. The following table 4 defines the acceptance/rejection rules of the lots.
Table 4: Lot acceptance/rejection criteria for s-method
Inspection of a minimum value L
|
Inspection of a maximum value U
|
Inspection of a range of values between L and U
| |
Lot is accepted |
|
|
L + Ks ≤ |
Lot is refused |
|
|
|
EXAMPLE : inspection of the maximum sodium content U of a lot of dietary cheese low in sodium for which the maximum sodium content is set by the Codex standard 53-1981 at 120 milligrams per 100 grams of commodity
Inspected value U = 120 milligrams of sodium per 100 grams of dietary cheese
Data of the chosen sampling plan, from the Standard ISO 3951 (see Table 16):
- n = 5, number of items in the sample;
- K = 1,24, acceptance constant;
- AQL = 2,5 %.
Results of measurements12 :
• x1 denotes the sodium content measured in the first item, = 118 mg ;
• x2 denotes the sodium content measured in the second item, = 123 mg ;
• x3 denotes the sodium content measured in the third item, = 117 mg ;
• x4 denotes the sodium content measured in the fourth item, = 121 mg ;
• x5 denotes the sodium content measured in the fifth item, = 111 mg ;
• ![]() denotes the mean of the sodium contents obtained on the sample of five items
denotes the mean of the sodium contents obtained on the sample of five items![]()
= ![]() = 118 mg
= 118 mg
• s denotes the standard deviation estimator calculated on the sample :
s = = 4,6 mg
Conclusion: knowing that U - Ks = 120 – (1,24 x 4,6) = 114,3 mg, then ![]() > U - Ks and the lot is rejected (see Table 3).
> U - Ks and the lot is rejected (see Table 3).
In most cases, the s-method is used, because the standard deviation is not known. In the cases of well-known and well-controlled processes, the σ-method can be used (see 2.5.1.2.2).
The difference between the two methods comes from the value of LQ (defective rate in the lots accepted in 10 % of cases), see examples of 2.5.1.2.2 and 2.5.1.2.3. In these examples:
σ-method : the LQ is 20,7 %, consequence of the characteristics of the plan (AQL = 2,5 %,
n = 5, K = 1,39).
s-method : the LQ is 35 %, consequence of the characteristics of the plan (AQL = 2,5 %,
n = 5, K = 1,24).
The following Table 5 and Figure 3 compare the efficiency of these 2 plans and show that the
σ-method is more efficient that the s-method, since for the same number of items in the sample, the σ-method provides greater discrimination between good and poor quality products, ie the OC curve decreases more steeply.
Figure 3: Comparison of OC curves of variable sampling plans : s-method and σ-method, same AQL (2,5 %) and same sample sample size (5 items)*
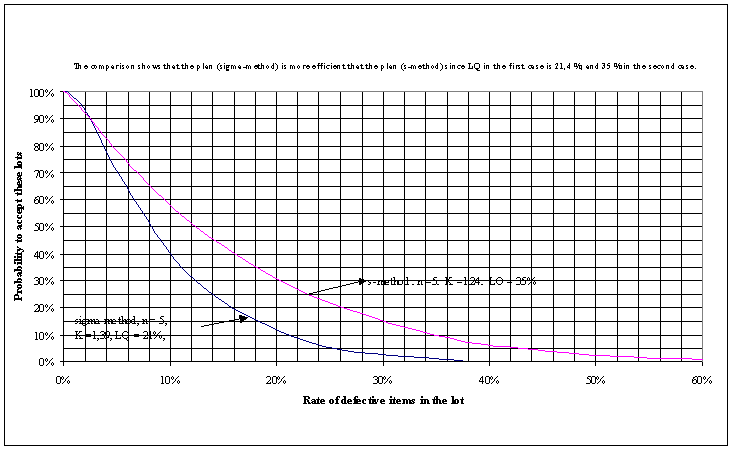
Table 5: Probability of lot acceptance by defective rates and sampling method (s-method, σ-method)
|
Defective rates in the lots |
Probability of lot acceptance | |
|
|
s-method | |
0% |
100% |
100% |
0,4% |
99,8% |
99% |
1,38% |
96,5% |
95% |
2,48% |
90% |
90% |
5,78% |
65,9% |
75% |
12,47% |
29,7% |
50% |
22,88% |
7,4% |
25% |
34,98% |
1,2% |
10% |
42,97% |
0,3% |
5% |
58,11% |
0% |
1% |
100% |
0% |
0% |
When the controlled characteristic is quantitative and normally distributed (example: control of sodium content in a dietary cheese), it is possible to use either an attribute or a variable sampling plan. Since the efficacy of an attribute sampling plan is lower (see below), it is preferable in this case to choose a variable sampling plan (see 2.5.1.4).
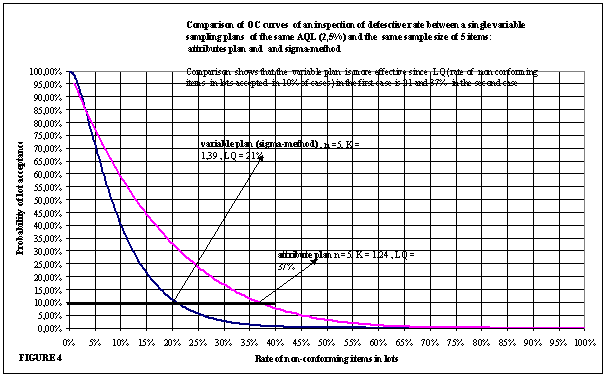
The following Figure 4 which compares the efficacy of a variable plan (σ-method) and an attribute plan, of the same AQL 2,5% and having a sample size of five items, shows that the variable plan is more effective than the attribute plan since the limiting quality of lots accepted in 10% of cases is lower with variables plans (21,4 %) than with attributes plans (36,9 %).
Figure 4: Comparison of OC curves of a variable and an attribute sampling plans
2.5.1.4 Decision tree for the selection of an attributes or a variables sampling plan
The selection of an attribute or a variable sampling plan should be made according to the following decision tree:
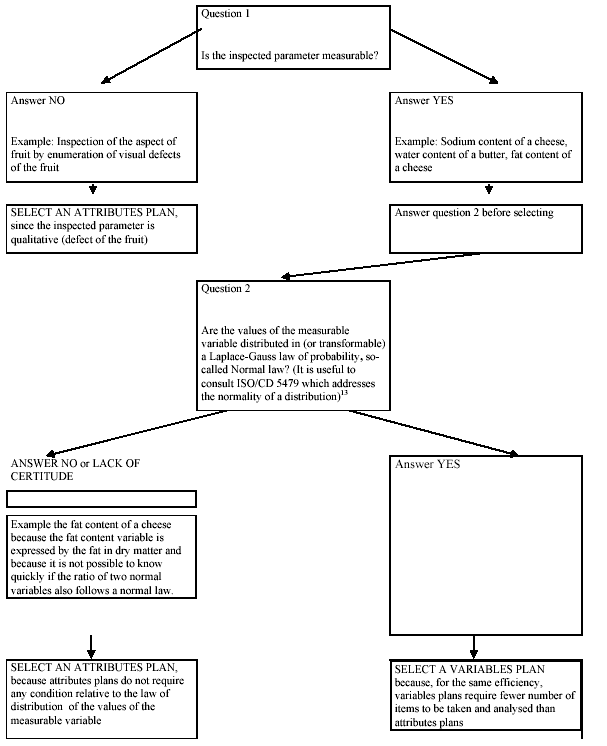
When it is possible to implement either an attributes plan or a variables plan, for example for the inspection of the sodium content of a dietary cheese, the selection must be made after having consulted in particular the following Table 6 on the comparative advantages and disadvantages of the plans14.
Table 6: Comparison of attribute and variable sampling plans
ADVANTAGES |
DISADVANTAGES | |
ATTRIBUTES PLANS |
No condition on the mathematical law of distribution of the variable inspected Greater simplicity of processing the results on the sample |
Less effective than variables plans for a same sample size of n increments (the LQ is higher);
|
VARIABLES PLANS |
More effective than attributes plans for the same sample size of n increments (the LQ is lower); for the same AQL they are less expensive than attributes plans because the sample collected requires fewer increments than those required, for a same efficacy, by attributes plans |
They cannot be used in all cases because to validate the calculation formulas the mathematical law of distribution of the inspected variable must necessarily follow or approximately follow a normal law |
The sample sizes required when inspecting by attributes and variables are compared in the following table 7:
Table 7: Comparison of sample sizes for attribute and variable sampling plans (normal inspection level) by Sample Size and Code Letter
Sample size code lettera |
Sample sizes | |
Inspection by attributes |
Inspection by variables | |
C |
5 |
4 |
F |
20 |
10 |
H |
50 |
20 |
K |
125 |
50 |
N |
500 |
150 |
a) From Table 1 in ISO TR 8550, the code letter gives the combinations of lot size and of "inspection levels" (section 2.2.12) | ||
Attributes plans are more robust than variables methods (not subject to assumptions of distributional shape) and are simpler to operate. Sampling by attributes is recommended when evaluating isolated lots. If necessary, measurements (variables) may be converted to attributes, in order to facilitate attribute sampling.
The variables method requires a smaller sample size than the attributes method to attain a given degree of protection against incorrect decisions - an important consideration when the sampling is destructive. However, since each quality characteristic has to be considered separately, the variables method becomes less suitable as the number of measurements to be made on a single item increases.
2.5.2 Zero Acceptance Number Sampling Plans
(see the Standard ISO/DIS 14 560)
This standard addresses the need for sampling plans, based upon a zero acceptance number, which address quality (non-conformance) levels in the parts per million (ppm or mg/kg) range within isolated lots. The standard does not address minor nonconformities.
Zero acceptance sampling plans in ISO/DIS 14 560 are applicable, but not limited, to inspection of (a) end items and (b) components and raw material. The selection of the appropriate plan depends upon the amount of consumer protection desired for a selected PPM level of desired product quality, and the size of the lot.
2.5.3 Sampling plans for inspection of critical nonconformities
Critical nonconformities render the items hazardous, or potentially hazardous, and can result in illness or death.
The following procedure may be used to establish the appropriate sample size (see ISO 2859-0):
a simple formula is used which relates :
(a) the maximum number d of critical nonconformities/nonconforming items admitted in the lot;
(b) N the lot size;
(c) n the sample size;
(d) the risk β one is prepared to take of failing to find a nonconformity/nonconforming item, ie the probability of non detecting at least one critical nonconformity (it is usual to choose β less than or equal to 0,1 %);
(e) the probability p of maximum nonconforming items admitted in the inspected lot (p is usually taken less than or equal to 0,2 %)
p = d/N, d = Np rounded down to the nearest integer;
• the sample size n is obtained from the following equation (by rounding-up to the nearest integer):
n = (N - d/2) (1 - β1/(d + 1))
• the lot is accepted if no critical nonconformities are found in the sample.
EXAMPLE : Detection of defective sealed cans
Determination of sample size for the inspection of critical non confirming items (defective sealed cans) in a lot of N = 3454 cans where:
p, the maximum percentage of nonconforming critical items, is 0,2%
the maximum accepted risk β of accepting of non detecting a nonconforming item is 0,1%
c, the acceptance criterion of the lot, is 0 (no nonconforming item in the sample)
Re, the rejection criterion of the lot; is 1 (at least 1 nonconforming item in the sample).
Calculation of d: d = Np = 3454 x 0,002 = 6,908, rounded down to the nearest integer = 6
Calculation of n: n = (N - d/2) (1 - β1/(d + 1)) = 2165.
This very high value shows the great practical difficulty in using a procedure that involves destructive testing when p and β are small. The cost of such control will be high. However, it illustrates the value of applying simple non destructive, yet informative tests to every item in a lot, for example, observing whether the ends of cans are depressed, indicating a presence of an effective hermetic seal.
The attention of users is drawn upon the relation between the efficiency and the size of the sample. For a given Acceptable Quality Level (AQL), the smaller the sample size, the smaller the cost of sampling, but the worse the efficiency, that is the risk to wrongly accepting a lot increases and worsens the damage in trade (in particular large financial losses for the producer if a lot is discovered as non-compliant).
As an example, for the attributes sampling plans proposed in 4.2.2.3 (Table 13, AQL = 6,5 %) the consumers’ risk (P10) increases from 40,6 % (n = 8) to 68,4 % (n = 2).
The attention of users is also drawn upon the relation between the efficiency and the AQL. For a given sample size, the lower the AQL, the better the efficiency.
As an example, for a sample of 20 items, between the attribute sampling plans proposed in clause 4.2.2.1 (Table 11, AQL = 0,65 %) and in clause 4.2.2.3 (Table 13, AQL = 6,5 %), the consumers’ risk (P10) increases from 10,9 % to 30,4 %.
Thus for a given sample size, fixed by requirements due to the cost of analysis, the improvement of the efficiency of sampling plans requires the choice of plans corresponding to low AQL values, depending on the products.
Another possible solution for reducing the costs of sampling is to use sequential or multiple sampling plans which allows, with reduced sample size, the elimination of the lots of very low quality. These plans are out of the scope of these guidelines (see relevant ISO Standards).
This section presents the rationale for selecting sampling plans by attributes for single or isolated lots moving in international trade. It lays down rules for:
• inspection by attributes indexed by the limiting quality (LQ) level (section 3.1)
• inspection by two or three class attributes for microbiological assessments (section 3.2)
(see ISO 2859/2-1985 (E))
Preliminary note15 : Given the requirements due to probabilities linked to sampling by attributes, the plans of this section enable a rational choice between the existing plans referring to AQL, as defined in Section 4.2. In order to ensure their compatibility, similar rules for acceptance/rejection, as well as categories of lot size have been chosen for this section and for section 4.2.
This ISO Standard provides sampling plans for application to single lots (procedure A, 3.1.1) or to lots isolated from a series (procedure B, 3.1.2) where the ‘switching rules’ (see Section 2.2.16) are precluded. Both procedures use the limiting quality (LQ; Section 2.2.5) as an indicator of the actual percentage nonconforming in the lots submitted. The associated Consumer’s Risk (the probability of accepting a lot with the limiting quality level) is usually less than 10 per cent, but always below 13 per cent.
Procedure A is used when both the producer and consumer wish to regard the lot in isolation; and it is also used as the default procedure (i.e., it is used unless there is a specific instruction to use procedure B). Procedure A includes plans with acceptance number zero, and with sample sizes based upon the hypergeometric distribution of sampling results. Procedure B is used when the producer regards the lot as one of a continuing series, but the consumer considers the lot in isolation. This approach allows the producer to maintain consistent production procedures for a variety of consumers whilst any individual consumer is concerned with only one particular lot. Procedure B excludes plans with zero acceptance numbers, replacing them with one hundred percent evaluation.
Procedures A and B may be compared as follows:
Procedure A (default procedure) |
Procedure B |
Producer & consumer regard lot in isolation |
Producer regards lot as one of continuing series |
Identified by lot size and LQ |
Identified by lot size, LQ & inspection level |
Includes plans with an acceptance number of zero |
Plans with an acceptance number of zero not included |
Double & multiple plans can be used as alternatives to zero acceptance number plans |
Double & multiple plans can be used as alternatives to single sampling plans |
The application of procedure A may be illustrated as follows:
Summary of sampling plan
Set LQ
ê
Select sample size (n) & acceptance number (c) (Table A in ISO 2859/2-1985 (E))
and collect sample
ê
Inspect each item in the sample
ê
Accept the lot if: number of nonconforming items ≤ c
The application of procedure B may be summarised as follows:
Summary of sampling plans
Set LQ
ê
Select inspection level
(Table I in ISO 2859-1 : 1989 (E) and Table B6 in ISO 2859/2-1985(E))
ê
Select sample size, n & acceptance number, c (Tables B1-B10, ISO 2859/2-1985(E))
and collect sample
ê
Inspect each item in the sample
ê
Accept the lot if: number of nonconforming items ≤ c
3.2.1 Two-class Attributes Plans
Two-class attributes plans provide a simple means of inspection where the sampling plan is defined by two values, n and c. The value of n defines the sample size in terms of the number of items; and the value c denotes the maximum number of nonconforming items permitted in the sample. When undertaking a microbiological assessment, a maximum concentration of micro-organisms permitted in any item is denoted by m; any item contaminated at a concentration greater than m is considered to be nonconforming.
For a given value of c, the stringency (probability of rejection) of the plan will increase as n increases. Similarly, for a given value of n, the stringency will increase as c decreases. The equation of the OC of such plans is the following :
PA = P [x ![]() c] =
c] = ![]()
Where :
PA = Probability to accept the lot
p = Defective rate in the lot, ie lots for whose the concentration of micro-organisms is greater than m
i and x are whole discrete variables, varying between 0 and c
![]()
The application of a two-class attributes plan can be summarized as follows :
Set the value of m, n and c
ê
Collect the sample with n items
ê
Inspect each item in the sample
ê
Accept the lot if: number of defective items ≤ c
EXAMPLE : Inspection of the presence of Salmonella in fresh vegetables
- Description of an ICMSF plan :
n = 5 = number of items of 25 g in the sample
m = maximum content admitted in Salmonella per item = 0 CFU in 25 g
c = 0 = maximum number of items of the sample where the concentration x in Salmonella is higher than m (ie Salmonella is detected).
The lot is accepted if no item in the sample shows a presence of Salmonella. The lot is rejected in the opposite case.
- Result of the inspection :
The results of the detections in the sample are the following:
x1 = Salmonella detected
x2 = 0
x3 = 0
x4 = 0
x5 = 0
There is one item where Salmonella was detected (ie whose concentration in Salmonella is greater than m), the lot is therefore rejected.
3.2.2 Three-class Attributes Plans16
Three class attributes plans are defined by the values n, c, m and M (see below); and are applied to situations where the quality of the product can be divided into three attribute classes depending upon the concentration of micro-organisms within the sample:
• unacceptable quality, with a concentration of micro-organisms above the value, M (which must not be exceeded by any items in the sample).
• good quality, where the concentration must not exceed the value, m.
• marginally acceptable quality. Marginal items have a concentration which exceeds m, but which is less than M ( such concentrations are undesirable but some can be accepted, the maximum number acceptable being denoted by c).
The value m is the concentration of the micro-organism which is acceptable and attainable in the food under inspection, as reflected by Good Commercial Practice (GCP). For 3-class plans, m will be assigned a non-zero value.
The value M is a hazardous or unacceptable level of contamination caused by poor hygienic practice, including improper storage. There are several approaches to choosing the value of M:
(i) as a ‘utility’ (spoilage or shelf-life) index, relating levels of contamination to detectable spoilage (odour, flavour) or to an unacceptably short shelf-life;
(ii) as a general hygiene indicator, relating levels of the indicator contaminant to a clearly unacceptable condition of hygiene;
(iii) as a health hazard, relating contamination levels to illness. A variety of data may be used for this purpose including, for example, epidemiological, experimental animal feeding and human feeding data.
The values m and M may be independent of each other.
The choice of values for n and c varies with the desired stringency (probability of rejection). For stringent ‘cases’, n is high and c is low; for lenient ‘cases’ n is low and c is high. The choice of n is usually a compromise between what is an ideal probability of assurance of consumer safety and the work load the laboratory can handle.
If the concentration of micro-organisms in any item of the sample is greater than M, the lot is directly rejected.
The equation of the OC curve of such plans is the following :
![]()
where :
Pa is the probability of acceptance of a lot containing:
- a given percentage of defective items (Pd ) (a defective item having a concentration in micro-organisms greater than M), i.e. lots for whose the concentration in micro-organisms is greater than M), and
- a given percentage of marginally acceptable items (Pm) (a marginally acceptable item having a concentration in micro-organisms between m and M) ;
n is the number of items in the sample
c is the maximum number allowed of marginal items.
The application of a three-class attributes sampling plan may be summarized as follows :
Set the values of m, M, n ,c
ê
Collect the sample with n items
ê
Inspect each item in the sample
ê
Accept the lot if: number of marginally defective items (i.e. a concentration of micro-organisms between m and M) ≤ c
Immediately reject the lot if the concentration of micro-organisms in any item > M and/or the number of marginally defective items > c.
EXAMPLE : Inspection of the concentration of mesophilic aerobic micro-organisms in fresh vegetable
- Description of an ICSMF plan :
n = 5 = the number of items in the sample
m = 106 CFU/g
M = 5 107 CFU/g
c = 2 = the maximum number allowed of items in the sample whose concentration in mesophilic aerobic micro-organisms lies between m and M
The lot is accepted if no item shows a concentration greater than M and if the maximum number of items in the sample whose concentration lies between m and M, is at most egal to c.
- Result of the inspection
The measures of concentration in the sample are the following :
x1 = 2. 107
x2 = 2.106
x3 = 2. 107
x4 = 2.106
x5 = 2.106
There are 5 items of the sample whose concentration in mesophilic aerobic micro-organisms lies between m and M, this figure is greater than c and the lot is rejected.
The Application of Two and Three-class Attributes Plans
Two and three-class attributes plans are ideally suited for regulatory, port-of-entry, and other consumer-oriented situations where little information is available concerning the microbiological history of the lot. The plans are independent of lot size if the lot is large in comparison to sample size. The relationship between sample size and lot size only becomes significant when the sample size approaches one tenth of the lot size, a situation rarely occurring in the bacteriological inspection of foods.
When choosing a plan one must consider: (i) the type and seriousness of hazards implied by the micro-organisms; and (ii) the conditions under which the food is expected to be handled and consumed after sampling. Table 8 (after Table 10 of the ICMSF publication) classifies 15 different ‘cases’ of sampling plans taking these factors into consideration, the stringency of the plans increasing with the type and degree of hazard. Case 1 requires the most lenient plan whereas Case 15 represents the most stringent requirement. In Table 8, a sampling plan is recommended for each of the 15 ‘cases’.
Table 8: Classification of sampling plans according to nature of concern and hazard
Nature of concern |
Decreased
|
Unchanged hazard |
Increased hazard |
No direct health hazard (spoilage and shelf-life) |
n = 5, c= 3 |
n = 5, c = 2 |
n = 5, c = 1 |
Low indirect health hazard (indicator organisms) |
n = 5, c= 3 |
n = 5, c = 2 |
n = 5, c = 1 |
Moderate direct health hazard (limited spread) |
n = 5, c= 2 |
n = 5, c = 1 |
n = 10, c = 1 |
Moderate direct health hazard of potentially extensive spread in food |
n = 5, c= 0 |
n = 10, c = 0 |
n = 20, c = 0 |
Severe direct health hazard |
n = 15, c= 0 |
n = 30, c = 0 |
n = 60, c = 0 |
EXAMPLES :
(i) A sampling plan is required for the inspection of fresh or frozen fish for the bacterium Escherichia coli. The contamination of fish with E. coli is considered (1) to be a low indirect health hazard which is likely to be reduced during the handling of the fish. Normally the fish will be cooked before consumption. Consequently, the contamination of fish with E. coli may be classified as Case 4 in Table 10 and the recommended sampling plan is a 3-class attributes plan, where n = 5 and c = 3. (The values of m and M will also be specified.)
(ii) The contamination of cooked crabmeat with Staphylococcus aureus is considered (1) to be a moderate direct health hazard of limited spread which is likely to increase with handling (Case 9). Consequently, the appropriate sampling plan for the inspection of S. aureus in cooked crabmeat is a 3-class plan where n = 10 and c = 1. (The values of m and M will also be specified.)
(iii) The contamination of frozen, ready-to-eat, bakery products (with low-acid or high water activity fillings or toppings) with Salmonella is considered to be a moderate direct health hazard of potentially extensive spread in food which is likely to increase with handling (Case 12). In this example, the appropriate plan is a 2-class plan where n = 20 and c = 0.
Such a control is performed by using a test which aims at ensuring that, on average, the content of the controlled characteristic is at least equal to either the quantity given of the label of the product, or the quantity fixed by the regulation or a code of practice (e.g. net weight, net volume,…).
Description of the test
n is the sample size, in number of items, used for the test

is the sample mean of the n items in the sample
is the standard deviation of the values of the items in the sample.
α is the significance level of the test, that is the probability of wrongly concluding that the mean content of the controlled chacteristic is less than the stated value when it is indeed greater than or equal to that value.
tα is the value of the Student’s t-distribution, on n-1 degrees of freedom, corresponding to the significance level α17.
M is the stated value for the mean of the lot.
Decision Rules
The lot is accepted if:
The following Table provides t-values of the Student’s distribution for some selected sample sizes and for α of 5 % and 0,5 %.
Number of Samples |
t-value
|
t-value
|
5 |
2,13 |
4,60 |
10 |
1,83 |
3,25 |
15 |
1,76 |
2,98 |
20 |
1,73 |
2,86 |
25 |
1,71 |
2,80 |
30 |
1,70 |
2,76 |
35 |
1,69 |
2,73 |
40 |
1,68 |
2,71 |
45 |
1,68 |
2,69 |
50 |
1,68 |
2,68 |
Normally, the sampling plans described in Sections 4.2 and 4.3 should only be applied to a continuous series of lots from a single source. However, the plans described below (including the switching rules) may be utilised when data have been collected describing the quality of isolated lots, from a single source, over a prolonged period of time.
This section addresses the selection of single sampling plans for inspection of percent nonconforming, for a continuing series of lots coming from a single source.
It recommends single sampling plans by attributes (section 4.2) and by variables (section 4.3)18 with their characteristics:
• Number of items in the sample,
• Acceptable Quality Level (AQL),
• for attributes plans: acceptance number c, i.e. the maximum number of nonconforming items in the sample,
• for variables plans, the acceptance constant K to be included in the lot acceptance formula,
• operating characteristic curves.
To make the document readily readable, and to achieve minimum difficulty in implementing the plans and minimum inspection cost, these plans are limited to the following characteristics:
• AQL 0.65%,. 2.5%, , 6.5%
• n, number of items in the sample, included between 2 and 50
• P10 = Rate of non-conforming items in lots accepted in 10% of cases = LQ
• P50 = Rate of non-conforming items in lots accepted in 50% of cases
• P95 = Rate of non-conforming items in lots accepted in 95% of cases
Codex Committees and, where applicable, governments, will select from these plans on the basis of the quality aim they set themselves. This quality level is stated by the Acceptable Quality Level.
The lowest level of acceptable quality or LQ derives from the characteristics of the choice of n and of AQL.
Each single sampling plan recommended in section 4 is accompanied by a table giving the plan characteristics (AQL, n = sample size, : c = acceptance number of the lot, in the case of plans by attributes, K = acceptance constant, in the case of plans by variables) and the probability of lot acceptance as a function of the rate of nonconforming items in these lots, particularly the LQ or rate of nonconforming items in lots accepted in 10% of cases. All the plans recommended according to the AQL and the size n of the sample, are also grouped per AQL in a graph like the Figure 5, of the Operating Characteristic (OC) curve, which relates the rate of nonconforming items in an inspected lot and the probability of lot acceptance.
The following example illustrates this principle of presentation of recommended plans with tables (Table 9) and graphs (Figure 5) of OC curves for simple sampling plans by attributes, of AQL = 6,5 %, n= 2, c = 0 and n = 50, c = 7.
Table 9: Probability of lot acceptance, attribute sampling plan, AQL = 6,5 %
Defective rates in the lots |
Probability of lot acceptance | |||||
n = 2, c = 0
|
n = 8, c= 1
|
n = 13, c= 2 P95 = 6,63%
|
n = 20, c= 3 P95 = 7,13%
|
n = 32, c= 5 P95 = 8,5%
|
n = 50, c= 7 P95 =8,2%
| |
0% |
100% |
100% |
100% |
100% |
100% |
100% |
5 % |
90,3% |
94,3% |
97,5% |
98,4% |
99 % |
99,7% |
6,5% |
87,4% |
90,9% |
95,2% |
96,3% |
98,4% |
98,5% |
10 % |
81% |
81,3% |
86,6% |
86,7% |
90,6% |
87,8% |
20% |
64% |
50% |
50% |
41,1% |
36% |
19% |
30 % |
49% |
25,5% |
20,2% |
10,7% |
5,1% |
0,7% |
40% |
36% |
10,6% |
5,8% |
1,6% |
0,3% |
0% |
50% |
25% |
3,5% |
1,1% |
0,1% |
0% |
0% |
60 % |
16% |
0,9% |
0,1% |
0% |
0% |
0% |
80% |
4,0% |
0% |
0% |
0% |
0% |
0% |
90% |
1% |
0% |
0% |
0% |
0% |
0% |
100% |
0% |
0% |
0% |
0% |
0% |
0% |
Figure 5 gathers the OC curves of these plans by attributes, fixed by the Standard ISO 2859-1.
The curve of Figure 5, which contains the point A, corresponds to a lot inspected with a 50-item sample. The lot is accepted at inspection if there are less than 7 defective items in the sample. The abscissa of the point A (15 %) corresponds to a lot containing 15 % of defective items; its ordinate (50 %) corresponds to the probability to accept these lots containing 15 % of defective items.
The curve of Figure 5, which contains the point B, corresponds to a lot inspected with a 2-item sample. The lot is accepted at inspection if there are less than 0 defective items in the sample. The abscissa of the point B (30 %) corresponds to a lot containing 30 % of defective items; its ordinate (50 %) corresponds to the probability to accept these lots containing 30 % of defective items.
The graph shows that, for a constant AQL, the higher the sample size, the smaller the risk to the consumer of accepting lots with high defective rates.
Figure 5: OC curve, attribute sampling plan, AQL = 6,5 %
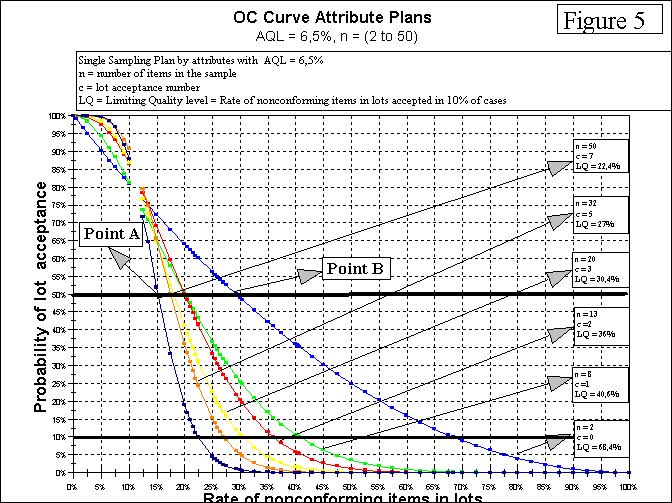 Rate of nonconforming items in lots
Examples of sampling plans covering frequent inspection situations using AQL = 0,65 % or 2,5 % or 6,5 % are presented in 4.2.2.1 to 4.2.2.3.
4.2.1 General
The principle of such sampling plans is presented in Section 2.5.1.1.
The application of ISO 2859-1 attributes sampling plans may be summarised as follows:
Set inspection level
(normal19, tightened, reduced)
ê
Set the AQL
ê
Select sample size, n of the sample and the acceptance number, c and collect the sample
ê
Inspect each item in the sample and enumerate each nonconforming item in the sample
ê
Accept the lot if this number of nonconforming items ≤ c
This document recommends the following simple sampling plans, for covering frequent inspection situations. They are extracted from the Standard ISO 2859-1, and are characterised by their AQL (AQL of 0,65 %, 2,5 % and 6,5 % covering the most frequent cases), the size n of items in the sample and c the acceptance criterion which defines the maximum number of defective items allowed in the sample for accepting the lot. Each plan is accompanied by a table which gives the probability to accept the lots in function of the defective rate in these lots. For each AQL, a graph shows the OC curves of the corresponding recommended plans.
The OC curves have been built point-by-point from the following equation :
PA = P [x ![]() c] =
c] = ![]()
Where :
PA = probability to accept the lot
p = defective rate in the lot
i and x are discrete whole variables, between 0 and c
![]()
Table 10 (from NMKL Procedure N° 12, see reference 5) describes the number of items to be sampled at different inspection levels, lot sizes and acceptance numbers at AQL of 0,65%, 2,5% and 6,5% respectively. The table is a simplification of a single attribute sampling plan from ISO 2859-1. This table considers three levels of inspection: tightened, normal and reduced (see 2.2.16).
Table 10. Attribute Sampling Plan
Inspection level | ||||
Lot size (Number of items) |
Reduced |
Normal |
Tightened | |
2-8 |
n
|
2
|
2
|
3
|
9-15 |
n
|
2
|
3
|
5
|
16-25 |
n
|
2
|
5
|
8
|
26-50 |
n
|
2
|
8
|
13
|
51 - 90 |
n
|
2
|
13
|
20
|
91 - 150 |
n
|
3
|
20
|
32
|
151 - 280 |
n
|
5
|
32
|
50
|
281 - 500 |
n
|
8
|
50
|
80
|
501 - 1 200 |
n
|
13
|
80
|
125
|
1 201 – 1 320 |
n
|
20
|
125
|
200
|
1 321 – 10 000 |
n
|
32
|
200
|
315
|
10 001 – 35 000 |
n
|
50
|
315
|
500
|
35 001 - 150 000 |
n
|
80
|
500
|
800
|
150 001 -
|
n
|
125
|
800
|
1 250
|
500 001 and over |
n
|
200
|
1 250
|
2 000
|
Table 11: Probability of lot acceptance, attribute sampling plans, AQL = 0,65 %
|
Defective rates in the lots |
Probability of lot acceptance
|
0% |
100% |
0,05% |
99% |
0,25% |
95% |
0,525% |
90% |
0,65% |
87,8% |
1,43% |
75% |
3,41% |
50% |
5% |
35,8% |
6,7% |
25% |
10% |
12,2% |
10,9% |
10% |
13,9% |
5% |
15% |
3,9% |
20% |
1,2% |
20,6% |
1% |
30% |
0,1% |
35% |
0% |
100% |
0% |
Figure 6: OC curve, attribute sampling plan, AQL = 0,65 %
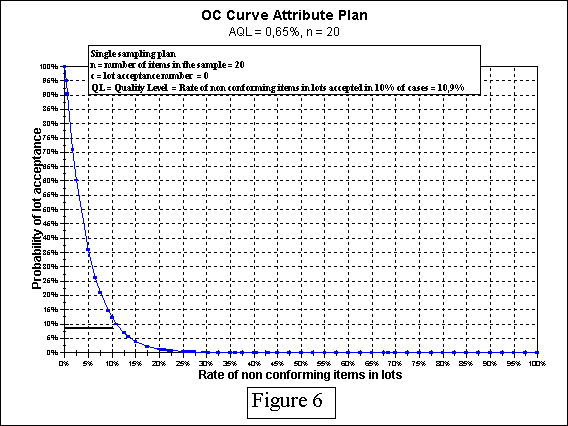
Table 12: Lot acceptance probability for AQL = 2,5 %
Defective rates in the lots |
Probability of lot acceptance
| |||
Letter-code C,
|
Letter-code F,
|
Letter-code G,
|
Letter-code H,
| |
0% |
100% |
100% |
100% |
100% |
1% |
95% |
98,3% |
99,6% |
99,8% |
2,5% |
88,1% |
91,2% |
95,5% |
96,4% |
5% |
77,4% |
73,6% |
78,6% |
76% |
10% |
59% |
39,2% |
36,7% |
25% |
15% |
44,4% |
17,6% |
12,2% |
4,6% |
20% |
32,8% |
6,9% |
3,2% |
0,6% |
30% |
16,8% |
0,8% |
0,1% |
0% |
40% |
7,8% |
0,1% |
0% |
0% |
50% |
3,1% |
0% |
0% |
0% |
²100% |
0% |
0% |
0% |
0% |
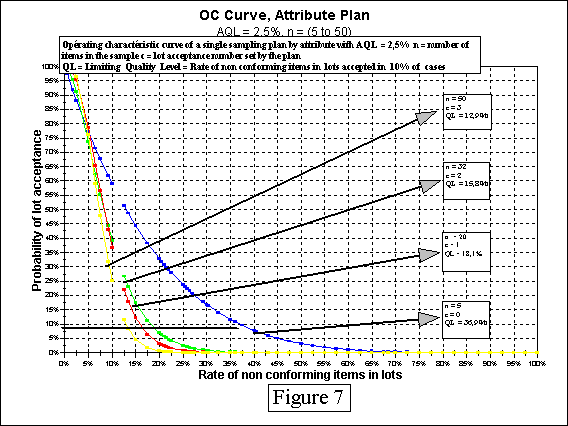
Figure 7: OC curve, attribute sampling plan, AQL = 2,5 %
Table 13: Probability of lot acceptance at AQL = 6,5 %
Defective rates in the lots |
Probability of lot acceptance
| |||||
Letter-code A,
|
Letter-code D,
|
Letter-code E,
|
Letter-code F,
|
Letter-code G,
|
Letter-code H,
| |
0% |
100% |
100% |
100% |
100% |
100% |
100% |
5 % |
90,3% |
94,3% |
97,5% |
98,4% |
99,1% |
99,7% |
6,5% |
87,4% |
90,9% |
95,2% |
96,3% |
98,4% |
98,5% |
10 % |
81% |
81,3% |
86,6% |
86,7% |
90,6% |
87,8% |
20% |
64% |
50% |
50% |
41,1% |
36% |
19% |
30 % |
49% |
25,5% |
20,2% |
10,7% |
5,1% |
0,7% |
40% |
36% |
10,6% |
5,8% |
1,6% |
0,3% |
0% |
50% |
25% |
3,5% |
1,1% |
0,1% |
0% |
0% |
60 % |
16% |
0,9% |
0,1% |
0% |
0% |
0% |
80% |
4,0% |
0% |
0% |
0% |
0% |
0% |
90% |
1% |
0% |
0% |
0% |
0% |
0% |
100% |
0% |
0% |
0% |
0% |
0% |
0% |
Figure 8: OC curve, attribute sampling plan, AQL = 6,5 %
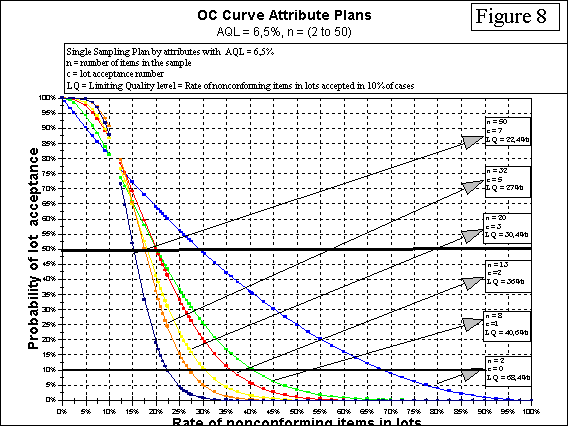
Tightened Inspection
When normal inspection is being performed, tightened inspection must be introduced when two out of five, or less, consecutive lots have been non-acceptable on original inspection (ignoring resubmitted lots). Normal inspection can only be restored when five successive lots have been accepted under tightened inspection.
When operating under tightened inspection, an appropriate sampling plan is selected using the procedure described in Section 4.1, excepting that Table II-B in ISO 2859-1: 1989 (E) is used for the selection of n and Ac. In general, a tightened plan has the same sample size as the corresponding normal plan but a smaller acceptance number. However, if the normal inspection acceptance number is 1 or 0, tightening is achieved by retaining the acceptance number whilst increasing the sample size.
Reduced Inspection
When normal inspection is being performed, reduced inspection may be operated provided that each of the following conditions is satisfied:
(a) the preceding 10 lots (or more) have been subjected to normal inspection and all have been accepted on original inspection; and
(b) the total number of nonconforming units (or nonconformities) in the samples from the preceding 10 lots (or such other number as was used for condition (a), above) is equal to or less than the appropriate ‘limit number’ given in Table VIII in ISO 2859-1: 1989 (E); and
(c) production is at a ‘steady state’ (ie there has not been a break in production sufficient to invalidate the argument that the present quality is good because the record of the recent past is good, and that all factors which are likely to effect the quality of the product have remained consistent); and
(d) reduced inspection is considered desirable by the responsible authority.
In these circumstances, the inspection costs may be reduced by using reduced-inspection sampling plans which, typically, have sample sizes only two-fifths the size of the corresponding normal inspection plans. When operating under reduced inspection, an appropriate sampling plan is selected using the procedure described in Section 4.1, excepting that Table II-C in ISO 2859-1: 1989 (E)is used for the selection of n and Ac.
Normal inspection should be reverted to if a lot is not accepted on reduced inspection; or if production becomes irregular or delayed; or if other conditions occur which are likely to invalidate the steady-state condition.
Discontinuation of Inspection
Once tightened inspection has been introduced, the acceptance procedures of ISO 2859 should be discontinued if five, or more, lots are not accepted and all products from that source must be rejected. Importation and inspection should not resume until the responsible authority is satisfied that the producer has taken the necessary action to improve the quality of the submitted product. Tightened inspection should then be used as described above.
(see ISO 3951: 1989 (E))
The principle of such sampling plans is presented in Section 2.5.1.2.
The application of ISO 3951 variables sampling plans may be summarised as follows:
Select the ‘s’ method (standard deviation unknown) or
the ‘σ‘ method (standard deviation is stable and known)
ê
Set inspection level
(normal, tightened, reduced)
ê
Set the AQL
ê
Select sample size (n) & acceptability constant (k) and collect sample
ê
Measure the characteristic x in each item in the sample
(a) calculate the sample mean, ![]() , and
, and
(b) calculate the estimated standard deviation, s =
(c) see Table 4.
(This method should only be used when there is valid evidence that the standard deviation of the process can be considered constant and taken to be ‘σ‘. In this case, the controlling authorities shall check by any appropriate mean the relevance of the value of σ chosen by the professionals.
a) calculate the mean of the sample ![]()
b) see Table 3
4.3.2 Recommended sampling plans by variables : s method
This section recommends the following simple sampling plans, for covering frequent inspection situations. They are extracted from the Standard ISO 3951, and are characterised by their AQL (of 0,65 % and 6,5 % for covering the most frequent cases), the size n of items in the sample and K the acceptance constant. Each plan is accompanied by a table which gives the probability of acceptance of the lots in function of the defective rate in these lots. For each AQL, a graph sums up the OC curves of the corresponding recommended plans.
The OC curves have been built point-by-point using the following approximation:
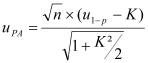
where:
uPA is the fractile of order PA of the standardized normal law,
PA is the probability of acceptance of a lot containing a defective rate of p,
K is the acceptability constant,
u1-p is the fractile of order 1-p of the standardized normal law,
n is the sample size.
Table 14 (from NMKL Procedure N°12, see reference 5) gives the number of items to be sampled at different lot sizes and inspection levels (normal inspection, tighten inspection and reduced inspection). It also gives the acceptability constant, K, at AQL’s of 0,65%, 2,5% and 6,5% respectively. Low AQL’s (0,65%) should be applied for critical defects while higher AQL should be applied for compositional parameters. Table 14 is a simplification of the “s-method” given in ISO 3951:1989.
Inspection level | ||||
Lot size (Number of items) |
n and k |
Reduced |
Normal |
Tightened |
2 - 8 |
n
|
3
|
3
|
4
|
9 - 15 |
n
|
3
|
3
|
5
|
16 - 25 |
n
|
3
|
4
|
7
|
26 - 50 |
n
|
3
|
5
|
10
|
51 - 90 |
n
|
3
|
7
|
15
|
91 - 150 |
n
|
3
|
10
|
20
|
151 - 280 |
n
|
4
|
15
|
25
|
281 - 500 |
n
|
5
|
20
|
35
|
501 – 1 200 |
n
|
7
|
35
|
50
|
1 201 – 1 320 |
n
|
10
|
50
|
75
|
1 321 - 10 000 |
n
|
15
|
75
|
100
|
10 001 - 35 000 |
n
|
20
|
100
|
150
|
35 001 - 150 000 |
n
|
25
|
150
|
200
|
150 001 -
|
n
|
35
|
200
|
200
|
500 001 and over |
n
|
50
|
200
|
200
|
Table 15: Probability of lot acceptance at AQL = 0,65 %, variable sampling plan (s-method)
Defective rates in the lots |
Probability of lot acceptance
| |||
Letter-code D,
|
Letter-code E,
P95 = 0,32%
|
Letter-code F,
P95 = 0,36%
|
Letter-code G,
P95 = 0,45%
| |
0% |
100% |
100% |
100% |
100% |
1% |
96% |
96% |
97,5% |
98% |
2% |
94% |
94% |
92,5% |
95% |
3% |
86% |
86% |
86% |
86% |
4% |
82% |
82% |
80% |
78% |
5% |
78% |
76% |
73% |
70% |
6% |
74% |
70% |
66% |
62% |
7% |
69% |
66% |
59% |
54% |
8% |
66% |
60% |
54% |
46% |
9% |
61% |
56% |
48% |
39% |
10% |
58% |
52% |
42% |
34% |
15% |
42% |
34% |
23% |
14% |
20% |
30% |
21% |
12% |
5% |
25% |
23% |
13% |
6% |
1,5% |
30% |
15% |
8% |
2% |
0% |
35% |
10% |
5% |
1% |
0% |
40% |
6% |
2% |
0% |
0% |
45% |
4% |
1% |
0% |
0% |
50% |
2% |
0% |
0% |
0% |
100% |
0% |
0% |
0% |
0% |
Table 15 (continued)
Defective rates in the lots |
Probability of lot acceptance
| ||||
Letter-code H,
|
Letter-codeIE,
P95 = 0,56%
|
Letter-code J,
P95 = 0,36%
|
Letter-code K,
P95 = 0,64%
| ||
0% |
100% |
100% |
100% |
100% | |
1% |
84% |
84% |
84% |
84% | |
2% |
63% |
62% |
56% |
48% | |
3% |
44% |
40% |
32% |
22% | |
4% |
32% |
28% |
19% |
10% | |
5% |
24% |
18% |
4% | ||
6% |
16% |
12% |
6% |
||
7% |
12% |
8% |
3,5% |
1% | |
8% |
8% |
6% |
2% |
0,5% | |
9% |
6% |
4% |
1% |
||
10% |
4% |
2% |
0% |
0% | |
15% |
0% |
0% |
0% |
0% | |
Figure 9: OC curve, variable sampling plan, s-method, AQL = 0,65 %, n = 5 to 15
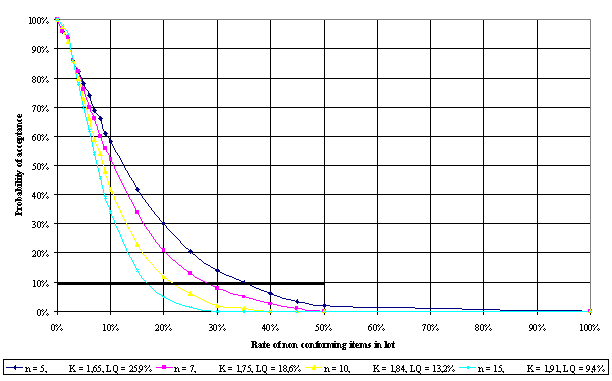
Figure 10: OC curve, variable sampling plan, s-method, AQL = 0,65 %, n =
20 to 50
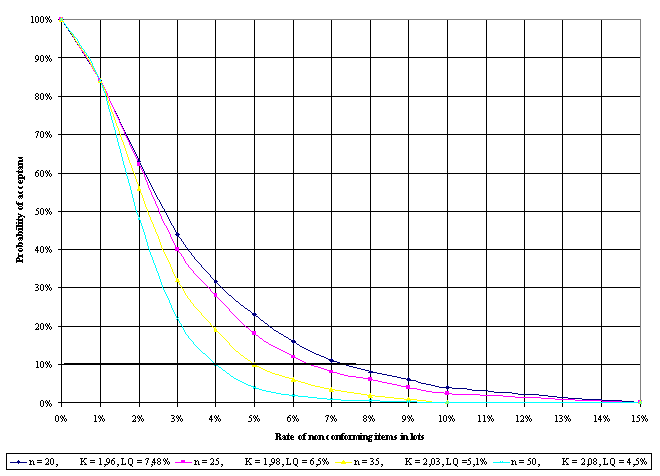
Table 16: Probability of lot acceptance, variable sampling plans (s-method), AQL = 2,5 %
Defective rates in the lots |
Probability of lot acceptance
| |||
Letter-code D,
|
Letter-code E,
|
Letter-code F,
|
Letter-code G,
| |
0% |
100% |
100% |
100% |
100% |
1% |
96% |
96% |
97,5% |
99% |
2% |
94% |
94% |
92,5% |
95% |
3% |
86% |
86% |
86% |
86% |
4% |
82% |
82% |
80% |
78% |
5% |
78% |
76% |
73% |
70% |
6% |
74% |
70% |
66% |
62% |
7% |
69% |
66% |
59% |
54% |
8% |
66% |
60% |
54% |
46% |
9% |
61% |
56% |
48% |
39% |
10% |
58% |
52% |
42% |
34% |
15% |
42% |
34% |
23% |
14% |
20% |
30% |
21% |
12% |
5% |
25% |
23% |
13% |
6% |
1,5% |
30% |
15% |
8% |
2% |
0% |
40% |
6% |
2% |
0% |
0% |
45% |
4% |
1% |
0% |
0% |
50% |
2% |
0% |
0% |
0% |
60% |
0,5% |
0% |
0% |
0% |
Table 16 (continued)
Defective rates in the lots |
Probability of lot acceptance
| |||||
Letter-code H,
|
Letter-code I,
|
Letter-code J,
|
Letter-code K,
| |||
0% |
100% |
100% |
100% |
100% | ||
1% |
99% |
99% |
99% |
99% | ||
2% |
95% |
94% |
94% |
98% | ||
3% |
88% |
88% |
90% |
90% | ||
4% |
78% |
78% |
75% |
75% | ||
5% |
68% |
66% |
62% |
58% | ||
6% |
58% |
56% |
50% |
40% | ||
7% |
49% |
44% |
38% |
28% | ||
8% |
40% |
36% |
25,5% |
18% | ||
9% |
32% |
28% |
20% |
11% | ||
10% |
26% |
22,5% |
14% |
8% | ||
12% |
17% |
12% |
6% |
2% | ||
13% |
13% |
10% |
4% |
1% | ||
14% |
10% |
7% |
3% |
0% | ||
15% |
8% |
5% |
0% |
0% | ||
20% |
2% |
1% |
0% |
0% | ||
25% |
0% |
0% |
0% |
0% | ||
Figure 11: OC curve, variable sampling plan, s-method, AQL = 2,5 %, n = 5 to 15
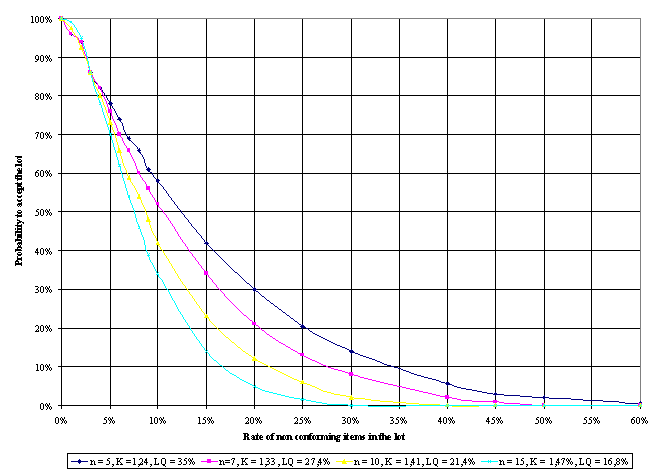
Figure 12: OC curve, variable sampling plan, s-method, AQL = 2,5 %, n = 20 to 50
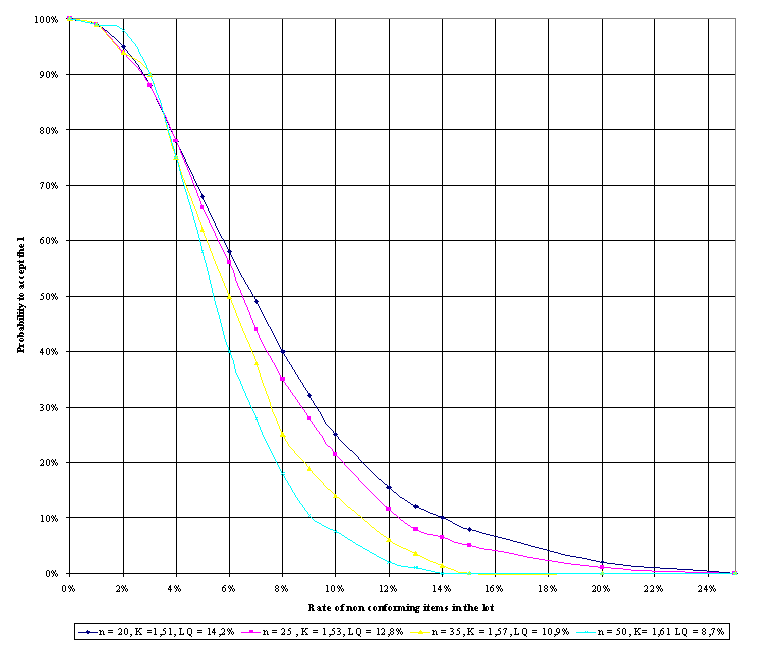
4.3.3 Recommended sampling plans by variables: σ-method
This document recommends the following simple sampling plans, a for covering frequent inspetion situations. They are extracted from the Standard ISO 3951, and are characterised by their AQL (AQL of 0,65 % and 2,5 % covering the most frequent cases), the size n of items in the sample and K the acceptance constant. Each plan is accompanied by a table which gives the probability to accept the lots in function of the defective rate in these lots. For each AQL, a graph sums up the OC curves of the corresponding recommended plans.
The OC curves have been built point-by-point from the following .equation :
![]()
where:
uPA is the fractile of PA order of the centered reduced normal law,
PA is the probability of accepting a lot having a defective rate of p
U1-p is the fractile of 1-p order of the centered reduced normal law,
p is the the defective rate accepted in the lot with the probability PA.
Table 17 (from NMKL Procedure N° 12, reference 5 and ISO 3951) indicates, for a normal inspection by variables (σ-method), the correspondence which is preferable for a better consumer protection (see clause 2.2.18) between the lot or batch size, the letter-code of the sample size, the sample size n and the acceptance constant K for given AQLs.
Inspection level | ||||
Lot size (Number of items) |
AQLs (%) |
Reduced
|
Normal
|
Tightened
|
2 - 8 |
0,65
|
2 / 1,36
|
2 / 1,58
|
2 / 1,81
|
9 - 15 |
0,65
|
----||---- |
----||---- |
2 / 1,81
|
16 - 25 |
0,65
|
----||---- |
----||---- |
2 / 1,81
|
26 - 50 |
0,65
|
----||---- |
2 / 1,58
|
3 / 1,91
|
51 - 90 |
0,65
|
----||---- |
3 / 1,69
|
5 / 2,05
|
91 - 150 |
0,65
|
----||---- |
4 / 1,80
|
6 / 2,08
|
151 - 280 |
0,65
|
----||---- |
5 / 1,88
|
8 / 2,13
|
281 - 500 |
0,65
|
2 / 1,42
|
7 / 1,95
|
10 / 2,16
|
501 - 1 200 |
0,65
|
3 / 1,69
|
8 / 1,96
|
14 / 2,21
|
1 201 - 3 200 |
0,65
|
4 / 1,69
|
11 / 2,01
|
21 / 2,27
|
1 320 - 10 000 |
0,65
|
6 / 1,78
|
16 / 2,07
|
27 / 2,29
|
10 001 - 35 000 |
0,65
|
7 / 1,80
|
23 / 2,12
|
40 / 2,33
|
35 001 - 150 000 |
0,65
|
9 / 1,83
|
30 / 2,14
|
54 / 2,34
|
150 001 -
|
0,65
|
12 / 1,88
|
44 / 2,17
|
54 / 2,34
|
500 001 and over |
0,65
|
17 / 1,93
|
59 / 2,18
|
54 / 2,34
|
Table 18: Probability of lot acceptance, variable sampling plans, σ-method, AQL = 0,65 %
Defective rates in the lots |
Probability of lot acceptance
| |||
Letter-code E,
|
Letter-code F,
|
Letter-code G,
|
Letter-code H,
| |
0% |
100% |
100% |
100% |
100% |
0,65% |
91,5% |
91,4% |
91,2% |
92,1% |
1% |
86,5% |
85,4% |
84% |
84,1% |
2% |
73,5% |
69,4% |
65,1% |
60,8% |
3% |
62,9% |
56,4% |
50% |
42,7% |
4% |
54,2% |
46,1% |
38,6% |
29,9% |
5% |
46,9% |
37,8% |
29,9% |
20,9% |
6% |
40,7% |
31,2% |
23,3% |
14,7% |
7% |
35,5% |
25,8% |
18,3% |
10,4% |
8% |
31,1% |
21,5% |
14,4% |
7,4% |
9% |
27,3% |
17,9% |
11,4% |
5,3% |
10% |
24% |
15% |
9% |
3,8% |
15% |
12,9% |
15% |
2,9% |
0,8% |
17 % |
10% |
4,5% |
1,9% |
0,4% |
20% |
7,1% |
2,8% |
1% |
0% |
25% |
3,9% |
1,2% |
0,3% |
0% |
30% |
2,2% |
0,5% |
0% |
0% |
35% |
1,2% |
0,2% |
0% |
0% |
40% |
0,6% |
0,1% |
0% |
0% |
45% |
0,3% |
0% |
0% |
0% |
50% |
0,2% |
0% |
0% |
0% |
60% |
0% |
0% |
0% |
0% |
Table 18 (continued)
Defective rates in the lots |
Probability of lot acceptance
| ||||
Letter-code J, AQL = 0,65%,
P10 = 5,1% |
Letter-code K, AQL = 0,65%, n= 16,
P95 = 0,64%
P10 = 4,03% |
Letter-code L, AQL = 0,65%, n= 23,
P95 = 0,7%
P10 = 3,24% |
Letter-code M, AQL = 0,65%, n= 30,
P95 = 0,74%
P10 = 2,88% |
Letter-code N, AQL = 0,65%, n= 44,
P95 = 0,77%
P10 = 2,36% | |
0% |
100% |
100% |
100% |
100% |
100% |
0,65% |
94,2% |
95,1% |
95,6% |
97% |
98,1% |
1% |
85,3% |
84,7% |
83,4% |
84,6% |
85% |
2% |
55,8% |
47,4% |
37,8% |
31,8% |
22% |
3% |
33,4% |
22,5% |
13% |
7,8% |
2,8% |
4% |
19,5% |
10% |
4,1% |
1,6% |
0,3% |
5% |
11,3% |
4,5% |
1,3% |
0,3% |
0% |
6% |
6,5% |
2% |
0,4% |
0,1% |
0% |
7% |
3,8% |
0,9% |
0,1% |
0% |
0% |
8% |
2,2% |
0,4% |
0% |
0% |
0% |
9% |
1,3% |
0,2% |
0% |
0% |
0% |
10% |
0,8% |
0,1% |
0% |
0% |
0% |
15% |
0,1% |
0% |
0% |
0% |
0% |
16% |
0% |
0% |
0% |
0% |
0% |
Figure 13: OC curve, variable sampling plan, σ-method, AQL = 0,65 %,
n = 3 to 11
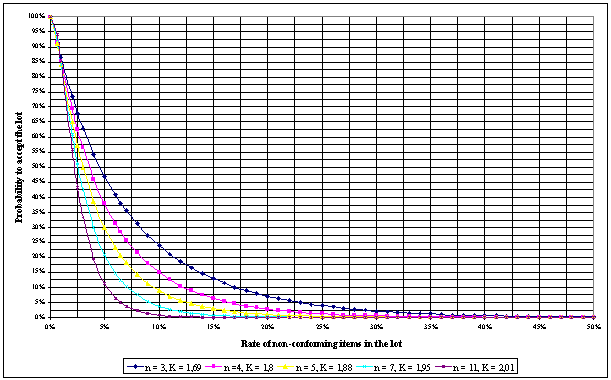
Figure 14: OC curve, variable sampling plan, σ-method, AQL = 0,65 %, n = 16 to 44
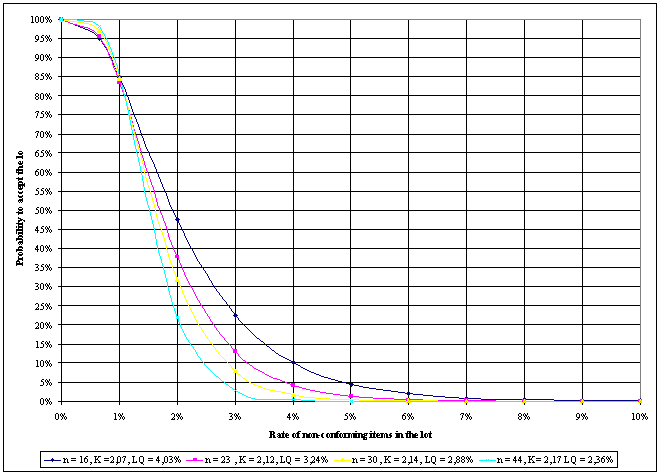
Table 19: Probability of lot acceptance, variable sampling plans, σ-method, AQL = 2,5 %
Defective rates in the lots |
Probability of lot acceptance
| ||||
Letter-code D, AQL = 2,5%,
|
Letter-code E, AQL = 2,5%,
|
Letter-code F, AQL = 2,5%,
|
Letter-code G, AQL = 2,5%,
|
Letter-code H, AQL = 2,5%,
| |
0% |
100% |
100% |
100% |
100% |
100% |
1% |
97,7% |
98,2% |
98,2% |
99% |
99,4% |
2% |
73,5% |
93,9% |
93,1% |
94,5% |
95,5% |
3% |
93,7% |
88,5% |
86,4% |
87,3% |
87,9% |
4% |
84,3% |
82,7% |
79% |
78,7% |
78,3% |
5% |
79,5% |
76,7% |
71,6% |
69,7% |
67,9% |
6% |
74,7% |
70,9% |
64,4% |
60,9% |
57,7% |
7% |
70,2% |
65,2% |
57,6% |
52,7% |
48,3% |
8% |
65,8% |
59,9% |
51,3% |
45,3% |
39,9% |
10% |
57,7% |
50% |
40,4% |
32,8% |
26,6% |
15% |
40,9% |
31,3% |
21,5% |
13,7% |
8,7% |
20% |
28,5% |
19% |
10% |
5,4% |
2,6% |
25% |
19,5% |
11,3% |
5,5% |
2% |
0,7% |
30% |
13,2% |
6,5% |
2,6% |
0,7% |
0,2% |
35% |
8,7% |
3,7% |
1,2% |
0,2% |
0% |
40% |
5,6% |
2% |
0,6% |
0,1% |
0% |
45% |
3,5% |
1% |
0,2% |
0% |
0% |
50% |
2,1%% |
0,5% |
0,1% |
0% |
0% |
60% |
0,7% |
0,1% |
0% |
0% |
0% |
65% |
0,4% |
0% |
0% |
0% |
0% |
70% |
0,2% |
0% |
0% |
0% |
0% |
75% |
0,1% |
0% |
0% |
0% |
0% |
80% |
0% |
0% |
0% |
0% |
0% |
0% |
0% |
0% |
0% |
0% | |
Table 19 (continued)
Defective rates in the lots |
Probability of lot acceptance
| ||||
Letter-code I, AQL = 2,5%,
|
Letter-code J, AQL = 2,5%,
|
Letter-code K, AQL = 2,5%,
|
Letter-code L, AQL = 2,5%,
|
Letter-code M, AQL = 2,5%,
| |
0% |
100% |
100% |
100% |
100% |
100% |
1% |
99,7% |
99,9% |
99,9% |
99,9% |
99,9% |
2% |
96,4% |
97,2% |
98,1% |
98,3% |
99,4% |
3% |
89,1% |
89,3% |
89,8% |
90,4% |
91,4% |
4% |
78,8% |
77% |
74,5% |
71,6% |
69,9% |
5% |
67,3% |
62,9% |
56,5% |
50% |
43,5% |
6% |
55,9% |
49,2% |
39,8% |
29,5% |
22,8% |
7% |
45% |
37,2% |
26,5% |
16,2% |
10% |
8% |
36,4% |
27,4% |
16,8% |
8,3% |
4,3% |
9% |
28,7% |
19,8% |
10,3% |
4% |
1,6% |
10% |
22,4% |
14% |
6,2% |
1,9% |
0,6% |
11% |
17,4% |
10% |
3,6% |
0,8% |
0,2% |
13% |
10% |
4,7% |
1,2% |
0,2% |
0% |
15% |
5,8% |
2,1% |
0,4% |
0% |
0% |
20% |
1,3% |
0,3% |
0% |
0% |
0% |
25% |
0,3% |
0% |
0% |
0% |
0% |
30% |
0,1% |
0% |
0% |
0% |
0% |
31% |
0% |
0% |
0% |
0% |
0% |
Figure 15: OC curve, variable sampling plan, σ-method, AQL = 2,5 %, n = 3 to 9
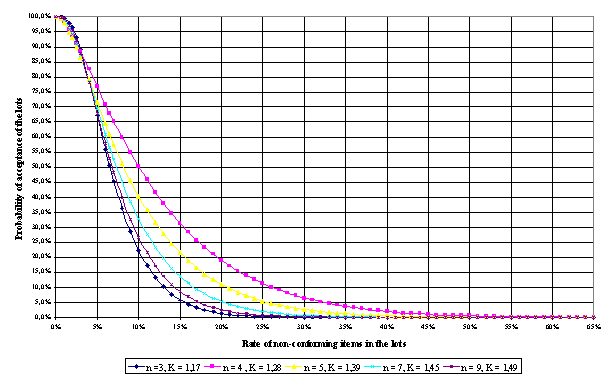
Figure 16: OC curve, variable sampling plan, σ-method, AQL = 2,5 %, n = 11 to 42
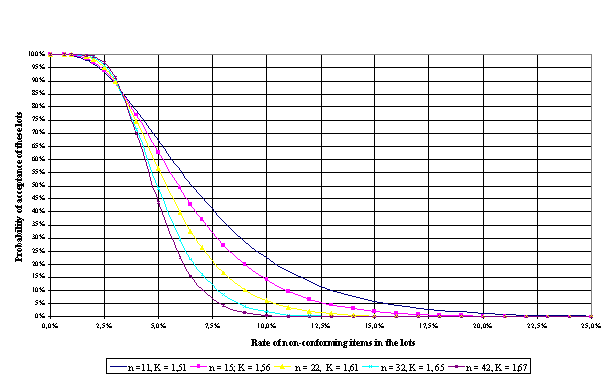
(see article 19 of Standard ISO 3951)
When it is necessary, the switching towards a tightened inspection, which may lead to the rejection of the controlled lots, is mandatory. Nevertheless, the switching toward a reduced inspection, when the mean quality of a process is stable, at a level inferior to the AQL, is optional, at the discretion of the responsible authority. If there is sufficient proof, from the inspection tables, that the variability is in compliance with the statistical criteria, it can be envisaged to switch from the s method to the σ method, using the value of σ instead of s (see details in clause 2.2 and annex A of ISO 3951).
The switching of inspection level will of course imply a change of sampling plan (sample size, acceptance number).
The normal inspection is applied at the beginning of inspection (unless otherwise stated) and shall continue to be applied during inspection till a tightened inspection becomes necessary, or on the contrary, a reduced inspection becomes justified.
A tightened inspection shall be performed when 2 lots submitted to the original normal inspection are not accepted over 5 successive lots. The tightened inspection can be left when 5 successive lots at the first inspection have been accepted at the tightened inspection; the normal inspection is then again performed.
It is possible to introduce a reduced inspection when 10 successive lots have been accepted at the normal inspection, under the following conditions :
a) these 10 lots would have been accepted if the AQL would have been fixed at the immediately inferior value to the one fixed by the plan (see Tables 2 and 3 of ISO 3951 : 1989);
b) the production is under statistical control;
c) the reduced inspection is considered as desirable by the users of the plans;
It is mandatory to stop the reduced inspection and to re-introduce a normal inspection if one of the following conditions are archived on lots at first inspection:
a) one lot is not accepted;
b) the production is delayed or erratic;
c) other conditions (change of supplier, of workers, of machines,…) imply the need to come back to a normal inspection.
Such a control is performed by using a test which aims at ensuring that, on average, the content of the controlled characteristic is at least equal to either the quantity given of the label of the product, or the quantity fixed by the regulation or a code of practice (e.g. net weight, net volume,…).
Description of the test
n is the sample size, in number of items, used for the test
is the sample mean of the n items in the sample
is the standard deviation of the values of the items in the sample.
α is the significance level of the test, that is the probability of wrongly concluding that the mean content of the controlled chacteristic is less than the stated value when it is indeed greater than or equal to that value.
tα is the value of the Student’s t-distribution, on n-1 degrees of freedom, corresponding to the significance level α29.
M is the stated value for the mean of the lot.
Table 20: Selected t-values of the Student’s distribution
Number of Samples |
t-value
|
t-value
|
5 |
2,13 |
4,60 |
10 |
1,83 |
3,25 |
15 |
1,76 |
2,98 |
20 |
1,73 |
2,86 |
25 |
1,71 |
2,80 |
30 |
1,70 |
2,76 |
35 |
1,69 |
2,73 |
40 |
1,68 |
2,71 |
45 |
1,68 |
2,69 |
50 |
1,68 |
2,68 |
Decision Rules
M is considered by the Codex specification as a minimum value for the mean
Example: fat content of a whole milk
The lot is accepted if:
![]() and rejected otherwise.
and rejected otherwise.
Table 20 provides t-values of the Student’s distribution for some selected sample sizes and for α of 5 % and 0,5 %.
M is considered by the Codex specification as a maximum value for the mean
Example: Sodium content of a diet rusk
The lot is accepted if:
![]() and rejected otherwise.
and rejected otherwise.
M is considered by the Codex specification neither as a minimum value for the mean, neither as a maximum value for the mean
Example: Vitamin C content in an infant formula
![]() The lot is accepted if
The lot is accepted if
and rejected otherwise.
Description of the test
n is the sample size, in number of items, used for the test
is the sample mean of the n items in the sample
σ is the known standard deviation.
α is the significance level of the test, that is the probability of wrongly concluding that the mean content of the controlled chacteristic is less than the stated value when it is indeed greater than or equal to that value.
uα is the value of the standardardized Normal distribution, corresponding to the significance level α30 (u0,05 = 1,645, u0,005 = 2,576).
M is the stated value for the mean of the lot.
Decision Rules
M is considered by the Codex specification as a minimum value for the mean
Example: fat content of a whole milk
The lot is accepted if:
![]() and rejected otherwise.
and rejected otherwise.
M is considered by the Codex specification as a maximum value for the mean
Example: Sodium content of a diet rusk
The lot is accepted if:
![]()
and rejected otherwise.
M is considered by the Codex specification neither as a minimum value for the mean, neither as a maximum value for the mean
Example: Vitamin C content in an infant formula
![]() The lot is accepted if
The lot is accepted if
and rejected otherwise.
(see ISO/FDIS 10725 and ISO 11 648-1)
Normally, the sampling plans described in Section 5.1 should only be applied to a continuous series of lots from a single source. However, the plans described below may be utilised when data have been collected, describing the standard deviation of the quality characteristic, from isolated lots from a single source, over a prolonged period of time.
This draft standard addresses the need for sampling plans, by variables, for situations where the estimation of the lot mean of a single quality characteristic is the principal factor in the determination of lot acceptability. The sampling plans in this standard address the situations where a normal distribution of the quality characteristic occurs. However, users should not be too concerned about a deviation from normality, since the distribution of the sample grand average is usually very close to a normal distribution, unless the sample sizes are too small.
The standard may be applied:
• to a continuing series of lots
• to lots in isolation (when the value of each standard deviation of the quality characteristic is considered to be known and stable; for example, where a lot in isolation with respect to the purchaser may be part of a continuing series of lots produced by the supplier)
• when the specified quality characteristic χ is measurable on a continuous scale
• when the quality characteristic is stable, and the standard deviation known
• to a variety of bulk materials including liquids, solids (granular and powdered), emulsions and suspensions
• when a single specification limit is specified (however, under special circumstances, the standard is applicable when double specification limits are specified)
The procedures involved in each step may be summarised as follows:
• Selection of a sampling plan
The selection of a sampling plan involves the following steps, in particular for inspection of bulk material:
° the establishment of standard deviations, costs, producer’s risk quality, consumer’s risk quality and discrimination distance (see definitions in 2.2.12)
If both the composite sample standard deviation (Sc) and the test sample standard deviation (St) control charts have no ‘out of control’ points, and if no other evidence gives doubt about their stability, it can be deemed that all standard deviations are stable. Methods for the confirmation and recalculation of standard deviations, including the utilisation of control charts, are provided in clause 12 of ISO/CD 10725-2.3
the specification of the acceptance value(s)
Acceptance value
When a lower specification limit is specified, the lower acceptance value is given by the equation:![]()
![]() L = mA - 0.562D
L = mA - 0.562D
When an upper specification limit is specified, the upper acceptance value is given by the equation:![]()
![]() U = mA + 0.562D
U = mA + 0.562D
where mA is the producers’ risk
D is the discrimination distance.
• Drawing of increments from the lot
An appropriate sampling device should be used together with representative sampling to afford ni increments (i is the increment of rank i)
• Preparation of one or more composite samples
The n increments are pooled in order to produce nc composite samples (A recommended, economical procedure is the preparation of duplicate samples by combining all odd numbered increments, to produce the first composite sample; and all even numbered increments, to produce the second composite sample.)
• Preparation of test samples
nt test samples, of specified mass and particle size, are prepared from each composite sample, using appropriate crushing/grinding, sample division and mixing procedures.
• Drawing of test portions for measurement
nm test portions, of specified mass, are drawn from each test sample
• Measurement of specified quality characteristic of test portions
A single measurement is performed on each test portion, to afford nc.nt.nm measurements per lot
• Determination of lot acceptability
The sample grand average (![]() ) is calculated form the nc composite sample averages (which are calculated from the nT test sample averages which, themselves, are calculated from the nM measurement results)
) is calculated form the nc composite sample averages (which are calculated from the nT test sample averages which, themselves, are calculated from the nM measurement results)
° When a single lower specification limit is specified:
Accept the lot if ![]() ≥
≥ ![]() L
L
Reject the lot if ![]() <
< ![]() L
L
° When a single upper specification limit is specified:
Accept the lot if ![]() ≤
≤ ![]() U
U
Reject the lot if ![]() >
> ![]() U
U
° When double specification limits are specified:
Accept the lot if ![]() L ≤
L ≤ ![]() ≤
≤ ![]() U
U
Reject the lot if either, ![]() <
< ![]() L, or
L, or ![]() >
> ![]() U
U
1. Micro-organisms in Foods. 2. Sampling for microbiological analysis: Principles and specific applications; International Commission on Microbiological Specifications for Foods, ICMSF, 1986, ISBN 0-632-015 67-5.
2. Cochran, WG: Sampling Techniques, 3rd Edition, Wiley, New York, 1977
3. Ducan, AJ: Quality Control and Industrial Statistics, 5th Edition, Irwin, Homewood, IL, 1986
4. Montgomery, DC: Introduction to Statistical Quality Control, 4th Edition, Wiley, New York, 2000
5. NMKL Procedure N° 12: Guide on Sampling for Analysis of Foods, 2002

1 See also “Principles for the establishment or selection of Codex Sampling procedures : general instructions for the selection of methods of sampling”, in the Codex Alimentarius Manual of Procedures.
2 Not covered by these Guidelines. Such pragmatic sampling has been used in the Codex for example for the determination of compliance with Maximum Residue Limits for pesticides and veterinary drugs.
3 Assuming for quantitative measurements, that measurement error is negligible in relation to process variation (see Section 2.4)
4 Or individualisable.
5 Qualitative data includes quantitative data classified as attributes, for example with respect to a limit.
6 It is recommended that Codex product committees also refer to existing sectorial ISO Standards (today approximately 20), which are specific to certain types of foods.
7 The Codex Alimentarius Commission at its 22nd Session (June 1997) abolished the CAC/RM Numbering System.
8 After checking, if necessary by an appropriate statistical test for comparison of 2 samples, i.e. a parametric test of a mean/variance of the characteristic (e.g. Aspin-Welch test) or a non parametric test of the characteristic for the proportions (e.g. Chi-square test or Kolmogorof-Smirnof test) (see references 2 , 3 and 4).
9 The DR of an attribute sampling plan (n=2, c=0) is 27, the one of an attribute sampling plan (n=3, c=0) is 32, the one of an attribute sampling plan (n=5, c=0) is 36.
10 See the definition of a representative sample in 2.2.3.
11 The assessment of such a situation can be done, for a periodic phenomenon, by looking at the process control chart, for the storage conditions, or by obtaining information from storage managers, laboratories, professional organisations.
12 In order to highlight the difference with the σ method, the numerical values are identical to whose indicated in the case of the σ method.
13 A transformation to convert the distribution of a variable to normality should not be used, unless there is agreed documentary evidence to justify it.
14 When the inspection of two specifications, for example the fat content and the sodium content of a dietary cheese, necessitates the implementation of a plan by attributes (for the fat content) and by variables (for the sodium content), it is recommended, only for reasons of practicality of inspection, to choose a plan by attributes for the two specifications.
15 According to 7.1 of Standard ISO 2859-2.
16 For inhomogeneous lots (especially the ones where the distribution of the characteristic shows several peaks), a a stratified sampling plan should be performed.
17 α is generally taken at 5%, or 0,5%.
18 The plans of Section 4.3.2 may also be used for isolated lots.
19 Any inspection level other than the normal control shall be justified by the users of sampling plans.
20 P95 = Rate of non-conforming items in lots accepted in 95% of cases
21 P50 = Rate of non-conforming items in lots accepted in 50% of cases
22 P10 = Rate of non-conforming items in lots accepted in 10% of cases
23 P95 = Rate of non-conforming items in lots accepted in 95% of cases
24 P50 = Rate of non-conforming items in lots accepted in 50% of cases
25 P10 = Rate of non-conforming items in lots accepted in 10% of cases
26 P95 = Rate of non-conforming items in lots accepted in 95% of cases
27 P50 = Rate of non-conforming items in lots accepted in 50% of cases
28 P10 = Rate of non-conforming items in lots accepted in 10% of cases
29 α is generally taken at 5%, or 0,5%.
30 α is generally taken at 5%, or 0,5%.