![]()
![]()
![]()
Slightly different analysis frameworks were adopted for monthly an annual data. But in both cases the first step taken was the analysis of the dynamic properties of the price series, aimed at understanding if price pairs are integrated to the same order, by testing for the presence of unit roots. For the monthly data, two different tests were applied: the Augmented Dickey-Fuller (ADF) test, and the Phillip-Perron (PP) test.[5] These were run with and without a time trend and a constant term[6], for a number of lags varying from two to twelve, both on the log-level series and the series in first differences.
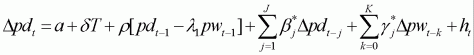
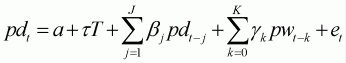
On the basis of the properties, the test for unit roots was applied also to the residuals of the static regression between each pair of prices, in order to test for co-integration following the Engle and Granger (1987) procedure. Where co-integration arose, a set of Auto Regressive Distributed Lag (ARDL) models were specified and estimated as follows:
|
|
(1) |
where pd are the countries’ (logarithm of the) import unit values in time t, pw is the (log) world reference price, a is an intercept, T is a time trend, e is the error term, and t is the period index.
A key issue in estimating this type of model is the identification of the correct number of lags to be included, given that both under- and over-parametrization can create problems, respectively of misspecification and of unnecessary reduction in the degrees of freedom. The relevant J and K were chosen here through the minimization of the Akaike information criterion, supplemented by the Schwartz-Bayesian, the Hannan-Quinn, and Log-Likelihood tests mainly to check for the consistency of the results.
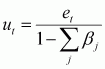
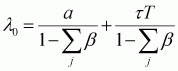
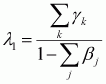
Given the lag structure, the presence of a long run relationship between pd
and pw can be tested by considering the parameters of the relation 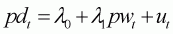 in which, under the assumptions that
  and
and  it is
it is
|
|
|
|
Where the null of absence of co-integration is rejected in the Engle and Granger (1987) procedure, the adjustment taking place around the long run equilibrium can be modelled through an Error Correction (ECM) specification, such as:
|
|
(2) |
in which the coefficient 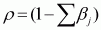 usually named “ECM coefficient”, indicates the short run adjustment
of prices toward the long run equilibrium, and l1.is
the same as the one calculated from the ARDL model in (1).
usually named “ECM coefficient”, indicates the short run adjustment
of prices toward the long run equilibrium, and l1.is
the same as the one calculated from the ARDL model in (1).
Results reported here include for each commodity the parameters and the t statistics for the long run equilibrium, together with the results of the estimation of the corresponding ECM specifications.
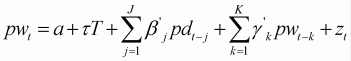
In order to test for Granger non-causality between the pairs of prices, model (1) and its reverse form have been estimated by dropping the contemporaneous coefficients, according to
|
|
and |
|
|
(3) |
Both equations were tested for gk bj g'k b'j significantly different from zero for any j, k. Acceptance of the null implies that past values of the series on the right hand side are not adding information on the actual values of the series on the left hand side, on top of what is provided by its own past values. If this happens in both equations, then neither of the two series is Granger-causing the other, while if the null can be rejected in one of them, the price appearing on the left hand side will be Granger-causing the other. Given that a co-integrating relation must exist between the two series involved if Granger-non-causality is rejected in at least one of the two equations, this test has been used here firstly, as a confirmation of the test for the long run equilibrium; secondly, to understand which of the two price acts as a source of information for the other; and thirdly, to gain qualitative elements to understand the results, in terms of the causality direction. Rejection of the null in both the equations is to be considered as indicating a model misspecification or incompleteness, as it implies that both series are being Granger-caused by some third unknown variable. This test was performed, on monthly data, for those pairs of prices showing the presence of a long run equilibrium.
Moreover, on these same price pairs the symmetry of transmission is tested drawing on Prakash, Oliver and Balcombe (2002). A dummy variable is added to the ARDL model (1), assigning a value of 1 to the observations showing positive residuals in the static regression between each pair of prices. Rejection of the t test on this variable allows the series between which transmission is not symmetric to be identified When this is the case, comparison of the short and the long run parameters of the ECM specifications with and without the dummy, allows it to be understood if positive price shocks are passed on the other price series to a greater or smaller extent. In other words, if the model that includes the dummy variable shows a higher speed and a higher degree of price transmission, this means that positive shocks are transmitted more and faster than negative ones. This procedure for testing asymmetry was applied only to those pairs of prices for which the results indicate the presence of co-integration and of a significant long run equilibrium, thereby precluding non-spurious cases, together with a meaningful result of the Granger tests for non-causality.
Concerning annual data, they were also analyzed by testing for co-integration with the Engle and Granger (1987) procedure - after running the Unit Root tests - and for long run equilibrium; but in the specification of model (1) a simple structure including a maximum of two lags, without selection criteria, was assumed. The significance of the long parameter calculated from model (1) was tested while no evidence was reported for the ECM coefficients, which were considered less interesting, given that in annual data most of the short run variability is already averaged out. For this same reason, no tests were applied for causality and asymmetry on annual data.
|
[5] As is known, the first is a
parametric test, based on the estimation of an AR(n) model, in which the
null hypothesis that the coefficients of the lagged dependent variables are
unitary is tested against a one sided alternative that they are strictly smaller
than one; where the former identifies a random walk, while a coefficient higher
than one would imply an explosive behaviour. The Phillips-Perron test is
conceptually similar to the ADF, but it is based on an AR(1) model, in
which the same test on the coefficient of the lagged variable is performed by
correcting the usual t-statistic with a (non parametric) estimate of the
spectrum of the error term. [6] For brevity, only the tests including the constant and the trend are reported in the tables. |
![]()
![]()
![]()
 and
and