


Emerging countries with strong economic growth, such as China, India and Russia, are influencing availability and prices of natural resources as well as global products trade.
The traditional paper and wood products industry is facing challenges and opportunities resulting from driving forces coming from these emerging economies. Fibre supply availability and trade flows – be they wood or recovered fibre –are experiencing new trends, often triggering concern on the part of the international forestry community and civil society.
Dr Gary Bull, Professor at the University of British Columbia in Vancouver, Canada, presented the latest findings in the case of China and some major issues and trends of wood supply for the paper and wood products industry.
This study was carried out in collaboration with the International Institute for Applied Systems Analysis (IIASA), Forest Trends, CIFOR and other partners. The main points of the analysis are:
• China’s share of the global forest sector;
• What are China’s forest sector trends?;
• Review of key demand and supply issues in China.
China is playing an increasingly important role in forest products trade and in the wood supply chain. The purpose of this report is to: 1) review China’s share of the global forest sector; 2) evaluate China’s forest sector trends, and; 3) review fibre supply issues in China.
Much of this analysis relies on the author’s own assessment on China, in collaboration with other international institutions that have taken an interest in China, including some domestic institutions. The selected reading list provides a summary of some of the background material summarized in this paper.
China’s spectacular economic growth over the last decade is having a dramatic impact throughout the world. It has become a leading nation in terms of its demand for forest products. Its influence is being felt as far a field as Cameroon and Cambodia, Indonesia and the United States. Burgeoning domestic consumption, in a nation with very limited per capita forest resources, has fuelled the rapid rise in China’s imports of forest products. Growing demand in the USA, Europe and elsewhere for low-cost wood products manufactured in China has also contributed to the country’s ever-increasing demand for foreign timber. China has rapidly become the wood workshop of the world, capturing almost a third of the global trade in furniture over the last eight years.
As illustrated in Figure 1, the current industrial roundwood production is nearly 2 billion m3 and this is expected to continue to increase (Northway and Bull 2006)
Figure 1. Global Industrial Round Production
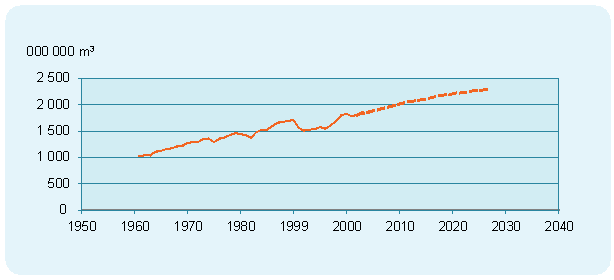
Figure 2 indicates that China’s share of this world production differs, depending on the product categories of panels, plywood, sawnwood, newsprint, paper and pulp. For example, China’s share of plywood production is over 20 percent of the world production and if historic trends hold true, this will increase to 40 percent by the year 2020. The other important thing to note is that the trends in all major product categories is upward and, if taken together, China’s share of global industrial product is increasing.
Figure 2. China as a percentage of World Production
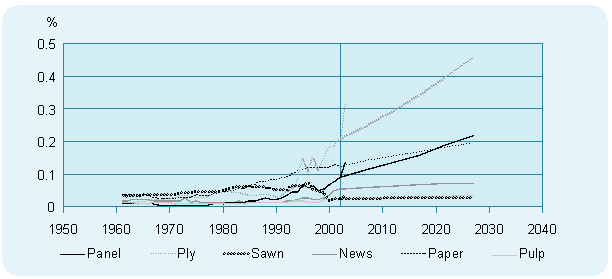
Figure 3 shows that, if we consider the global picture of industrial roundwood consumption, in the major products categories of panels, plywood, sawnwood and pulp, the trends are less clear except that sawnwood consumption is expected to decline. However, sawnwood is now below 40 percent share of global markets, whereas panels are expect to increase to over 20 percent of global market consumption.
Figure 3. Global Industrial Roundwood Consumption
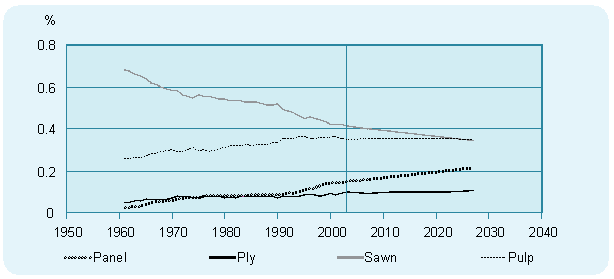
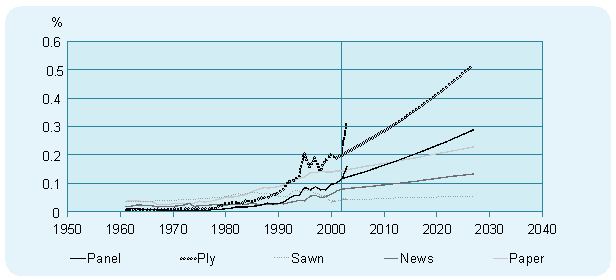
Figure 4 shows that China’s share of the world consumption is increasing in all wood product categories: panels, plywood, sawnwood, newsprint and paper. This means that China’s overall share will continue to increase.
Figure 4. China as a percentage of World Consumption
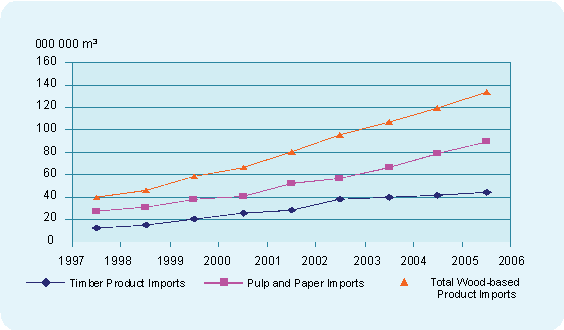
The import statistics in Figure 5 support the notion that China’s share of production and consumption is increasing. By 2005 the total wood product imports in RWE’s (roundwood equivalence) is nearly 140 million m3 from a mere 40 million in 1997.
Figure 5. Wood Products Import of China
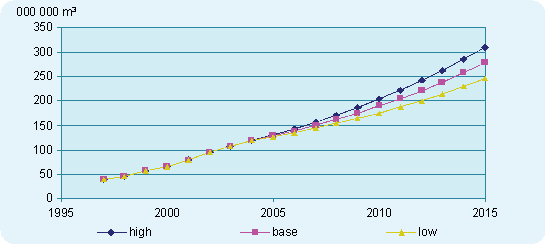
Further, if we create a trend line (see Figure 6) we can see that China’s imports are forecasted to increase to somewhere between 250 and 300 million m3 by the year 2015. This is a significant development at the global scale.
Figure 6. Import trends of China’s Wood Products
Looking within China, we can see that in the preceding Figures (1-6) there are other factors at play within China that are influencing domestic consumption and production.
On the supply side, it is clear that domestic roundwood removals are at least 350 million m3 and that the fuelwood portion could be anywhere from a low of 97 million m3 and a high of 191 million m3. Table 1 also summarizes the industrial fibre supply from non-industrial roundwood and the extend of legality in the wood used. It is very difficult to obtain a consistent picture of roundwood removal and to make sense of it, in light of the fact that the stated AAC (annual allowable cut) policy is for 223 million m3.
Table 1. Fibre supply [million m3]
Year |
Total |
Industrial |
Non - industrial |
Misc. |
Fuelwood |
1988 |
327 |
|
|
|
|
1990-94 |
c.298 |
116-132 |
64-62 |
20-18 |
97-86 |
1995 |
|
105 |
|
|
|
2001 |
|
81 |
|
|
|
2002 |
330 |
|
|
|
|
2003 |
320 |
~116 (illegal + 12(legal) |
~75 |
~20 |
~97* |
2004 |
345 |
|
|
|
|
Sources: Xu et al 2003; JP 2001; FAOSTAT 2004; Kunshan et al 1997;Zhu and Taylor 2003 as quoted in Bull and Nilsson 2004
To forecast the future domestic fibre supply is equally challenging. Bull and Nilsson (2004) stated that various sources report a total forest volume in the range of 10.2 to 13.0 billion m3 in all forest, whilst the figure for the timber forest (productive forest lands) is only 6.6 billion m3. Different assessments now suggest that the economic wood supply volume is at a maximum 2.2 billion m3, which at current harvest rates is likely difficult to maintain in a productive condition.
The challenge facing Chinese forestry is further supported by other assessments on the age of the forest where nearly 74% of the forest is classified as young to middle aged and only 16% is classified as mature or over-mature forest. This old forest is deemed unavailable for wood supply. The remaining 10% of the forest is classified as mature forest.
If plantations are the answer to the supply challenges there are further confounding statistics. While it is reported that plantation area is over 45 million ha in some studies, one authoritative source suggest only 5 million ha is currently fast growing and high yielding. With the growth rates given, these can only provide about 40 million m3/year in the fast growing areas and about 20 to 51 million m3 in the slower growing plantation areas.
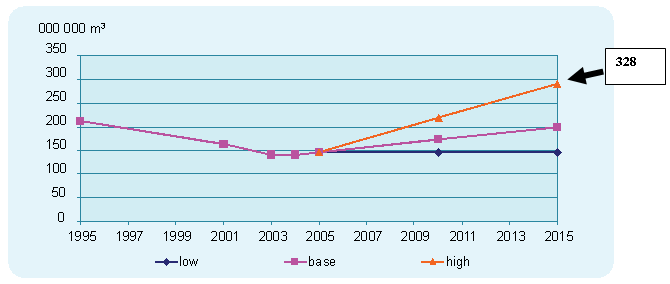
Figure 7 indicates both the official targets and some preliminary forecasts on industrial roundwood removal in China. The official forecasts for China indicate a target of 328 million m3 of wood to be removed by 2015 but none of our forecasts were able to meet that target. The official forecast indicates that the natural forest would provide 195 million m3 and the plantations 133 million m3.
Figure 7. Industrial roundwood removal forecast in China
In summary, there are several key factors to consider in relation to China’s domestic supply situation. These are: the high levels of immature forests; the extent of illegal logging (which is probably not incorporated into the official statistics); the extreme variability in the fuelwood consumption statistics; the low reported economic wood volumes; and the challenges facing the plantation areas to meet the volume targets sets. These supply factors, along with the clear evidence of growing consumption, explain why imports are rising and arel likely to continue to rise in the future, especially in some product categories.
Although not covered in this paper, there are other factors at play in assessing the future demand and supply situation for China. There are real pressures for competing land uses, the energy costs are high, water is not always available to industry and the transportation infrastructure is still variable.
To overcome these challenges, China continues to import more wood and wood products. It also continues to export more wood products. Finally, given the information available, it is also reasonable to postulate that China will need to import more logs in the near future.
Dr Sten Nilsson, Deputy Director and Forestry Program Leader of the International Institute for Applied Systems Analysis (IIASA), spoke about the current situation and trends relating to forests and the paper and wood industry in Russia, as well as links with other economies, in particular China.
The objective of the presentation was to give an overview of the development trends of the Russian forest sector and of the Chinese forest industry. At the end of the presentation statements were made regarding the global wood supply situation.
The overall Russian economy has stabilized with a GDP growth of around 6 percent per year on average during the last five years. The Russian economy is the fifteenth largest economy in the world. Its GDP per capita is growing substantially. But the country is still plagued by an inflation level of some 12 percent per year which, together with a strengthening of the rouble, has caused rouble-based costs to increase by 55 percent over the last four years. This is a very common situation in economies in transition or emerging economies, where the currency is undervalued. Based on the Purchasing Power Parity concept, it can be concluded that the rouble is substantially undervalued and upward pressure can be expected in the future. The real cost will go up; currently there will probably be more cash available in Russia, mainly due to oil income. Inflation is causing high interest rates and the high interest rates are pushing down investments. In the worst case, if this development continues, it could even result in bank crashes. There is a monitoring policy in Russia which aims at decreasing inflation but it is important to remember that Russia will not long remain a cheap output country.
Russia is also affected by decreasing population, which will have serious economic consequences if the trend is not reversed, particularly as regards work force and economic supply.
Production in forest industry has not been able to catch up with the 1990 production level and is still only about 40 percent of this level in some products. Forestry sector contribution to GDP is around 2.5 percent - far below that of 1997. Industrial forest production levels have increased substantially during the last seven years, except for lumber, as is shown in the following table.
Table 2. Production
1990 |
1998 |
2000 |
2002 |
2003 |
2004 |
2005 |
Difference | |
1998/2005 | ||||||||
Lumber (million m3) |
75 |
16 |
18 |
17 |
18 |
19 |
21 |
0 |
Plywood (1000 m3) |
1 597 |
1 102 |
1 484 |
1 808 |
1 978 |
2 233 |
2 550 |
2 |
Particleboard (1000 m3) |
5 568 |
1 568 |
2 335 |
2 732 |
3 198 |
3 603 |
3 930 |
3 |
Fiberboard (1000 m3) |
1 546 |
623 |
912 |
1 031 |
1 088 |
1 158 |
1 260 |
2 |
Paper/Board (1000 MT) |
8 325 |
3 595 |
5 312 |
5 921 |
6 377 |
6 789 |
7 020 |
2 |
Hardwood (million m3) |
|
|
|
|
2.4 |
2.6 |
3 |
|
There is a strong increase in the domestic demand for all products except lumber. There is a lack of information regarding saw logs. Lumber has decreased by 50%.
Table 3. Domestic Demand
1990 |
1998 |
2000 |
2002 |
2003 |
2004 |
Difference | |
|
1998/2004 | ||||||
Lumber (million m3) |
59.3 |
13.9 |
12.3 |
13.1 |
7.6 |
6.7 |
-52% |
Plywood (1000 m3) |
1 092 |
394 |
548 |
667 |
818 |
838 |
213% |
Particleboard (1000 m3) |
4 825 |
1 616 |
2 200 |
2 574 |
3 618 |
3 936 |
244% |
Fiberboard (1000 m3) |
1 020 |
451 |
694 |
795 |
1 156 |
1 210 |
268% |
Paper/Board (1000 MT) |
6 381 |
2 165 |
3 490 |
3 421 |
4 694 |
4 965 |
229% |
Exports have increased during this period but are dominated by low value added products, such as logs, lumber and particleboard. In 2005, 47 million m3 of logs were exported. At the same time, Russia has become a major importer of paper and paperboard.
The pulp and paper industry is very consolidated, with the top five companies producing over 40 percent of all pulp and paper products. The five largest paper producers account for 67 percent of production, the five largest pulp producers for 78 percent. Since 1990, there have not been many greenfield investments (only one paper machine and one pulp mill scheduled to go into operation in 2006). The future of the pulp and paper industry will be driven by the demand growth for printing and writing papers and paperboard. Western companies have a Latin American/Chinese focus at the expense of Russian investments. No greenfield investments are foreseen in paper making. Russia has become a substantial net importer of pulp and paper. The fibre cost is an important issue affecting competitivity.
Table 4. Export
|
1990 |
1998 |
2000 |
2002 |
2003 |
2004 |
2005 |
Difference 1998/2005 |
Lumber (million m3) |
15.7 |
4.6 |
7.8 |
8.9 |
10.2 |
12.2 |
14 |
+304% |
Plywood (1000 m3) |
527 |
737 |
973 |
1 140 |
1 201 |
1 438 |
1 530 |
+208% |
Particleboard (1000 m3) |
743 |
100 |
135 |
158 |
185 |
219 |
252 |
+252% |
Fiberboard (1000 m3) |
365 |
173 |
278 |
236 |
264 |
331 |
381 |
+22% |
Pulp (1000 MT) |
993 |
1 056 |
1 660 |
1 885 |
1 916 |
1 866 |
1 900 |
+18% |
Paper/Board (1000 MT) |
2 761 |
1 767 |
2 298 |
2 500 |
2 459 |
2 707 |
2 950 |
+167% |
Logs (million m3) |
31.4 |
20.0 |
30.8 |
36.5 |
37.5 |
40.9 |
47.3 |
+237% |
Table 5. Cost Breakdown (%)
Newsprint |
SC |
LWC |
UWF |
CWF | |
Variable Costs |
63 |
62 |
61 |
59 |
63 |
Fiber |
34 |
23 |
17 |
29 |
24 |
Minerals and Chemicals |
0 |
13 |
18 |
12 |
18 |
Energy |
15 |
12 |
13 |
6 |
10 |
Other Variable Costs |
14 |
14 |
13 |
12 |
12 |
Fixed Costs |
37 |
38 |
39 |
41 |
37 |
Personnel |
12 |
14 |
15 |
15 |
10 |
Other Fixed Costs |
26 |
24 |
24 |
27 |
26 |
Total Costs |
100 |
100 |
100 |
100 |
100 |
The forested area in Russia is some 776 million ha in total, most of this being in Asian Russia (about 605 million ha). There is a total growing stock of 82 billion m3. The annual increment is 1 billon m3 of which 7 hundred million are coniferous and 3 hundred million deciduous. As can be seen below, the increment in deciduous hardwood is substantially lower than for coniferous forest.
Table 6. Russia - all forest
Europe |
Asia |
Total | |
Forested Areas (million ha) |
170.3 |
605.8 |
776.1 |
Coniferous (million ha) |
106.5 |
438.4 |
544.9 |
Deciduous (million ha) |
63.8 |
167.4 |
231.2 |
Growing Stock (billion m3) |
22.9 |
59.2 |
82.1 |
Coniferous (billion m3) |
14 |
49.1 |
63.1 |
Deciduous (billion m3) |
8.9 |
10.1 |
19 |
Yearly Increment (million m3) |
426.2 |
567.9 |
994.1 |
Coniferous (million m3) |
274.9 |
421.1 |
696 |
Deciduous (million m3) |
151.3 |
146.8 |
298.1 |
The annual increment is around 1 billion m3, but the AAC (Annual Allowable Cut) is only about half of this (520 million m3) and the economically-accessible (long distance transportation cost), wood is assessed to be half of this (some 250 million m3). The current official harvest is about 180 million m3; the accessibility is substantially less.
The Russian government made a decision (number 158) on 24 March 2006 on new export taxes. The decision was published in the government’s newspaper “Russkaja gaseta” on 31 March. The new export taxes entered into force on 31 May 2006.
Figure 8. Russia remains low cost region
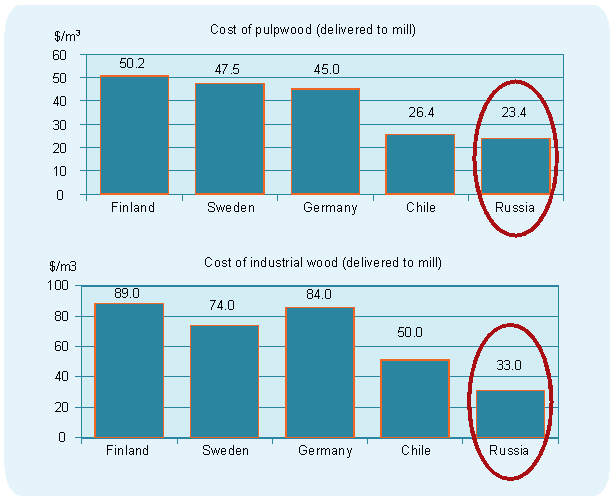
Figure 9. Low cost producer
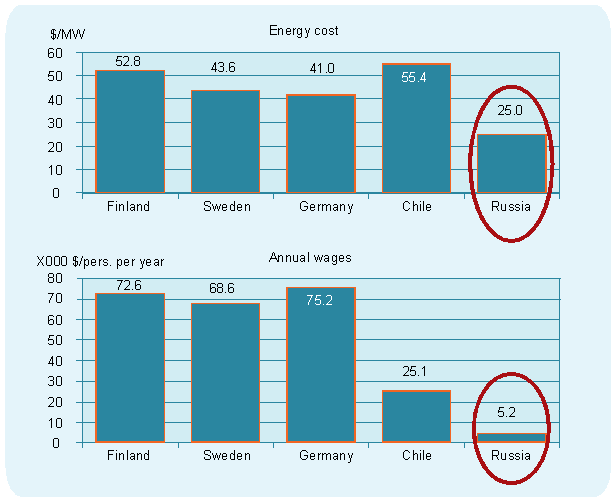
For logs with a top diameter >15 cm and length of >1 m: The minimum tax is 4 €/m3 or 6.5 percent of the sales value. For logs with a top diameter <15 cm and length of >1 m there is no tax. The possibility of increasing the above tax in 2007 to 6 €/m3 respectively 10 percent is under discussion. The focus is on incrementing value added wood products instead of exporting high quality wood. Still, this country is a low cost producer.
There are a number of positive aspects with respect to future development of the Russian forest sector. Russia is currently a low cost producer with low costs for wood, energy and wages but the costs are expected to increase in the future. Russia has a lot of unutilized forests and has proximity to important markets like China, Japan and Western Europe. There is potential for substantial reductions in production costs.
There are also many challenges facing the future development of the Russian forest sector. The forest sector is not particularly significant in the Russian economy and there is no overall strategy for the development of the sector. The existing Forest Code is a long-standing problem with unclear stakeholder responsibilities; a “forest war” is going on between the major pulp and paper companies; illegal logging is substantial; infrastructure deterioration is ongoing due to lack of investment in the sector, etc. But perhaps the most serious problems are those relating to governance of the sector. There is no transparency in the real ownership of the forest industry and there is a lack of institutions (in a broad sense) for a sustainable development of the sector. There are also concerns about the overall direction of Russia, with more and more centrally controlled planning.
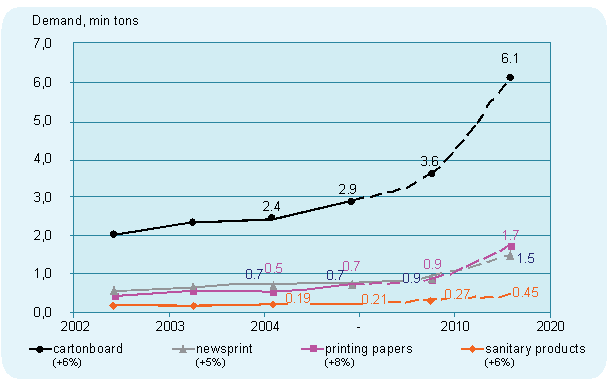
There are lots of opportunities for the sawmilling industry. Russia has a major low cost competitive advantage in solid wood products, though sometimes there are logistical problems. Strategic investors are wary due to the uncertainties illustrated above. In the long term, there will be substantial (foreign) investments for the development of the forest sector in Russia but when this will happen will depend on the governance/political/institutional conditions.
Figure 10. Printing papers and carton board will face the highest growth rate demand
Examples for recent investments:
• Amazur Pulp Mill, Chita Region - 400 000 MT
Chinese capital ― starting operation summer 2006
• Fevralsk Pulp Mill, Amur region ― 300 000 MT
Chinese capital
• Amursk Pulp Mill, Khabarovsk region ― 700 000 MT
Shopping Around in European Russia
• Mondi, StoraEnso, Metsä-Botnia
Some of the proposed incentives for investment are:
• Special Economic Zones (currently 20 proposals)
• Social tax 26 → 14 percent
• No wealth tax
• No property tax
• During 5 years no customs and taxes on imported goods
• Federal money for infrastructure
Mondi and International Paper have been successful in the pulp and paper sector, StoraEnso in wellpapp, SCA and P&G in tissue paper, and several other firms are making progress in the sawmilling industry (UPM, Swede Wood, StoraEnso, M-real).
Regarding future wood supply, hardly any substantial increased harvest is expected in the mid-term. Our most optimistic assessment is a maximum future harvest level of about 250 million m3. Taking into account the illegal logging already happening, an increased potential of 45–50 million m3 could be forecast, compared to the conventional wisdom figure of 500 million m3.
Under this agenda item, Mr Bull already discussed the forest resources and possible Chinese supply of industrial wood. The purpose of this presentation is to discuss the possible development of consumption and industrial production of forest products in China.
There is not one China, but many Chinas, with huge variations in education and disposable income. The rural population numbers some 800 million, out of a total population of 1 300 million. China’s population is ageing rapidly, which will cause problems for China in the near future. There has been remarkable economic growth and an increase in consumption in China, mainly due to increased globalization. But this remarkable growth is a product of only a handful of propulsive regions. There is no single national market because consumers are too dispersed, too inaccessible and too different. In addition, the economic statistics in China are weak. Therefore, average per capita measures of income and demand are quite meaningless as a forecasting tool for demand.
The Chinese pulp and paper industry can be divided into “new industry” - mills built after 1996 - mainly using wood fibres and imported fibre (wood pulp and recovered paper) and “old industry”. The latter refers to infrastructure built before 1996 and involves mainly non-wood fibres and domestic recovered paper. The production of paper and paperboard is of the same magnitude in both categories (nearly 20 million tons each). Only about 25 percent of the total fibre used is in the form of wood pulp, nearly the same amount is in the form of non-wood pulp, more than 20 percent is domestic recovered paper and some 33 percent is imported recovered paper.
The demand for paper and paperboard is expected to increase from 54.7 million tons in 2004 to 68.6 million tons by 2010. But imports are only expected to increase by about 1 million tons during the same period. This means that the rapidly growing demand will be taken care of by an increase in domestic production of nearly 15 million tons during this time period.
The demand for wood pulp is expected to increase by 5 million tons to 15 million tons in 2010. Over 50 percent of this demand will have to be imported. It is foreseen that the domestic production of wood pulp will increase substantially during this time frame and will reach nearly 7 million tons in 2010. There will be a rapid growth in the demand of recovered paper, which will reach about 35 million tons in 2010, of which half is expected to be imported.
There is considerable uncertainty about consumption and production of lumber in China. The demand estimates currently vary from 16–58 million m3 of lumber. The production numbers are similarly uncertain. RISI (2006) estimates the current demand for lumber to be about 20 million m3 and forecasts that demand will be over 40 million m3 in 2020. Thus, a steady growth in lumber consumption is foreseen. RISI (2006) assesses current production to be 15 million m3.
There is a fast growing increase in the demand for wood-based panels in China as well as a growth in production. The export of plywood is also growing fast and the export of furniture is currently in the magnitude of 10 million m3 RWE. The current import of forest products, expressed in RWE, is about 140 million m3. Forest Trends (2006) have assessed that imports of forest products to China by 2015 will be in the range of 200–600 million m3. The wide range is due to the uncertainties existing about future consumption and production in China, as discussed above. A substantial part of this will be in the form of roundwood. The challenging question is where the supply for these products will come from in 2015.
Recent fibre supply developments:
•ITTO (2006) assess that only 4.5 percent of permanent forest estates of the tropical forests are managed in a sustainable manner;
•CIFOR (2006) investigated pulp capacity investments since 1990 and found that limited attention was paid to the issue of sustainable supply. The due diligence documents did not discuss fibre supply. Of a sample of 1585 securities, research reports only 7 paid attention to wood supply. Many mills were established without any secure fibre supply;
•EU Energy Strategy (2006) makes reference to an additional contribution of bioenergy of 80 million ToE.
Mr Rajiv R. Vederah, Joint Managing Director of Ballarpur Industries Ltd. in India and President of the Indian Paper Manufacturers’ Association presented an analysis of the resurgent Indian economy and the trends of the paper industry, strengths and perspectives in the global context. He also presented a fibre demand scenario and analysis of the social-economic aspects.
It was mentioned that this country is the second fastest growing economy, it has moderate inflation, there is easy credit availability and it has the sixth highest foreign exchange reserves. In addition, India is rapidly moving towards a free market economy and is wel-integrated with the global economy. It shows promising consumer markets, an attractive level of foreign investment, as well as significant quantities of investment in industry’s infrastructure. Technology and knowledge is growing rapidly in the country. It presents a growing market for IT & ITES (Information Technology and IT Enabled Services), as well as growing self-belief and national pride.
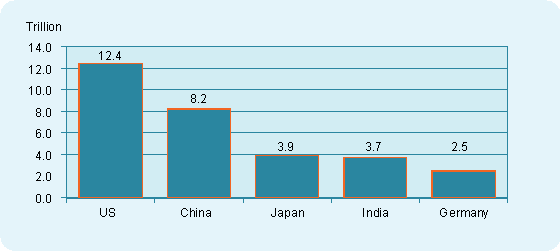
India is expected to have the world’s third largest GDP by 2020, and is already fourth largest contributor towards incremental global GDP Growth (3.2%), after USA (21.6%), China (9.4%) & Japan (6.4%) in 2005 in terms of purchasing power parity.
Figure 11. The five top economies (PPP) 2005 in Trillion US$.
India’s economic growth is sustained by its economic performance: an average of around 6.2 percent between 1991 and 2003; 6 percent from 2004-05; and nearly 8 percent in 2005-06, with, a forecast of sustained growth of over 8 percent p.a thereafter - very close to China’s value.
Services account for over 50 percent of GDP. Manufacturing sector grew 10 percent in 2005-06 and this country is the third most attractive destination for manufacturing, because polices are oriented to the manufacturing sector, in support, among others, of job creation.
Exports account for US$100 billion. The foreign exchange reserves amount to US$162 billion (incl. Gold & SDR).
A number of fiscal reforms have been put into place, as a response to globalization. For example, there has been rationalisation of the tax structure, both in direct and indirect ways, and a progressive reduction in peak rates of duties:
• Peak custom duty reduced to 12.5 percent;
• Corporate tax at 30 percent;
• Tariff to be aligned with ASEAN levels.
A value added tax was introduced on 1st April 2005 and the Rupee was made fully convertible on trade accounts.
NSE third largest, BSE fifth largest in terms of number of trades - by 2050 it is expected that India will become the 3rd growth economy. India has a well organized infrastructure, despite having a population of over a billion people.
At human resources level, it has a large education and knowledge sector:
• India’s competitive edge is its highly-skilled manpower;
• Over 380 universities (11 200 colleges);
• 1 500 research institutions;
• Over 200 000 engineering graduates;
• Over 300 000 post graduates from non-engineering colleges;
• 2 100 000 other graduates;
• Around 9 000 PhDs.
Knowledge workers in software industry increased from 56 000 in 1990-91 to 650 000 in 2003, and is forecast to reach 2 million by 2008. Due to its young demographic profile, India will continue to be surplus in working population for a long-time.
Figure 12. Economic Power
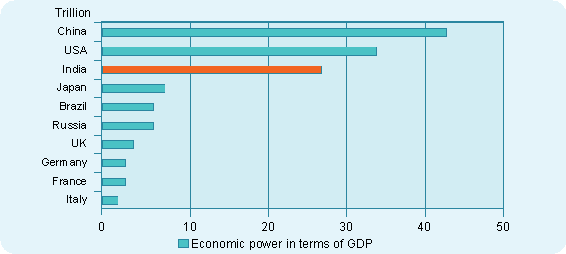
Source: Goldman Sachs
The paper industry has a long history in India. The first paper mill was established in 1832. It is a rural based industry with linkages to the agriculture/agro-forestry sectors. Latest developments include foreign participation in investments. Generally, the major challenge to government is the creation of new infrastructure for the entire sector.
Some of the key data is:
Industry turnover - US$3 725 Million;
Contributes over US$447 Million annually to exchequer;
The pulp and paper industry provides employment:
• to more than 0.3 million people directly;
• to 1 million people indirectly (engagement with agriculture activities).
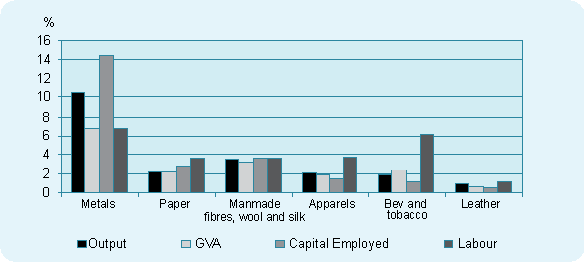
The paper industry has been improving its export performance continuously. New business models are being established due to penetration of technology and communications – IT, ITeS. The literacy rate in India is about 63 percent, and there is potential for paper consumption to increase since paper is the most important medium of education/communication. The country’s economic growth is expected to continue to increase and paper plays an important role. The education sector is forecast to grow exponentially and paper is an important vehicle to drive the national literacy mission in the country. This sector is also a great contributor to greening India, through its social farm forestry programme. It is progressively increasing the use of industrial paper for packaging, and encouraging many backward and forward linkages of ancillary industries. As can be seen in the following figure, the paper sector generates an important percentage of employment and labour, after the metal industry, generating economic wealth in the hands of the rural population.
Figure 13. Different Industrial Parameters
The following table shows the changing paradigms between the industry structure and the market place for the paper sector:
Table 7. Indian Paper Industry - Global Standing
Change in Industry Structure |
Change in Market Place |
Industry size, consolidation |
Rising customer expectation |
Standardization of Industry |
Imports to set the quality benchmarks |
Availability of raw material |
Players to offer a wide range of products |
Minimum efficient scale of production |
Product differentiation through Functional Brand Building |
Asset Quality |
Service Differentiation through wider reach and Just in Time delivery |
Quality Benchmarking |
Response time to crash |
Environmental considerations and standards |
Modernization of existing assets and capital needs |
Shut down of smaller, inefficient producers |
There is an aggressive portfolio addition comprising value-added variants, as well as the improvement of the quality of paper in terms of visual appeal and functional characteristics. Capacity expansion ranging between 15 000- 25 000 tons per annum is taking place in numerous medium scale paper mills, as is quality benchmarking with international standards. These industries are improving their technology to produce cleaner and brighter paper.
Figure 14. Sectors Functional Characteristics
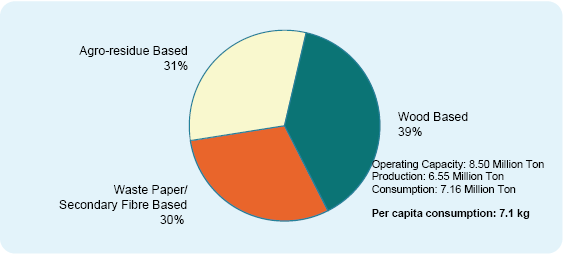
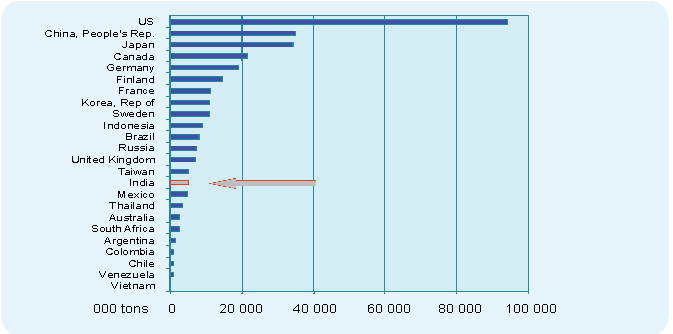
India ranks fifteenth among global paper producers and is nudging forward
Figure 15. P&B Capacity
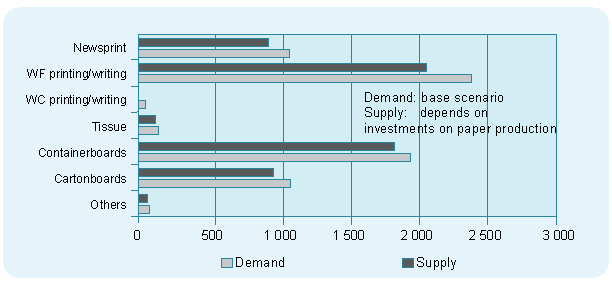
There is a market segmentation: the demand growth for paper is among the fastest in the world. The share of coated wood free paper in printing/writing is increasing rapidly; the packaging board demand growth is led by high-end bleached boards.
The total demand growth in 2000-2015 is expected to be 6.8 million tons. The supply is estimated to increase by about 6 million tons during the same period, depending on investments. Printing and writing paper and containerboard are expected to grow most. There are less than 0.2 million tons of decided projects and about 0.4 million tons of planned projects, i.e. the planning gap during the next 15 years would be well over 5 million tons.
Figure 16. Growth of paper supply/demand in India 2000-2015
Source: JC Consulting
The main growth drivers are economic growth reflected in the GDP. A rise in domestic demand is expected – a CAGR of 6.1 percent up to 2008-09; capacity expansion is estimated at only 3.1 percent over the same period. An education sector growth of 4% is expected: a budgetary provision for F.Y. 2006-07 by GoI: $5 481 million (increase of 31.5 percent). The writing and printing sector growth is forecast at 5.5% compounded up to 2008-09, and India has become a hub for high quality printing at competitive cost. There will be a progressive increase in the use of industrial paper for packaging of consumer goods and FMCG (Duplex 7.2 percent and Kraft 8.0 percent CAGR up to 2008-09).
The Indian paper industry uses a variety of raw material: wood/bamboo, recovered paper, bagasse, wheat straw, rice husk and others. A major deterrent to competitiveness and growth is the lack of raw material in the form of wood fibre. The annual availability of agro-residues is large.
Figure 17. Consumption pattern – past, present and future
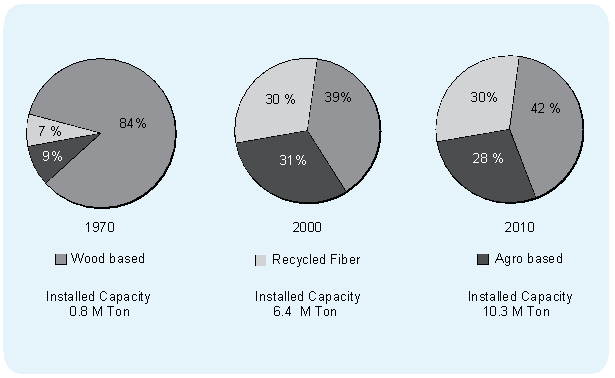
Table 8. Agro-residues
Agro Residue |
Million MT |
MT needed per MT of Pulp |
Pulp Potential (Million MT) |
Wheat Straw |
22 |
2.5-3.5 |
7.0 |
Rice Straw |
15 |
2.5-3.5 |
5.0 |
Bagasse |
10 |
5.0-6.0 |
2.0 |
Jute/Mesta/Kenaf |
2 |
- |
- |
Total |
49 |
|
14.0 |
Even though agro-residues as raw material have been a major source of fibre through which industry has grown in the past, this source may not be able to sustain the future growth of the industry, taking into account the quality of paper required, environmental issues involved, logistics, etc. Bagasse is increasingly used by sugar mills for co-generation of power and existing mills depending on agro residues are under threat of closure.
Waste and recovered paper: 50 percent of the industry’s requirements are met through imports, which are increasing. Current imports amount to 2 million tons, worth US$500 million. India lacks systems for collection, sorting and grading of waste paper for proper utilization. In India only about 20 percent of waste paper is currently being recovered.
Figure 18. Recovered Paper World =45 %
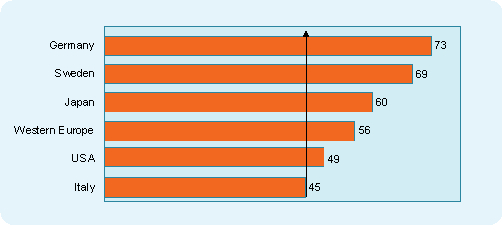
Source: PPI, CEPI, Swedish Forest Industries Federation. Figures refer to 2002
Wood: The final paper quality determines the raw material choice. Absence of sound raw material base prevents mills from growing in size to achieve economies of scale and attain global benchmarks. India’s current forest policy does not allow industrial plantation development by private sector on degraded forestland. Industry uses various species of hardwoods as raw material, due to the limited availability. Raw material constitutes 40 to 50 percent variable cost and it is one of the highest percent of variable cost in the world. India needs to resolve this issue effectively through industrial plantation policies so as to become a major global player.
Fuelwood: Demand: 280 Million MT Cumulative
Shortfall: 80 Million MT & growing
Pulpable wood: The paper industry’s demand for wood is expected to grow from 5.2 million tons in 2000 to 13.2 million tons by 2020/annum. Apprehended shortfall for the paper industry: 93 Million MT cumulative by 2020 (assuming that part of fibre needs will be covered by increasing use of recovered paper & agro residues).
Wood sourcing: The current requirement of virgin wood fibre as raw material is met from two main sources. The government source accounts for 20 percent (mostly bamboo) and non-government source covers 80 percent. The industry’s main development constraint relates to the sustainability and competitiveness of raw material sources, in the absence of proactive industrial plantation policies. As an alternative, many major mills have begun sourcing their raw material from agro-forestry sources.
Imports of Wood and Wood Products: 2004-05 - US$666.32 million
2005-06 - US$708.73 million => Growth 6.37%
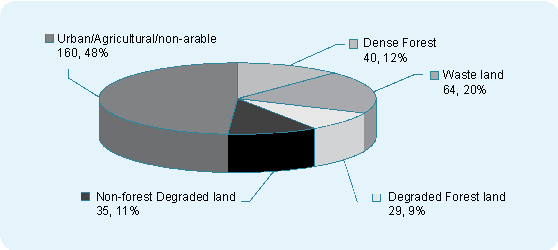
Land Status: Total geographical area: 328 million hectares.
40 million hectares dense forest (>40% crown density)
64 million hectares wasteland (Min. of Rural Development)
29 million hectares degraded forest land
35 million hectares non-forest degraded land (fragmented)
160 million hectares urban/agriculture/non-arable to feed people
Figure 19. Land Forestry Sector
India has a reserve of bamboo forest; it represents around 20 percent of the raw material used in the pulp and paper industries. Eighty percent is a mix of tropical wood, grown in marginal lands. The average land holding is only 1 ha per farmer. Farmers consume 20 million tons of firewood.
The national forest policies of 1894 and 1952 emphasised increase in forest cover, sustained yield management, meeting the needs of domestic and industrial forest raw material and earning revenue. The national Commission on Agriculture promoted tree cultivation outside forest to bridge the gap between supply-demand.
The forest conservation Act, 1980, curtailed powers of the State to de-reserve forestlands or assign them for non-forest purposes.
The national forest policy of 1988 was focused on conservation of biodiversity, liberalised wood import, and encouragement to social/farm forestry for industrial needs.
To meet the national target of 4 million ha until 2012, a significant annual increment is needed in forest and tree cover. The current status: 23 percent of forests cover (as quoted officially). The total investment required to meet the target is in the range of US$11 045 million
A multi-stakeholder partnership (MSP) is evolving with the objective of increasing existing resources. A legally enforceable Memorandum of Understanding partnership has been developed between company/user groups, public or private local community, forest department/land owning agencies and it is at an advanced stage for government’s consideration and approval.
The pulp and paper industry’s demand for raw material cannot rely on social/farm forestry alone. The industry needs 1.2 – 1.5 million ha of land suitable for forest plantations i.e. 4 - 5 percent of the total degraded forestland.
A clear industrial plantation policy will attract private sector investment in development of high-yielding sustainable plantations. The development of approx. 1.2 million ha will bridge the shortfall of raw material for the immediate future.
Agro-forestry promoted by the industry generates rural employment through nursery operations for plant production and distribution to farmers. The table below shows the total employment in the development of 1.2 million ha.
Table 9. Rural employment
Area of Plantation |
1.2 million ha |
Area of plantation in one year (12/7) |
0.172 million ha |
Average man/days over one rotation |
450 man/days |
Therefore, annual man/days required (450x0.172) |
77.4 million man/days |
Annual man/days required for harvesting 250x0.172 |
43 million man/days |
Total employment potential per annum |
120.4 million man/days |
The paper industry is the only large scale industrial sector capable of realising a low carbon energy balance, avoiding major changes to its primary production process. The adoption of more effective organisation of its existing bio-mass supply, improved energy efficiency and more sustainable waste management practices could yield hundreds of millions of carbon credits through CDM. On an average, production of 1 ADT of paper results in 0.67 ton CO2.2
There are two significant projects submitted by IPMA members. ITC Ltd. – 42 000 ha of plantation with a potential to sequester 10.7 million tons of carbon, reducing 39.3 million tons of CO2 having a carbon credit value of US$106 million in the first commitment period. TNPL – its bio-methanation project is the first CDM project implemented in the paper industry to generate 37 000 CERs a year. TNPL has about 82 955 CERs to its credit.
There is a cost benefit analysis study by CII on “Public private partnership in regreening of degraded revenue/private/forest land”; Forest Survey of India’s “State of Forests Report, 2003”; the World Bank’s Report “Unlocking Opportunities for Forest-dependent People in India”.
Option 1: Indian Industry imports pulp to manufacture paper
Option 2: Indian paper industry shuts down and India becomes a net importer of finished paper products
Option 3: The government provides enabling policy amendments for employment generation and sustainable supply of raw material for highly educated population through industrial plantations.
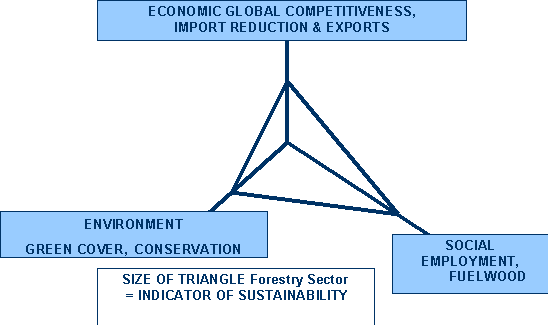
The paper industry needs to grow, needs to preserve the environment, make a better society.
1 Bull G.Q. and S. Nilsson. 2004. An assessment of China’s forest resources. International Forestry Review. 6(3-4): 210-220.
Katsigris E., G.Q. Bull, A. White, C. Barr, K. Barney, Y. Bun, S.Y. Chrystanto, F. Kahrl, T. King, A. Lankin, A. Lebedev, P. Shearman, A. Sheingauz, Y. Su, and H. Weyerhauser. 2004. The Chinese forest products trade: Overview of Asia Pacific supplying countries, impacts and implications. International Forestry Review. 6(3-4): 237-253.
Nilsson S., G.Q. Bull, A. White and J. Xu. 2004. Chinese forest policy: policy issues and recommendations. International Forestry Review. 6(3-4): 299-305.
Northway S. and G.Q. Bull. (forthcoming). An assessment of China-Indonesian trade in forest products.
White A., X. Sun, K. Canby, Xu J., C. Barr., E. Katsigris, G. Q. Bull, C. Cossalter and S. Nilsson. 2006. China and the global market for forest products: transforming trade to benefit forests and livelihoods. Forest Trends. Washington, D.C. Report available at: www.forest-trends.org/documents/publications/China%20and%20the%20Global%20Forest%20Market-Forest%20Trends.pdf
2 CEPI