![]()
![]()
![]()
S.L. Pringle
S. L. PRINGLE is in charge of economics in the FAO Forestry Department.
Over the past quarter century world output and consumption of tropical broadleaved industrial wood have increased rapidly more than four times. And during this period the relative geographic patterns of sources of wood, the locations of processing industries, the main centres of consumption and consequently, the trade flows for this wood, have also shifted greatly.
A separate estimate of wood from tropical moist forests is not readily available because reports on wood removals are recorded systematically by countries and product groups. However, an analysis of broadleaved species removals, or of countries that are predominantly tropical, approximates closely the harvest of wood from the moist tropical forests, at least for industrial woods. Nevertheless, there are notable additions from fuelwood from the tropical savannahs, logs from the dry deciduous forest, and pulpwood from plantations of exotic broadleaved species.
In Table 1, removals of tropical broadleaved species over the 1950-1973 period are shown in relation to all broadleaved species (including temperate species), conifers and total removals. It is very clear that broadleaved removals are becoming relatively more important and within this group, tropical woods are growing in importance. However, it must be recognized that a large portion of removals are for fuelwood, which is, for most countries, only crudely estimated, and that in this use category broadleaved species, and particularly those in tropical areas, are much more important.
Broadleaved fuelwood removals, for 1973, in predominantly tropical countries were estimated at 757 million m3, accounting for 30 percent of all wood removals and their estimated share of all removals has been growing rapidly. By contrast, coniferous fuelwood removals were declining from 192 million m3 in 1954 to 174 million m3 in 1975. This may be largely the result of improvement in statistical estimating, but the figures do show how important this category is in quantitative terms. The pressures in energy sources throughout the world, as well as the fact that in many local areas fuelwood is in critically short supply, stress the need to assess much more carefully the role of fuelwood on both local and national bases.
Much more attention has been directed, at the world level, to industrial wood use and the role that wood from tropical regions plays in supplying this category of material. Table 2 parallels Table 1 in showing, for industrial wood removals, a comparison by species group.
The more predominant role of coniferous species is readily evident but it is clear that the broadleaved species are growing in importance and that the tropical broadleaved component is growing most rapidly. This is occurring despite the fact that tropical broadleaved species have not, as yet, played a very important role in the most rapidly growing sub-category of industrial wood - the raw material for pulping and for the manufacture of particle board and fibreboard. This is, however, somewhat offset by the declining use of poles, pitprops, etc., in the temperate regions.
Table 3 shows the development of world removals of all industrial wood other than sawlogs and veneer logs. The relatively small role and stagnant relative position of tropical broad-leaved removals is obvious.
The pulpwood component of this group of removals has, on the world basis, grown very rapidly, more than doubling, from about 150 million m3 in 1954 to 312 million m3 in 1973, and grew to 340 million m3 in 1974. The residual component, poles, posts, etc., has grown slowly. However, this development has been restricted largely to the temperate regions. Of that shown as tropical broad-leaved, only six million m3 is pulpwood and over half of this is actually plantation wood of nontropical species. Thus, the great bulk of the tropical hardwood removals shown in this category is used for poles, posts and other miscellaneous roundwood purposes.
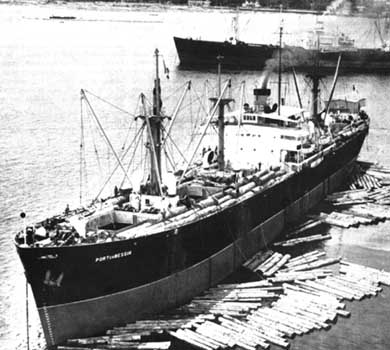
LOADING LOGS IN GABON shifting geographic patterns
In the category of logs for sawnwood, veneer and plywood, shown in Table 4, the increasing role of tropical broadleaved species is more striking than the increase for industrial wood as a whole.
It is interesting to compare the 1973 wood removals by wood species groups with the corresponding estimated growing stock - the volume of standing timber. This is done in Table 5.
Industrial wood removals are compared to the growing stock in closed forests only because sawlogs, veneer logs and much of the miscellaneous industrial wood - with some notable but relatively small exceptions - come from this type of forest. On the other hand, a great deal of the fuelwood originates in woodland outside the closed forest. Therefore, total wood removals, including fuelwood, are shown in the table in relation to the growing stock of closed forest plus woodland. The table clearly shows the following relationships:
1. The wide range of utilization rates in different regions and between fuelwood and industrial wood.2. The predominance of industrial wood in the removals from coniferous forests. (References: Erfurth, T. and Rusche, H., Marketing of Tropical Wood, A. Wood Species from African Tropical Moist Forests, FAO, 1976.)
3. The predominance of fuelwood in the removals from non coniferous forests in the tropical regions.
4. The relatively high level of removals from the non-coniferous forests of the temperate zones. (The references in 2 apply here as well.)
5. The reflection of lower utilization levels in the less accessible and more extensive forests of the U.S.S.R. (for conifers) and Latin America (for broadleaved species).
6. The high use intensity for Japan and Europe.
7. The relatively high use intensity of the Asia-Pacific region in relation to other tropical areas.
8. The intermediate position of North America for coniferous and of Africa for broadleaved species.
A most striking feature of Table 5 is the very low rate of industrial removals in the tropical broadleaved forest, especially in Latin America and Africa.
It is commonly recognized, however, that removals of industrial wood from areas being logged in the tropical moist forest are usually limited to a selected, and often small, portion of the growing stock, with many species, grades and sizes left unharvested. Sometimes, the residual stand may be left as permanent growing stock for future harvesting after a growing period. But much more frequently it is an unwanted noncommercial forest which makes unsatisfactory use of the land or which is abandoned to low intensity agricultural use. In some instances, such cut-over areas may become part of a reserve for future agriculture of a more intensive nature.
In the tropical rain forest of West Africa the growing stock may vary from 100 to 800 m3/ha. For large areas of mature forests, average growing stock lies between 250 and 300 m3/ha. However, the volume of commercial wood actually removed in logging ranges normally between 5 and 30 m3/ha, but may amount to 60 m3/ha in some cases (Erfurth and Rusche). The volume of trees above normal cutting diameters (about 60 cm) is much higher, in the range of 50 to 150 m3/ha. The discrepancy is made up of species currently unused or little used.
It should be noted that the substantial removals in the coniferous industrial category and in fuelwood, both coniferous and non-coniferous, shown for the other countries category results largely from China. The estimates of both removals and growing stock are by FAO (and it is possible that the relative high ratio of removals to growing stock is in error.)
TABLE 1. - WORLD REMOVALS OF WOOD
|
|
1950 |
1954 |
1960 |
1970 |
1973 |
|
million m3 |
|||||
|
Total |
1377 (100%) |
1745 (100%) |
2057 (100%) |
2389 (100%) |
2501 (100%) |
|
Coniferous |
716 (52%) |
858 (49%) |
947 (46%) |
1082 (45%) |
1122 (45%) |
|
Broadleaved of which |
661 (48%) |
887 (51%) |
1110 (54%) |
1308 (55%) |
1379 (55%) |
|
Tropical broadleaved |
255 (19%) |
472 (27%) |
642 (31%) |
829 (35%) |
904 (36%) |
TABLE 2. - WORLD REMOVALS OF INDUSTRIAL WOOD
|
|
1950 |
1954 |
1960 |
1970 |
1973 |
|
million m3 |
|||||
|
Total |
727 (100%) |
876 (100%) |
1036 (100%) |
1276 (100%) |
1345 (100%) |
|
Coniferous |
561 (77%) |
666 (76%) |
769 (74%) |
909 (71%) |
948 (70%) |
|
Broadleaved of which |
166 (23%) |
210 (24%) |
267 (26%) |
367 (29%) |
397 (30%) |
|
Tropical broadleaved |
36 (5%) |
57 (7%) |
72 (7%) |
121(9%) |
147 (11%) |
TABLE 3. - WORLD REMOVALS OF PULPWOOD AND MISCELLANEOUS INDUSTRIAL WOOD
|
|
1950 |
1954 |
1960 |
1970 |
1973 |
|
million m3 |
|||||
|
Total |
280 (100%) |
319 (100%) |
389 (100%) |
516 (100%) |
516 (100%) |
|
Coniferous |
223 (80%) |
251 (79%) |
282 (72%) |
360(70%) |
354 (69%) |
|
Broadleaved of which |
57 (20%) |
68 (21%) |
107 (28%) |
156(30%) |
162 (31%) |
|
Tropical broadleaved |
10 (4%) |
16 (5%) |
23 (6%) |
34 (7%) |
38 (7%) |
TABLE 4. - WORLD REMOVALS OF SAWLOGS AND VENEER LOGS
|
|
1950 |
1954 |
1960 |
1970 |
1973 |
|
million m3 |
|||||
|
Total |
447 (100%) |
557 (100%) |
647 (100%) |
760 (100%) |
832 (100%) |
|
Coniferous |
338 (76%) |
415 (75%) |
487 (75%) |
549 (72%) |
594 (71%) |
|
Broadleaved of which |
109 (24%) |
142 (25%) |
160 (25%) |
211 (28%) |
238 (29%) |
|
Tropical broadleaved |
26 (6%) |
41 (7%) |
49 (8%) |
87 (11%) |
109 (13%) |
TABLE 5. - WOOD REMOVALS, 1973, IN RELATION TO FOREST GROWING STOCK
|
Species Group |
Region |
Growing stock in closed forests |
Industrial wood removals |
Removals to growing stock1 |
Growing stock in forest and woodland |
Total wood removals |
Removals to growing stock1 |
|
1000 million m3 |
million m3 |
percent |
1000 million m3 |
million m3 |
percent |
||
|
All |
World |
287 |
1345 |
0.5 |
323 |
2501 |
0.8 |
|
Conifers |
World |
107 |
948 |
1.0 |
113 |
1122 |
1.1 |
|
Japan |
1.1 |
25 |
2.5 |
1.1 |
25 |
2.5 |
|
|
Europe |
9.5 |
200 |
2.3 |
9.5 |
212 |
2.5 |
|
|
N. America |
27 |
377 |
1.6 |
27 |
380 |
1.6 |
|
|
U.S.S.R. |
61 |
264 |
0.5 |
67 |
319 |
0.5 |
|
|
Other |
8.4 |
82 |
1.1 |
8.4 |
186 |
2.5 |
|
|
Broad leaved |
World |
180 |
397 |
0.2 |
210 |
1379 |
0.7 |
|
Temperate |
|
35 |
250 |
0.7 |
38 |
475 |
1.3 |
|
Japan |
0.9 |
117 |
1.9 |
0.9 |
18 |
2.0 |
|
|
Europe |
5.4 |
71 |
1.3 |
5.4 |
107 |
2.0 |
|
|
N. America |
9.5 |
86 |
0.9 |
9.5 |
100 |
1.1 |
|
|
U.S.S.R. |
12 |
34 |
0.3 |
12 |
64 |
0.5 |
|
|
Other |
7.5 |
42 |
0.6 |
10 |
186 |
1.9 |
|
|
Tropical |
|
145 |
147 |
0.1 |
172 |
904 |
0.5 |
|
Asia Far East |
25 |
87 |
0.3 |
27 |
406 |
0.5 |
|
|
Africa |
42 |
31 |
0.1 |
60 |
269 |
0.4 |
|
|
Latin America |
78 |
29 |
0.04 |
85 |
229 |
0.3 |
1 Coniferous growing stock reduced by 10% to allow for bark. No allowance made for non-coniferous as most estimates exclude bark.
In parts of insular Southeast Asia, the situation is much different, with a much larger portion of the growing stock in species currently desired. For example, in Sabah and parts of the Philippines and Indonesia, the dipterocarps make up about 80 percent of stand volumes. Here, the volume extracted per hectare may average 50 to 60 m3 with a range of 20 to 100 m3. In other parts of the region, the average volume extracted is lower, for example an average of about 40 m3/ha in West Malaysia. The unit area volumes of growing stock in Southeast Asia as a whole, are generally of the same order as in West Africa, but commercially suitable unit volumes may be higher.
A further contrast is provided by the Amazon forests which are very complex and heterogeneous. Even in areas which are relatively homogeneous and from which come much of the harvested industrial wood, the volume cut and logged out ranges, on the average, only from 5 to 10 m3/ha (IBDF).
The extension of the range of species, sizes and qualities presently utilized to encompass more of those existing in the forest is the basic problem preventing better management of the tropical moist forest - whether it is to be exploited, depleted and converted to other use or maintained as a continuing producing forest.
Latin America, which in 1950 accounted for nearly half the removals of tropical broadleaved industrial wood, supplied only 18 percent in 1973. Log exports have, for the region, never played a very important role, although sawnwood exports have grown quite rapidly and together with veneer and plywood exports may account for one tenth of log output. Not only Brazil, but also Paraguay, Colombia and Peru have made substantial contributions to the growth in processed exports. However, Latin America as a whole, is and has been predominantly a regional self-consumer of its log products, with most of the exports being intra-regional. Paraguay, which earlier had exported unprocessed logs to Argentina, has in the past few years upgraded these exports to the sawn form.
Following World War II, exports of tropical woods from West and Central Africa to Europe developed rather rapidly. Exports of and veneer logs grew very rapidly and by 1960 had reached a peak of far more than one half of production. Major contributors to the early growth of production and export were Gabon, Nigeria, Ghana and Zaire. By the early 1960s, log exports from Ghana and Nigeria had peaked and declined while their production and exports of sawnwood and plywood increased. The output of Zaire has remained fairly static. Gabon has continued to increase its output and export of logs while its exports of veneer and plywood expanded greatly. It was surpassed in the early 1960s by the rapidly growing log exports of the Ivory Coast which also has expanded its production and exports of sawnwood and veneer to become by far the most important African exporter of tropical wood products, ahead of Gabon and Ghana. Nigeria has maintained a high level of log output but has retained a rapidly increasing portion of its output for domestic use of sawnwood and plywood. The Congo has, over the past ten years or so, maintained an important position as an exporter of logs and veneer sheets. More recently, the Cameroons have joined the major exporters of logs and veneer sheets. From 1950 to 1974 Africa's share of tropical broadleaved industrial wood removals has remained at about one fifth of the world total.
It is in the Asia-Pacific region where the most spectacular changes in tropical wood industry and trade have occurred. The region's share of world industrial broadleaved removals has increased from about one third in 1950 to three fifths in recent years. Exports of logs have increased from a very low level in 1946 to about eight percent of log removals in 1950. By 1973, the export share had increased to well over one half, while exports of sawnwood, veneer and plywood accounted for another one fifth.
Sabah, Indonesia and the Philippines developed as log exporters in the late 1940s. Exports from the Philippines have dominated regional trade from 1950 until 1966 by which time the extremely rapid expansion in Sabah's exports, combined with those of Sarawak and West Malaysia, had made Malaysia the leading exporter of tropical non-coniferous logs in the world.
A number of other countries, including India, Thailand and Burma, have had substantial removals of tropical non-coniferous industrial wood but exports have been modest with relatively more of the output being directed to processing for domestic and export markets.
Since 1967, Indonesia has grown at a phenomenal rate as a log exporter reaching a peak in 1973. In the past decade, the Solomons, Papua New Guinea and other smaller islands, have developed log export trade.
Before 1950, early trade flows of importance were logs from West Africa to Europe, particularly to the United Kingdom and France, but also from Ghana and the Philippines to United States. Trade in processed products was small. In the early 1950s, these log trade flows grew with the Federal Republic of Germany becoming another major importer. During this period, exports of sawnwood from West Africa and Malaysia to the United Kingdom and from the Philippines to United States became important. But the most striking development was the very rapid development of log imports into Japan, primarily from the Philippines, as a raw material for sawnwood and plywood production with some of the sawnwood and a large portion of the plywood being exported to the United States, the United Kingdom and elsewhere. At the same time a substantial export of sawnwood from Malaysia, the Philippines and Thailand had developed. These developments intensified in the latter part of the 1950s with other European countries becoming major importers of logs.
Hong Kong also became a substantial importer of logs for processing for domestic use. At the same time, other East Asian countries, such as the Republic of Korea, were following the Japanese example and becoming log importers of' tropical non-coniferous logs, processing them into plywood, largely for export. Singapore, initially as part of Malaysia and subsequently as an independent country, has also followed this approach especially for sawnwood and also plywood. Japan's exports of sawnwood have been declining since 1964 and plywood since 1968, despite a continuing rapid expansion in production because of rapid growth in domestic consumption.
The most spectacular development in the region, however, has been the increase in Indonesia of non-coniferous sawlog and veneer log removals from 5 to 25 million m3 from 1967 to 1973, with a matching increase in exports of from 0.5 to about 20 million m3. However, non-coniferous sawnwood exports grew from a negligible base to only 138 thousand m3 and exports of veneer and plywood are still negligible. The vast majority of the logs went to Japan and other countries of temperate East Asia.
A small, but notable, recent development is the growth of pulpwood exports (to nearly one million m3), largely in the form of chips, from both East and West Malaysia to East Asia.
Tables 6 to 9 summarize, by major regions, the development of production, trade and consumption over the 1950 to 1974 period. The 1973 situation is emphasized in the tables as the recent peak of production and trade.
Table 6 summarizes, by major products, production and export for the three tropical producing regions. It should be noted that exporters of importing-processing countries such as Singapore and the Republic of Korea are excluded from the table.
Table 7 summarizes the developments in consumption of industrial broadleaved wood originating in predominantly tropical countries.
While output of tropical industrial broadleaved wood has quadrupled over the past quarter of a century, end-use consumption in the producing regions has grown less rapidly (to two and one half times). In the major importing regions, consumption has grown to 13 times its 1950 level.
It is in the category of logs for sawing and veneer production that the importing regions have increased their consumption of tropical hardwoods. In 1950, they accounted for roughly one fifth of consumption of total output. By 1973, they used well over half of the logs produced. By contrast, consumption in the other industrial wood class - composed mostly of poles, posts and some pulp wood - occurs almost entirely in the producing regions.
Table 8 shows from the major importing regions total consumption of industrial wood of all types and the portion which is supplied by tropical broadleaved species. It is seen that in all three regions, from 1950 to 1970, total consumption of industrial wood increased substantially although the rate of growth was most striking in Japan (over 300 percent) and most modest in the United States (35 percent increase). Europe, in an intermediate position (increase of over 100 percent), surpassed United States in consumption. All three regions show very rapid increases in imports of tropical woods. United States and Europe increased imports in 1973 to nine times the 1950 level but, in Japan, the 1973 level was more than 19 times 1950 imports of that country.
As a result of these developments, all three regions depend to a greater extent on tropical hardwood imports to satisfy the consumption levels. By 1973, more than one quarter of Japan's consumption was based on tropical hardwoods. In Europe, the share was 4.5 percent, but in the United States it was still under two percent. In all three regions tropical hardwoods comprise a growing share of a growing consumption but the relative dependence of the three regions is very different.
Table 9 shows, for major regions in the peak year of 1973 in log equivalent: (a) production, net trade and consumption of logs; (b) the utilization of logs for sawnwood, veneer and plywood and of net trade consumption of these products. This shows the details of source and product utilization corresponding to the 109 million cubic metres of "sawlogs, veneer logs and their products" portion of the 1973 consumption of Table 7. As the region "developing countries, importing and processing for export" is partly tropical and partly temperate, the country groupings of the two tables are not identical.
1. Only 55 percent of the log volume was processed in the primary tropical producing countries, while the rest was exported.2. Another 12 percent was exported to other developing countries for processing, with more than half of the processed volume being exported.
3. Japan imported the great bulk of its tropical wood consumed as logs, while North America imported essentially only processed wood.
4. Latin America processed nearly all of its logs and consumed the great bulk of the products in the region.
5. Tropical Africa consumed only one third of its output, with the great bulk being exported in the unprocessed form.
6. The Asia-Pacific region consumed a third of its output, exported a substantial portion as processed wood but exported well over half as logs.
7. The tropical regions' consumption was predominantly as sawnwood, while the temperate regions used well over half as veneer and plywood.
A number of major studies have considered future consumption of forest products and some of these have considered the possible role of tropical woods.
Japan, the largest consuming region, in an analysis (Japanese Ministry of Agriculture and Forestry, 1973) approved by the Cabinet Council in 1973, foresees consumption of industrial wood increasing from the 19691971 level of 100 million m3 to 153 million m3 in 2021, but estimates that domestic wood supplies will more than double in the same period to 94 million m3. This results in imports continuing to rise until about 1986, but subsequently falling. The imports requirements are indicated as 85 million m3 in 1981, 98 million m3 in 1991 but only 59 million m3 in 2021. There is no clear indication as to the type of product or species assortments foreseen to be imported but it might be expected that large logs, or products from them, will be the major requirements. The demand estimates are considerably more modest than those appearing in a 1971 market study prepared for FAO.
Work in progress on a Study of timber trends and prospects in the United Nations Economic Commission for Europe (ECE) Region, 1950-2000, indicates that, for Europe, there will be difficulty in meeting demand as projected to 2000 by increased domestic production, including use of residues and recycling, and imports combined. Preliminary estimates of possible imports from the existing tropical forest were set, for 2000, at 25 to 35 million m3 of roundwood equivalent, compared to the 17 million m3 imported in 1973.
The outlook for timber in the United States, published in 1973 by the U.S. Forest Service, foresee the 1970 consumption of 360 million m3 increasing to a 2000 consumption level of 546 to 645 million m3, according to the price assumptions made. About 30 percent of this is estimated as hardwood, with hardwood saw logs and veneer logs, or their products, making up 50 to 70 million m3. However, despite recent upward trends, imports of hardwoods are estimated to grow only modestly to a level of 11 to 17 million m3 by 2000, according to price assumptions.
Recent work on the tropical hardwood trade undertaken by the World Bank also projects demand for this category of wood. A study on the Asia-Pacific region (Takeuchi, 1974) projects demand to 1975, 1980 and 1985 from the 1968 level. The 1975 projections were surpassed by the 1973 peaks, but they over-estimate the reduced 1975 level considerably World requirements, for the log category, were projected to 123 and to 144 million m3 for 1980 and 1985 respectively, with 53 and 61 million m3 as the projected demand within the tropical producing areas themselves. A more recent study, still in progress, recognizes the 1973 consumption and projects to somewhat higher levels, except in the United States.
TABLE 6. - PRODUCTION AND EXPORT OF TROPICAL HARDWOOD LOGS AND THEIR PRODUCTS BY PRIMARY PRODUCERS*
|
|
1950 |
1960 |
1970 |
1973 |
1974 |
|
million m3 in product units |
|||||
|
PRODUCTION |
|||||
|
LOGS |
26 |
49 |
87 |
109 |
108 |
|
Asia-Pacific |
10 |
26 |
54 |
72 |
71 |
|
Latin America |
12 |
14 |
18 |
20 |
19 |
|
Africa |
4 |
9 |
15 |
18 |
18 |
|
SAWNWOOD * |
8 |
15 |
22 |
25 |
24 |
|
Asia-Pacific |
4.2 |
7.9 |
11.4 |
14.1 |
13.1 |
|
Latin America |
3.3 |
5.9 |
7.6 |
7.9 |
7.9 |
|
Africa |
0.7 |
1.6 |
2.6 |
2.9 |
3.0 |
|
VENEER, SHEETS * |
n.a |
0.2 |
0.6 |
1.1 |
1.1 |
|
Asia Pacific |
n.a |
0.1 |
0.2 |
0.5 |
0.5 |
|
Latin America |
n.a |
- |
0.2 |
0.2 |
0.2 |
|
Africa |
n.a |
0.1 |
0.1 |
0.4 |
0.4 |
|
PLYWOOD * |
0.3 |
0.7 |
1.9 |
3.0 |
2.9 |
|
Asia-Pacific * |
0.1 |
0.3 |
0.9 |
1.6 |
1.4 |
|
Latin America |
0.2 |
0.3 |
0.7 |
1.1 |
1.1 |
|
Africa |
- |
0.1 |
0.2 |
0.3 |
0.3 |
|
EXPORT |
|||||
|
LOGS |
2.6 |
12 |
35 |
49 |
43 |
|
Asia-Pacific |
0.8 |
6.7 |
28.1 |
40.3 |
36.2 |
|
Latin America |
0.5 |
0.3 |
0.4 |
0.5 |
0.2 |
|
Africa |
1.3 |
4.8 |
6.6 |
8.4 |
6.7 |
|
SAWNWOOD * |
1.2 |
1.8 |
3.1 |
4.6 |
4.4 |
|
Asia-Pacific * |
0.7 |
1.1 |
1.8 |
2.8 |
2.6 |
|
Latin America |
0.3 |
0.2 |
0.5 |
0.9 |
0.9 |
|
Africa |
0.2 |
0.5 |
0.8 |
0.8 |
0.9 |
|
VENEER SHEETS * |
- |
0.1 |
0.4 |
0.6 |
0.5 |
|
Asia-Pacific * |
- |
0.1 |
0.2 |
0.2 |
0.2 |
|
Latin America |
- |
- |
- |
0.1 |
0.1 |
|
Africa |
- |
- |
0.2 |
0.3 |
0.2 |
|
PLYWOOD * |
- |
0.2 |
0.8 |
1.0 |
0.6 |
|
Asia-Pacific * |
- |
0.1 |
0.6 |
0.8 |
0.4 |
|
Latin America |
- |
- |
0.1 |
0.1 |
0.1 |
|
Africa |
- |
0.1 |
0.1 |
0.1 |
0.1 |
* Does not include production and exports of countries importing logs, processing and exporting, e.g. Singapore and Republic of Korea.
TABLE 7. - CONSUMPTION BY REGION OF INDUSTRIAL NON-CONIFEROUS WOOD ORIGINATING IN TROPICAL COUNTRIES
|
Product Group and Region |
1950 |
1960 |
1970 |
1973 |
|
Log equivalent in million * |
||||
|
SAWLOGS. VENEER LOGS AND THEIR PRODUCTS TOTAL |
26 |
49 |
87 |
109 |
|
A. Major importing regions (Japan, N. America and Europe) |
4 |
13 |
36 |
53 |
|
Other importing regions |
1 |
2 |
4 |
5 |
|
Tropical Regions |
21 |
34 |
47 |
51 |
|
B. Total other industrial wood |
10* |
23 |
34 |
38 |
|
Major importing regions |
- |
- |
1 |
1 |
|
Tropical regions |
10* |
23 |
33 |
37 |
|
C. Total industrial wood and products |
36 |
72 |
121 |
147 |
|
Major importing regions |
4 |
13 |
37 |
54 |
|
Other importing regions |
1 |
2 |
4 |
5 |
|
Tropical regions |
31 |
57 |
80 |
88 |
* Now recognized as being substantially underestimated.
TABLE 8. - UTILIZATION OF TROPICAL TIMBER BY MAJOR IMPORTING REGIONS
|
|
1950 |
1960 |
1970 |
1973 |
|
Log equivalent in million * |
||||
|
APPARENT CONSUMPTION ALL INDUSTRIAL WOOD |
||||
|
Japan |
26.0 |
51.8 |
192.7 |
110.0 |
|
United States |
281 |
287 |
345 |
379 |
|
Europe |
a177.7 |
b241.6 |
c339.6 |
385.1 |
|
Total 3 regions |
485 |
580 |
787 |
874 |
|
TROPICAL TIMBER IMPORT EQUIVALENT INDUSTRIAL WOOD |
||||
|
Japan |
1.5 |
4.6 |
20.1 |
28.9 |
|
United States |
8.8 |
2.2 |
5.1 |
7.2 |
|
Europe |
a19 |
b6.2 |
c10.5 |
17.2 |
|
Total 3 regions |
4.2 |
13.0 |
35.8 |
53.3 |
|
SHARE IN PERCENT |
||||
|
Japan |
5.8 |
8.9 |
19.6 |
26 |
|
United States |
0.3 |
0.8 |
1.5 |
1.9 |
|
Europe |
1.1 |
2.6 |
3.1 |
4.5 |
|
Total 3 regions |
0.9 |
2.2 |
4.5 |
6.2 |
a 1949-51 average.
b 1959-61 average.
c 1969-71 average.
1 When 0.5 is used, the volume is indicated to the nearest one-half million tons.
2 Minus denotes exports, plus imports.Note: Relationship between columns:
(3) = (1) + (2)
(3) = (4) + (7)
(6) = (4) + (5)
(9) = (7) + (8)
(10) = (2) + (5) + (8)
(11) = (6) + (9)
(11) = (1) + (10)
A paper (Pringle, 1973), presented to the meeting of the German Foundation for International Development in collaboration with FAO, on "Properties, uses and marketing of tropical timber," projects trade of tropical broadleaved woods of the log categories to 1980 and 1990. It suggests 7-hat trade from the tropical timber producing regions to other regions of the world would grow to 75 and 100 million m3 in these years.
Recent projections by FAO, as yet only partly published, have been made for all regions and all products to 1981 and 1991.
On the basis of the projection reviewed above, Table 10 gives a set of tentative prospective "demand" estimates by decades to the end of the century. No attempt is made to distinguish consumption by type of product or to break down imports by degree of processing. It is, however, assumed that a rapidly increasing portion of logs will be processed at source. This point will be discussed later.
The production, and especially exports, of tropical broadleaved wood and its products have been heavily concentrated in a very few countries. Six countries, each with sawlog and veneer log removals in excess of five million m3, accounted in 1973 for more than 70 percent of total output, while another eight countries, with production over one million m3, raised the total to nearly 90 percent. Six countries alone accounted for nearly 90 percent of log exports, five for three quarters of sawnwood exports and tour, three of which are log importers, for 90 percent of plywood exports.
Fourteen tropical producing countries accounted for the bulk of production: Indonesia, Malaysia, Philippines, Brazil, India, Ivory Coast, Colombia, Thailand, Gabon, Ghana, Nigeria, Burma, Madagascar and Costa Rica. These, together with approximately 12 others, account for most of the world's tropical moist forest area and volume. A few of the latter group, including Zaire, Peru, Bolivia, Papua New Guinea and Cameroon, have considerable forest areas which, largely because of difficulties of access, have not made corresponding contributions to world production and export.
A review of country reports available indicates that in few instances has the long term production potential of the natural tropical forest been quantitatively assessed with respect to existing and prospective market situations. Basic to any sound appraisal of the long-term potential for supplying forest products from the tropical forest are national inventories of the forest providing by sub-areas volumes of standing timber by species, grade and size, together with an indication of harvesting accessibility. This must be confronted with a consideration of what volumes are being, and may be, removed under existing and potential market and administrative conditions. This needs to be supplemented with an appraisal of forest areas and volumes being lost to planned or uncontrolled expansion for agriculture and other land uses. Even this information is adequate only to assess the possibilities of a once-over exploitation. Any attempt to appraise the continuing forest prospects for production must recognize growth potentials by species, grade and size and the relation of this kind of information to actual and probable harvesting systems. Even the simplest of this kind of information is available for the tropical forest as a whole only in a very few countries, while the base for an adequate analysis is not believed to exist in any individual tropical country. The crude summary below may, however, assist in putting the situation of potential future production in broad perspective.
I. India, Nigeria, Ghana, Thailand and the Philippines are countries with long histories of tropical forest exploitation. They are traditional export suppliers with considerable processing facilities for both domestic and export markets. Their resources for expansion are now limited and attention is currently on processing for domestic needs and higher value exports.
II. Sabah (Malaysia), Gabon and Ivory Coast have seen extensive exploitation for export logs over the past one to two decades. They have been systematically worked over and the remaining unexploited areas are less accessible. The period for future exploitation at the current basis of cutting is fairly limited, i.e. a decade or two.
III. Colombia, People's Republic of the Congo, Zaire, Venezuela, Peru, Ecuador, Madagascar, Brazil, Indonesia, Sarawak (Malaysia), Peninsular Malaysia, Burma and Cambodia have experienced heavy exploitation in accessible areas but there remain considerable unexploited or little exploited areas.
IV. Papua New Guinea, Bolivia, Central Africa Republic and Cameroon have been little exploited as yet but are characterized by difficulty of access.
Unless there is a major change in the range of species and qualities reaching the market, it seems clear that countries in (a) the first group will not supply additional logs and that their export supply of tropical forest products will probably decline in volume, but not necessarily in value; (b) the second group will have a short continuing period of maintaining (or expanding) exports; (c) any major increase in supply and even a maintenance of existing levels must depend on the third and fourth groups.
Because of their remaining areas Indonesia, Zaire, Papua New Guinea and the Amazon basin are of special interest in assessing the long term potentials for production.
Some recent appraisals, although of a partial and tentative nature, have made some attempt to consider the forest potential and its possibilities of meeting medium and long-term demands.
Forest resources in the Asia and Far East Region (FAO, 1976) provides estimates by sub-regions, for 1970, 1980 and 1990, of annual net increment in, and estimated sustainable yields from, operable forests. This information for the four pertinent tropical sub-regions, South Asia, Continental Southeast Asia, Insular Southeast Asia and Oceania Developing, is derived for the operable natural forests in Table 10.
It will be noted that these potential yield estimates exceed considerably, for logs, the demand estimates shown in Table 11 for the Asia-Pacific region, even with Japan and the "rest of the world" categories added. This suggests a surplus balance for the tropical portion of the region. An FAO study now near completion on Forestry trends and perspectives in Asia and the Far East relates, by sub-region, the yield estimates to projected consumption, for 1990, and summarizes the findings as follows:
SOUTH ASIA - deficient in sawlogs and fuelwood.CONTINENTAL SOUTHEAST ASIA - surplus in undustrial roundwood and fuelwood.
INSULAR SOUTHEAST ASIA - industrial wood in surplus, fuelwood may constrain roundwood supply by 1990s.
TABLE 10. - PRESENT AND PROSPECTIVE WOOD SUPPLY SITUATION IN SOUTHEAST ASIA
|
|
1970 |
1980 |
1990 |
|
million ha |
|||
|
AREA OF OPERABLE NATURAL FORESTS |
228 |
180 |
146 |
|
Annual net increment (Industrial and fuelwood) |
|
|
|
|
Commercial species |
215 |
299 |
372 |
|
All species |
318 |
403 |
454 |
|
ESTIMATED SUSTAINABLE YIELD |
|
|
|
|
(includes wood from plantations which total 4, 19 and 43 million m3 in 1970, 1980 and 1990 respectively) |
|
|
|
|
LOGS |
|
|
|
|
Commercial species |
142 |
147 |
148 |
|
All species |
215 |
200 |
185 |
|
Pulpwood & Fuelwood (all species) |
150 |
156 |
170 |
|
Total logs, pulpwood, fuelwood (all species) |
365 |
356 |
355 |
The study also concludes that developing East Asia will be deficient in industrial roundwood, particularly for the re-export industry. These three tropical sub-regions show a considerable combined surplus (225 million m3) for industrial wood, but a combined deficit (20 million m3) for fuelwood.
An "Appraisal of Forest Resources of the Latin American Region," undertaken as a background study to "Trends and perspectives in forestry in Latin America: Interim Report," presented to the Twelfth Session of the FAO Latin American Forestry Commission, 1975, did not attempt any estimate of increment in the natural forest or of its sustainable potential because of lack of data. The interim report concluded: "A fuller appraisal of the forest sector in Latin America clearly requires information about how rapidly the resource is being depleted, and a better understanding of what balance between forest and agriculture would be desirable and possible, and between wood production and other uses within the forest. Only then will it be possible to assess how the remaining potential for supplying wood and non-wood outputs can best be employed to meet requirements, and to contribute towards achieving the development objectives of countries of the region."
Work in progress by Persson at the Swedish Royal College of Forestry, based on information collected through FAO, has attempted to assess the future production potential of African forests in relation to present and prospective demands upon them. Tentative appraisals, limited by the lack of data and the necessity to make a number of rough assumptions, lead to conclusions that the African forests, except possibly those of Zaire, will be hard pressed to supply even domestic requirements by the end of the century and that plantations will be needed to maintain essential supplies. The desirability of establishing processing industries is stressed.
In all three major tropical regions there is a very large amount of mixed tropical woods with a potential use for pulping. In general, quantity is not a limiting factor to greatly expanded utilization. The basic remaining problem appears to be an economic one of assuring a flow of a relatively uniform mix of the diverse species to pulp mills. Other technical papers deal with various aspects of the pulping use. Any overall assessment of the demand-supply situation must wait for further resolution of the situation.
Three main points emerge from this crude appraisal of the future potential of the world's tropical moist forest:
1. There are many areas where the forest contribution to world supply of sawlogs and veneer logs must level off or decline.2. There is urgent need to expand the range of species, grades and sizes utilized.
3. Knowledge of the remaining areas of potential production: is very limited and precludes any but a very rough consideration of long term potential.
Table 12 provides a very tentative suggestion of how the log supply and exports of logs or their products might be provided to match the demand requirements estimated in Table 11. Much of the export increase to 1980 and 1990 is suggested to come from the Asia Pacific Region with Indonesia and Papua New Guinea assumed to make major additions. Africa is assumed to maintain about the same level of exports with production increases going largely to supply regional demands. This is also assumed to be the situation for Latin America until 1990, after which it is assumed that increased world demands and higher prices may permit the more diverse species of the Amazon to make a larger contribution to world supply. In order for this supply pattern to emerge it is necessary that a much wider range of species, grades and sizes of tropical woods be utilized.
TABLE 11. - PROJECTED DEMAND FOR PRODUCTS OF TROPICAL HARDWOOD LOGS
(in log equivalent volumes)
|
REGION |
1973 |
1980 |
1990 |
2000 |
|
million m3 ® |
||||
|
TROPICAL PRODUCING REGIONS |
46.5 |
66 |
117 |
185 |
|
Asia-Pacific |
24 |
30 |
48 |
70 |
|
Latin America |
17 |
28 |
53 |
90 |
|
Africa |
5.5 |
8 |
16 |
25 |
|
IMPORTING REGIONS |
62.5 |
79 |
98 |
118 |
|
Japan |
28.9 |
35 |
38 |
40 |
|
Europe |
17.2 |
21 |
27 |
35 |
|
United States |
7.2 |
10 |
15 |
20 |
|
Rest of the world |
9.0 |
13 |
18 |
23 |
|
Total |
109 |
145 |
215 |
303 |
TABLE 12. - SUGGESTED SUPPLY OF TROPICAL HARDWOOD LOGS AND THEIR PRODUCTS
(in log equivalent volumes)
|
REGION |
1973 |
1980 |
1990 |
2000 |
|
Asia-Pacific |
72.5 (48.5) |
93 (65) |
130 (82) |
150 (80) |
|
Latin America |
20(3) |
32 (4) |
60 (7) |
118 (28) |
|
Africa |
16.5 (11) |
20 (12) |
25 (9) |
35 (10) |
|
Total tropical producing regions |
109 (62.5) |
149 (79) |
215 (98) |
303 (118) |
Unbracketed figures indicate log production; bracketed figures exports of logs or their products.
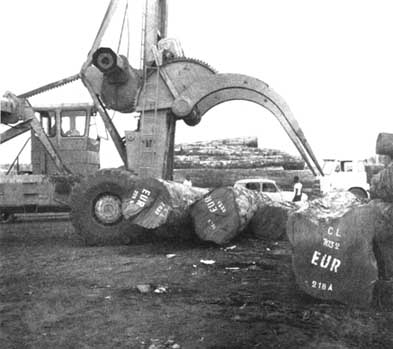
IVORY COAST MAHOGANY an important source of foreign exchange
Any appraisal of a demand and supply situation a quarter of a century in the future, is subject to a multitude of possible wrong assumptions and to an interpretation of trends which may be greatly transformed by technological innovations and by political decisions. The important and growing role of the tropical forest in supplying wood for the world demand clearly justifies a continuing monitoring and frequent reappraisal of future prospects and problems.
Exports of forest products have been important income-producers and earners of foreign exchange for the wood-rich tropical countries. Developing countries, as a whole, increased their value of forest products exports from an average of $277 million in 1953-55 to $3571 million in 1974. Of the 1974 export value, 84 percent resulted from the hardwood log products; non-coniferous logs (57 percent), non-coniferous sawnwood (14 percent) and veneer and plywood (13 percent) The great bulk of this export value - well over nine tenths - originated directly in wood exports from predominantly tropical countries, although a substantial portion (about $400 million) resulted from the processing and exporting, by developing countries of temperate east Asia, of plywood and sawnwood from imported non-coniferous logs. A substantial portion of the increase in export value came, however, from the price inflation of the 1973-1974 period. The average unit export value of non-coniferous logs from developing countries increased from $38.00 to $87.00 from 1972 to 1974, of non-coniferous sawnwood from $62.00 to $107.00, and plywood from $134.00 to $207.00.
In eight tropical countries, exports of forest products in 1974 exceeded $200 million and three more exceeded $ 100 million. Malaysia (including Sabah and Sarawak) led with $723 million, followed by Indonesia with $679 million. In Sabah and Gabon, with their small population of less than one million, forest products exports contributed respectively $482 and $279 per caput to income. In the Ivory Coast, the corresponding figure was $69.00, in Ghana $9.00, in Indonesia $5.00 and in Brazil $2.00.
Over the 1950 to 1974 period, the proportion of tropical hardwood log output which was processed in the source countries declined, although when account is taken of exports of the processor-exporter countries in the developing regions, the relative share of logs and of processed sawnwood, veneer and plywood imported by developed regions is little changed. Latin America, which contributes only a small portion of total exports, is an exception to the general pattern with an increasing portion of logs being processed in the countries of origin.
The export of logs is usually questioned as a policy which loses the value added by processing to the economy of the log producing country. The current level of value added is in the order of $30 to $50 per m3 of logs for sawnwood and veneer, and $40 to $80 per m3 of logs for plywood. It might be argued that the 49 million m3 exported unprocessed in 1973 from source countries might have brought another $2000 million or more to these countries in product value, while providing several hundred thousand man-years of employment, as well as infrastructure and mill capital. Also well known are many arguments supporting the logic of the existing trade pattern. Frequently, small populations limit the availability of skilled workers, the possibility of establishing infrastructure and a local market for standard grades of product. This may well be the case in Gabon or Sabah, for example.
How can the potential for supplying wood outputs best be employed to contribute toward achieving development objectives?
A major factor favouring the export of logs has, of course, been the tariff protection often provided to processors in the importing countries. Much of the effect of these barriers has, however, been overcome through the Generalized System of Preferences which favours developing countries. Logs and sawnwood tropical species have generally been free of tariffs. Tariffs on veneer sheets have been removed in many cases, but may still be appreciable and as high as 37.5 percent. Plywood, again, may be free of tariff, but rates as high as 50 percent are still in force and concessions have been less generous for this product. It should, however, be noted that the United States, which has had rather high tariffs on veneers and plywood, has been importing almost solely processed tropical wood products and practically no tropical logs.
The continuing existence of mills in the importing countries which are dependent on raw materials from outside has, of course, perpetuated the flow of logs. In recent years, however, there has been less tendency to establish such mills, except in a few countries of Southeast and East Asia which have had available skilled labour at relatively low wage rates.
In any event, it is becoming increasingly clear that the continued expansion of the magnitude of log exports at a rate equal to or faster than total exports, will not continue for long. Increasing portions of the growth in exports will be in the processed form and even existing levels of log exports will be reduced. It is important to note that the great bulk of the log export increase from 1970 to 1973 could be accounted for by Indonesia.
A number of recent developments will encourage processing at source. Notable among these are restrictions on log exports. Although approaches of this sort have been used in the past, they have frequently failed because of the general availability of alternative supply sources, international competition and a corresponding lack of political solidarity. Among recent restrictive actions have been complete bans (Nigeria, Philippines) or bans on particular species (Ghana) for log exports and the requirement of a certain level of processing by the concessionnaire.
Regional sub-groupings in Southeast Asia and in West Africa have recently been formed to encourage cooperation and coordinate policies in the tropical forest products trade. There appears little doubt but that their actions will work toward a higher proportion of processed products and a greater contribution to the national and regional economies.
![]()
![]()
![]()