I. WHAT FAO ACHIEVED
A. Overview of FAO Resources
17. The Programme Implementation Report includes a discussion of the sources and uses of resources during the biennium in relation to the delivery of products or services and what FAO achieved. This section summarises the evolution of available resources from all sources.
a) Evolution of total resources
18. Total expenditure in 2006-07 by source of funds, as reported in the financial accounts for the biennium was USD 1,775 million, USD 232 million (15.0%) higher than 2004-05. It is presented in Table 1 under the two accounting categories of “General and Related Funds” and “Trust Funds and the United Nations Development Programme (UNDP)”:
- General and Related Funds encompass activities funded from the Regular Programme appropriation and associated sources, including jointly financed investment activities, support costs and other assorted items;
- Trust Funds and UNDP comprise activities funded from all other extrabudgetary resources.
Table 1: Expenditure summary by source of funds (USD million)
| Funding source | 2004-05 | 2006-07 |
|---|---|---|
| General and Related Funds | ||
| Regular Programme expenditure (versus 2006-07 budget of USD 765.7 million) | 748.2 | 764.2 |
| Jointly financed investment activities | 26.7 | 32.3 |
| Support cost reimbursements (Trust Fund/UNDP) | 41.5 | 60.1 |
| Government cash contribution and other sundry income | 16.3 | 15.1 |
| TCP and capital expenditure facility adjustments (See table below) | 25.6 | (27.4) |
| Currency variance vs. budget rate* | 18.7 | 43.2 |
| Expenditure funded from arrears (Resolution 6/2001) | 31.3 | 0.0 |
| Other (explained below) | 0.0 | 38.0 |
| Subtotal | 908.3 | 925.6 |
| Trust Funds and UNDP | ||
| Trust Funds/UNDP (excluding emergency projects) | 395.3 | 464.5 |
| Special relief operations (emergency projects) | 239.5 | 384.5 |
| Subtotal | 634.8 | 849.0 |
| Total expenditures | 1,543.1 | 1,774.6 |
| * Currency Variance represents actual expenditure and actual other income adjusted to reflect the translation of Euro-denominated transactions at the budget rate of exchange rather than the UN operational rate of exchange in effect at the date of the transactions. | ||
19. Expenditure under General and Related Funds increased by USD 17.3 million (1.9%) over the previous biennium:
- the Regular Programme appropriation, while declining in real terms, had a 2.1% higher expenditure in 2006-07;
- jointly funded investment activities increased by USD 5.7 million (21.3%) in 2006-07;
- support cost reimbursements rose substantially, increasing by USD 18.6 million (45%), continuing the trend of 2004-05;
- the line entitled "TCP and Capital Expenditure Facility adjustments" includes the unspent TCP and Capital Expenditure Facility appropriations deferred from the previous biennium for expenditure in 2006-07 less the deferred income transferred to 2008-09 for these two items. As shown in Table 2, there was a net decrease in 2006-07 resources of USD 27.4 million, compared to a net increase of USD 25.6 million in 2004-05.
- the currency variance was USD 43.2 million unfavourable in 2006-07 compared to USD 18.7 million from 2004-05;
- the line “Other” consists of the following expenditure items: USD 14.3 million of salary increase for headquarters’ General Service staff (USD 6.4 million charged to the Special Reserve Account and USD 7.9 million funded by the contribution from the Russian Federation); USD 21.7 million of current service costs for After-service Medical Coverage (USD 13.4 million) and Terminal Payments (USD 8.3 million); and USD 2 million of Information Products Revolving Fund and Sundry.
Table 2: TCP and capital expenditure facility adjustments (USD million)
| Funding source | 2004-05 | 2006-07 | Change |
|---|---|---|---|
| Prior biennium's TCP appropriation transferred to current biennium | 62.0 | 36.4 | (25.6) |
| TCP appropriation deferred until subsequent biennium | (36.4) | (69.9) | (33.5) |
| Prior biennium's Capital Expenditure Facility resources deferred until current biennium | 0.0 | 8.9 | 8.9 |
| Capital Expenditure Facility resources deferred until subsequent biennium | 0.0 | (2.8) | (2.8) |
| Total | 25.6 | (27.4) | (53.0) |
20. Expenditure related to Trust Funds and UNDP increased by USD 214.2 million (33.7%), a dramatic rise from 2004-05:
- expenditure on non-emergency trust funds increased by USD 70.8 million (18.6%);
- emergency operations implementation increased by USD 145.1 million (60.6%), mainly as the result of Avian Influenza, Tsunami and other natural disasters;
- expenditure under UNDP continued to decline and delivery was only USD 13.5 million in 2006-07.
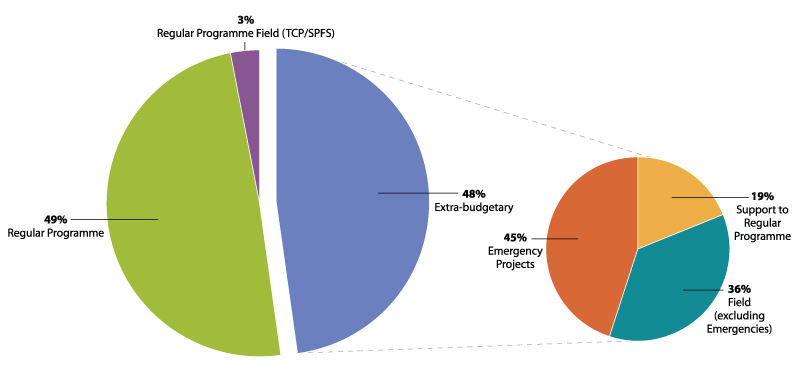
21. As shown in Figure 1, expenditure under the two sources of funding (Regular Programme versus extrabudgetary) was evenly split in 2006-07 (52% Regular Programme including TCP/SPFS, and 48% extrabudgetary). Within the extrabudgetary category, emergency projects accounted for the largest share in 2006-07, with non-emergency field projects close behind.
Figure 1: Regular Programme and extrabudgetary expenditure as a share of total expenditure in 2006-07
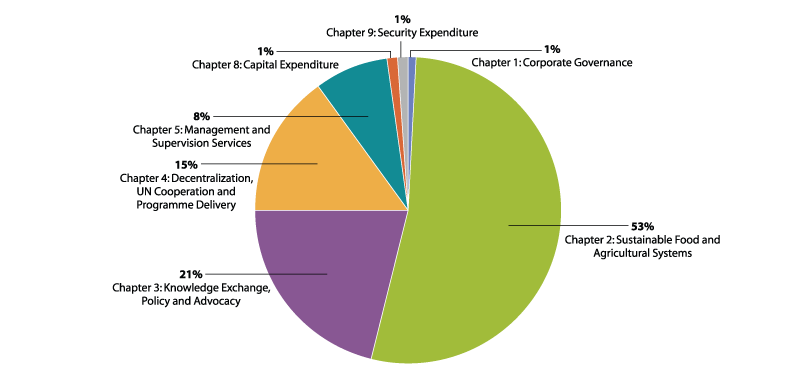
22. Total expenditure (Regular Programme and extrabudgetary) by budgetary chapter, as defined within the Revised Programme of Work and Budget 2006-07, is summarised in Figure 2. Chapter 2: Sustainable Food and Agricultural Systems and Chapter 3: Knowledge Exchange, Policy and Advocacy accounted for 74% of expenditure in 2006-07, with Chapter 4: Decentralization, UN Cooperation and Programme Delivery accounting for an additional 15%.
23. The remaining 11% falls under corporate governance (Chapter 1), management and supervision services (Chapter 5), contingencies (Chapter 6), capital expenditure (Chapter 8) and security expenditure (Chapter 9).
Figure 2: Distribution of total expenditure by chapter, 2006-07
b) General and related funds
24. The 2006-07 Programme of Work included the projected availability of resources from other income, which comprises voluntary contributions that are largely at the disposal of the Organization and managed closely with the Regular Budget appropriation. The inclusion of other income in the Programme of Work provides a more complete picture of the resources associated with the work being undertaken. However, changes in income versus the budgeted levels during programme implementation require corresponding changes in expenditures in order to conform to the approved budgetary appropriation, adding some uncertainty and complexity to the financial management of the appropriation.
25. The 2006-07 Programme of Work and the adjustments made during its implementation are shown in Table 3: Programme of Work, Budgetary Transfers and Performance, 2006-07. Resources planned in the PWB 2006-07 totalled USD 856.8 million, USD 765.7 from the Regular Programme appropriation and USD 91.1 million from other income (after adjusting for those income types that are accounted as Trust Funds in the accounts of the Organization).
26. The implementation of the Programme of Work inevitably diverges from that planned, as the result of factors such as unforeseen and unbudgeted inflation and other costs as well as shifts in priorities reflecting the changing external environment and the Organization’s efforts to respond to Members' most pressing needs. Programme implementation during 2006-07 was further complicated as the result of the introduction of a new programme structure and the need to prepare a Revised Programme of Work and Budget 2006-07 for approval by the governing bodies at the beginning of the biennium.
27. Actual expenditure in 2006-07 was affected by two large unbudgeted items, namely a significant unfavourable staff cost variance (USD 23.3 million) and redeployment costs for incumbents of abolished posts (USD 11.5 million). The underbudgeted costs were covered from within the Regular Programme appropriation partially through the re-allocation or adjustment of budgeted resources presented to the governing bodies (e.g. redirection of budgeted decentralized resources due to progressive implementation of new decentralized structures) and partially through imposed reductions to the Regular Programme allotments and savings arising from vacant posts.
28. The financial regulations of the Organization require that all transfers of the Regular Programme appropriation between chapters of the PWB are approved by the Finance Committee. Accordingly, at its sessions in May and September 2007 and May 2008, the Finance Committee reviewed and approved transfers between budgetary chapters. The final transfers required were from Chapters 2, 4 and 9 in favour of Chapter 1 (USD 1.7 million), Chapter 3 (USD 1.6 million), Chapter 5 (USD 0.35 million) and Chapter 8 (USD 1.7 million). The final Regular Programme chapter transfers into Chapters 1, 5, and 8 fell within the levels previously approved1, while an additional transfer was required into Chapter 3: Knowledge exchange, policy and advocacy. Overall, the final Programme of Work reflected an increase of USD 22.5 million as the result of higher than planned income received during 2006-07.
29. Income earned was USD 113.6 million (including USD 6.1 million of deferred income for Capital Expenditure) and overall net expenditure against the Regular Programme appropriation of USD 765.7 million was USD 764.2 million. The surplus balance of USD 1.5 million against the 2006-07 appropriation was re-apportioned to cover to the extent possible the excess terminal payments in 2006-07, as requested by the Finance Committee2.
30. Total expenditure of USD 877.8 million against the final 2006-07 budget compares with USD 925.6 million reported as General and Related Funds expenditure in the draft financial accounts. The figures in the table comprise only those items of expenditure in the financial accounts that are chargeable to the 2006-07 PWB. Specifically: i) it excludes USD 1.9 million of expenditure incurred by the Information Products Revolving Fund as a separate fund is established for this purpose under Financial Regulation 6.9; ii) it excludes USD 36.1 million unbudgeted salary increase for headquarters’ General Service staff, unbudgeted current service cost for after-service medical plan and terminal payments, and iii) it adjusts the expenditure of the TCP so that the entire 2006-07 TCP appropriation is assumed to be spent, since unutilised balances will remain available for obligations in 2008-09, in accordance with Financial Regulation 4.3.
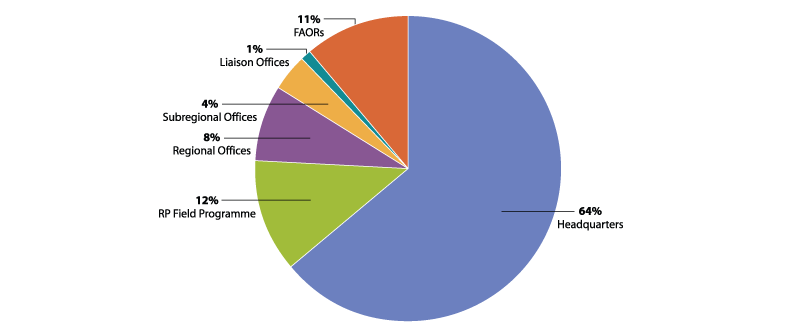
31. The share of Regular Programme expenditure between headquarters and decentralized offices is shown in the figure below. Headquarters accounted for 64% of total expenditures in 2006-07, 1% lower than in 2004-05 due to further decentralization. Field programme expenditures related to TCP and SPFS, which are funded from the Regular Programme, were 12% in 2006-07 (as compared to 13% in 2004-05). As regards various decentralized locations: FAORs increased from 10% to 11% mainly as a result of increased staff costs; subregional offices increased from 3% to 4%, due to the expansion of the number of subregional offices in the Africa region; regional offices remained at 8% and liaison offices at 1%.
Figure 3: Expenditure at headquarters and decentralized offices, 2006-07
32. The resource table preceding each programme in the Web Annex 4: Supplementary information on what FAO achieved, provides information on expenditure against the Programme of Work adjusted to account for actual income. These tables also indicate extrabudgetary resources that supplemented the Regular Programme as well as field programme resources associated with the programme.
Table 3: Programme of Work, Budgetary Transfers and Performance 2006-07 (USD '000)
| 2006-07 Programme of Work | 2006-07 Expenditure | 2006-07 Variance: Budget less Expenditure/Income | |||||||||
|---|---|---|---|---|---|---|---|---|---|---|---|
| CH/ PR | Programme | Programme of Work | Income | Net Appropriation | Programme of Work Budget Rate Expenditure | Actual Income | Net Expenditure | Programme of Work (Over)/Under | Income Over/(Under) | Appropriation (Over)/Under | Approved Chapter Transfer (Net) |
| 1A | Governing bodies | 7,794 | (0) | 7,794 | 9,278 | 81 | 9,197 | (1,484) | 81 | (1,403) | |
| 1B | General direction | 9,814 | 214 | 9,600 | 10,466 | 492 | 9,974 | (652) | 278 | (374) | |
| 1X | Programme Management | 714 | (0) | 714 | 376 | (0) | 376 | 338 | 0 | 338 | |
| 1 | Corporate Governance | 18,322 | 214 | 18,108 | 20,120 | 573 | 19,547 | (1,798) | 359 | (1,439) | 1,700 |
| 2A | Crop production systems management | 20,165 | 323 | 19,842 | 20,269 | 1,055 | 19,214 | (104) | 732 | 628 | |
| 2B | Livestock production systems management | 8,498 | 433 | 8,065 | 8,612 | 620 | 7,992 | (114) | 187 | 73 | |
| 2C | Diseases and pests of animals and plants | 23,869 | 423 | 23,446 | 25,476 | 2,022 | 23,454 | (1,607) | 1,599 | (8) | |
| 2D | Nutrition and consumer protection | 23,696 | 1,428 | 22,268 | 24,345 | 2,079 | 22,266 | (649) | 651 | 2 | |
| 2E | Forestry information, statistics, economics, and policy | 11,281 | 253 | 11,028 | 11,227 | 383 | 10,844 | 54 | 130 | 184 | |
| 2F | Forest management, conservation and rehabilitation | 8,234 | 82 | 8,152 | 7,938 | 429 | 7,509 | 296 | 347 | 643 | |
| 2G | Forest products and industry | 8,899 | 176 | 8,723 | 8,536 | 39 | 8,497 | 363 | (137) | 226 | |
| 2H | Fisheries and aquaculture information, statistics, economics, and policy | 17,858 | 623 | 17,235 | 17,418 | 704 | 16,714 | 440 | 81 | 521 | |
| 2I | Fisheries and aquaculture management and conservation | 12,915 | 482 | 12,433 | 13,228 | 997 | 12,231 | (313) | 515 | 202 | |
| 2J | Fisheries and aquaculture products and industry | 9,248 | 880 | 8,368 | 8,918 | 773 | 8,145 | 330 | (107) | 223 | |
| 2K | Sustainable natural resources management | 28,808 | 989 | 27,819 | 30,421 | 1,941 | 28,480 | (1,613) | 952 | (661) | |
| 2L | Technology, research and extension | 5,972 | 4 | 5,968 | 5,905 | 144 | 5,761 | 67 | 140 | 207 | |
| 2M | Rural infrastructure and agro-industries | 15,721 | 317 | 15,404 | 16,289 | 728 | 15,561 | (568) | 411 | (157) | |
| 2X | Programme Management | 21,003 | 160 | 20,843 | 19,803 | 223 | 19,580 | 1,200 | 63 | 1,263 | |
| 2 | Sustainable Food and Agricultural Systems | 216,167 | 6,573 | 209,594 | 218,385 | 12,137 | 206,248 | (2,218) | 5,564 | 3,346 | (3,300) |
| 3A | Leveraging resources and investment | 50,579 | 26,303 | 24,276 | 57,980 | 34,869 | 23,111 | (7,401) | 8,566 | 1,165 | |
| 3B | Food and agriculture policy | 30,296 | 1,416 | 28,880 | 30,461 | 1,792 | 28,669 | (165) | 376 | 211 | |
| 3C | Trade and markets | 11,899 | 322 | 11,577 | 11,308 | 331 | 10,977 | 591 | 9 | 600 | |
| 3D | Agriculture information and statistics | 10,719 | 136 | 10,583 | 11,537 | 454 | 11,083 | (818) | 318 | (500) | |
| 3E | Alliances and advocacy initiatives against hunger and poverty | 11,819 | 172 | 11,647 | 12,216 | 546 | 11,670 | (397) | 374 | (23) | |
| 3F | Gender and equity in rural societies | 9,400 | 528 | 8,872 | 9,730 | 609 | 9,121 | (330) | 81 | (249) | |
| 3G | Rural livelihoods | 4,119 | 137 | 3,982 | 3,822 | 298 | 3,524 | 297 | 161 | 458 | |
| 3H | Knowledge exchange and capacity building | 22,252 | 58 | 22,194 | 22,861 | 265 | 22,596 | (609) | 207 | (402) | |
| 3I | Information technology systems | 28,952 | (0) | 28,952 | 31,432 | 172 | 31,260 | (2,480) | 172 | (2,308) | |
| 3J | Communication and public information | 18,069 | (0) | 18,069 | 18,241 | 81 | 18,160 | (172) | 81 | (91) | |
| 3X | Programme Management | 20,312 | 204 | 20,108 | 20,626 | 45 | 20,581 | (314) | (159) | (473) | |
| 3 | Knowledge Exchange, Policy and Advocacy | 218,416 | 29,276 | 189,140 | 230,214 | 39,462 | 190,752 | (11,798) | 10,186 | (1,612) | 1,600 |
| 4A | UN cooperation, integration and monitoring | 13,679 | 815 | 12,864 | 13,814 | 869 | 12,945 | (135) | 54 | (81) | |
| 4B | Coordination of decentralized services | 20,306 | (0) | 20,306 | 19,382 | 214 | 19,168 | 924 | 214 | 1,138 | |
| 4C | Food security, poverty reduction and other development cooperation programmes | 86,092 | 22,933 | 63,159 | 90,986 | 25,126 | 65,860 | (4,894) | 2,193 | (2,701) | |
| 4D | Emergency and post crisis management | 1,684 | 721 | 963 | 1,839 | 663 | 1,176 | (155) | (58) | (213) | |
| 4E | Technical Cooperation Programme | 103,550 | (0) | 103,550 | 100,581 | (0) | 100,581 | 2,969 | 0 | 2,969 | |
| 4X | Programme Management | 13,898 | 2,061 | 11,837 | 13,261 | 1,771 | 11,490 | 637 | (290) | 347 | |
| 4 | Decentralization, UN Cooperation and Programme Delivery | 239,209 | 26,530 | 212,679 | 239,863 | 28,643 | 211,220 | (654) | 2,113 | 1,459 | (1,600) |
| 5A | Oversight | 11,260 | 454 | 10,806 | 12,243 | 1,066 | 11,177 | (983) | 612 | (371) | |
| 5B | Programme and budget services | 7,013 | 822 | 6,191 | 8,200 | 1,050 | 7,150 | (1,187) | 228 | (959) | |
| 5C | Financial services | 17,270 | 6,286 | 10,984 | 17,682 | 7,258 | 10,424 | (412) | 972 | 560 | |
| 5D | Human resources management and staff welfare | 16,812 | 2,426 | 14,386 | 18,548 | 2,723 | 15,825 | (1,736) | 297 | (1,439) | |
| 5E | Procurement | 8,901 | 3,240 | 5,661 | 10,442 | 5,245 | 5,197 | (1,541) | 2,005 | 464 | |
| 5F | Management of premises | 33,454 | 1,159 | 32,295 | 32,575 | 2,881 | 29,694 | 879 | 1,722 | 2,601 | |
| 5G | Meetings and language services and protocol | 7,882 | 126 | 7,756 | 7,759 | 207 | 7,552 | 123 | 81 | 204 | |
| 5H | Shared services | 19,641 | 5,119 | 14,522 | 22,474 | 6,159 | 16,315 | (2,833) | 1,040 | (1,793) | |
| 5X | Programme Management | 7,865 | 40 | 7,825 | 7,387 | 38 | 7,349 | 478 | (2) | 476 | |
| 5 | Management and Supervision Services | 130,098 | 19,672 | 110,426 | 137,310 | 26,627 | 110,683 | (7,212) | 6,955 | (257) | 350 |
| 6A | Contingencies | 600 | (0) | 600 | 149 | (28) | 177 | 451 | (28) | 423 | |
| 6 | Contingencies | 600 | (0) | 600 | 149 | (28) | 177 | 451 | (28) | 423 | 0 |
| 8A | Capital Expenditure | 13,575 | 8,851 | 4,724 | 12,484 | 6,081 | 6,403 | 1,091 | (2,770) | (1,679) | |
| 8 | Capital Expenditure | 13,575 | 8,851 | 4,724 | 12,484 | 6,081 | 6,403 | 1,091 | (2,770) | (1,679) | 1,700 |
| 9A | Headquarters security | 7,989 | (0) | 7,989 | 8,314 | 61 | 8,253 | (325) | 61 | (264) | |
| 9B | Field security | 12,455 | (0) | 12,455 | 10,977 | 44 | 10,933 | 1,478 | 44 | 1,522 | |
| 9X | Direction and Support Services | 0 | 0 | 0 | 0 | 0 | 0 | 0 | 0 | 0 | |
| 9 | Security Expenditure | 20,444 | (0) | 20,444 | 19,291 | 105 | 19,186 | 1,153 | 105 | 1,258 | (450) |
| TOTAL | 856,831 | 91,116 | 765,715 | 877,816 | 113,600 | 764,216 | (20,985) | 22,484 | 1,499 | 0 | |
c) FAO field programme and extrabudgetary support to Regular Programme delivery
33. FAO’s total field programme and extrabudgetary support to Regular Programme delivery reached USD 896.5 million, an increase of 24% over 2004-2005 (see Table 5). This was mainly achieved through increased delivery under GCP, UTF, FAO partnership programmes and emergency and rehabilitation activities, while delivery funded by UNDP continued to decline.
34. During 2006-2007, the top twenty donors financed 79% of all extrabudgetary delivery in the biennium. Multi-donor funding of specific programmes or large projects has more than tripled compared to the previous biennium, to become the second largest modality. The main programmes contributing to this increase are Emergency response to the expansion of Avian Influenza under the Special Fund for Emergency and Rehabilitation Activities (SFERA), FishCode, National Forest Programme Facility, International Treaty on Genetic Resources and Indian Ocean Tuna Commission.
Table 4: Sources of external funding in USD million*
| Donor Name | 2004-05 | 2006-07 |
|---|---|---|
| European Community | 69.4 | 83.2 |
| Multilateral Contributions | 16.9 | 58.0 |
| Italy | 52.8 | 54.0 |
| United States of America | 22.9 | 44.4 |
| UN Office for the Coordination of Humanitarian Affairs | 2.7 | 39.7 |
| Netherlands | 39.0 | 39.2 |
| Japan | 27.4 | 36.3 |
| Norway | 24.6 | 36.0 |
| United Kingdom | 39.6 | 33.8 |
| Sweden | 21.7 | 32.2 |
| United Nations Development Group Office (DGO) Service & Support UNDG/EXECCOM Secretariat | 35.5 | 31.4 |
| UNDP and UNDP Administered Donor Joint Trust Fund | 15.7 | 30.4 |
| Belgium | 25.4 | 29.0 |
| Germany | 19.2 | 23.3 |
| Spain, Kingdom of | 12.6 | 21.3 |
| Common Fund for Humanitarian Action in Sudan | 20.6 | |
| Saudi Arabia, Kingdom of | 15.7 | 16.5 |
| South Africa | 9.6 | 14.4 |
| Brazil | 9.9 | 12.0 |
| Sub-total | 460.7 | 655.6 |
| Other Donors | 141.6 | 179.1 |
| Total | 602.3 | 834.7 |
| * Total extrabudgetary expenditures exclude administrative and operational support costs credited to the general fund and the cost of emergency operations incurred in the Division of Emergency and Rehabilitation. In accordance with the Organization's accounting policy, trust funds contributions is recognized when expenditures are actually incurred for the trust fund projects. | ||
35. The United Nations Office for the Coordination of Humanitarian Affairs (UNOCHA) has become the fifth largest donor of FAO, funding emergency and rehabilitation activities through the recently established UN Central Emergency Response Fund (CERF). While traditional donors dominate in the size of contributions to the CERF, there is a welcome trend for an increasing number of non-traditional donors.
36. The Regular Programme funded share of the field programme declined in 2006-2007 compared to the previous biennium. In particular, TCP delivery declined by to nearly half the 2004-05 level, mainly due to the severe liquidity shortage experienced by the Organization, but also as a result of the high percentage of projects approved during 2004-05 and delivered in that biennium. The use of TCP is described under Section 1.B. The shift in emphasis of the Special Programme for Food Security (SPFS) from small pilot projects to designing and implementing national food security programmes under national and regular programmes for food security explains the decline in delivery in RP funded SPFS projects. Specific achievements of this programme are reported in the Highlights (Section 1.B).
Table 5: Field programme and extrabudgetary support to the Regular Programme by type of contribution (USD million)
| Description | 2004-05 | 2006-07 |
|---|---|---|
| FAO/UNDP | ||
| FAO Execution | 5.5 | 4.5 |
| FAO Implementation | 9.8 | 9.2 |
| Total UNDP | 15.3 | 13.7 |
| TRUST FUNDS | ||
| Trust Funds - Non-emergency | ||
| FAO/Government Cooperative Programme (GCP) | 206.8 | 235.3 |
| Associate Professional Officer (APO) Programme | 17.2 | 16.0 |
| Unilateral Trust Funds (UTF) | 78.7 | 84.9 |
| FAO-Donors Partnership Programmes | 9.6 | 45.4 |
| UN Population Fund (UNFPA) | 1.3 | 1.5 |
| UN Environment Programme (UNEP) | 4.0 | 5.8 |
| Other UN Organizations | 9.7 | 6.0 |
| TeleFood | 4.2 | 3.8 |
| Miscellaneous Trust Funds | 15.9 | 37.4 |
| Total - Non-emergency | 347.5 | 436.1 |
| Trust Funds - emergency assistance | ||
| Special Relief Operations - General | 220.3 | 293.4 |
| Special Relief Operations - Avian Influenza | 2.7 | 63.7 |
| Special Relief Operations - Tsunami | 16.5 | 27.8 |
| Total - emergency assistance | 239.5 | 384.9 |
| Total Trust Funds | 587.0 | 821.0 |
| Total External Funding | 602.3 | 834.7 |
| Regular Programme | ||
| Technical Cooperation Programme (TCP) | 115.3 | 58.0 |
| Special Programme for Food Security (SPFS) | 5.4 | 3.8 |
| Total Regular Programme | 120.7 | 61.8 |
| TOTAL FIELD PROGRAMMES* | 723.1 | 896.5 |
| *Excludes administrative and operational support costs credited to the general fund and the cost of emergency operations incurred in the Division of Emergency and Rehabilitation. | ||
37. As evidenced by Table 5, partnership programmes with donors have increased delivery by over 400%, with their share in non–emergency trust funds increasing from 3% to 10%, while funds in trust also increased by 25%. Although still relatively small, this confirms of a trend towards a programme approach. In fact, there has been an increase in cooperation modalities similar to the partnership programmes with the Governments of Norway and the Netherlands. New donors, notably the Governments of Spain, Sweden and Belgium have adopted a programme approach, in line with the principles espoused by the Paris Declaration on Aid Effectiveness.
38. The delivery of emergency assistance continued at an increased pace, due to large scale emergencies requiring FAO’s involvement, including: Avian Influenza, through the Global Programme for Prevention and Control of Highly Pathogenic Avian Influenza (HPAI), supporting more than 96 beneficiary countries3; operations in Sudan focusing on restoring agricultural assets, livestock and natural resources protection; operations in the Horn of Africa, i.e. in Somalia, Uganda, Ethiopia, Djibouti and Kenya covering emergency and rehabilitation interventions for food insecure and drought affected households, and control of animal diseases. Operations in the Democratic Republic of Congo ranged from direct relief such as the distribution of agricultural inputs to vulnerable groups to longer-term interventions such as capacity building at community and Ministry of Agriculture levels. In Southern Africa, the increasingly complex emergency situation required FAO to adopt a livelihoods-based framework. With regard to the Indian Ocean Tsunami4, operations in Sri Lanka and Indonesia continued until end 2007, and up to mid-2007 in Maldives, Myanmar, Thailand, Seychelles and Somalia. FAO's response was based on the recovery of fisheries, agriculture, forestry based livelihoods and overall coordination and support.