![]()
![]()
![]()
Philip Wardle and Massimo Palmieri
PHILIP WARDLE is Senior Forestry Economist and MASSIMO PALMIERI is Research Assistant in the FAO Forestry Department.
For the two thirds of mankind living in developing countries the energy shortages that are most serious involve forests. Developing countries depend in large part on wood energy. Cooking, heating, artisanry and local manufacturing processes of all kinds are fuelled by wood and charcoal. In part because it is so ubiquitous and so traditional an energy source, fuelwood is considered cheap. In fact, the real total cost of fuelwood is a mystery since it consists of various hidden and invisible costs.
In many parts of the world the idea is prevalent that wood is free, or at least very cheap. For people living in the country, fuelwood may come from family woodlots or from state forest reserves or other "free" woodlands. One part of the hidden cost of fuelwood is family labour and the lost opportunity to do more productive or important work. For wood merchants the cost of fuelwood may be the cost of the labour, of the equipment to cut it, its transformation into charcoal, transportation and storage. Clearly, the market price of wood really gives no more than a vague indication of the actual utility cost to consumers. Adding further to the mystery of the cost of fuelwood is the absence of statistics, since most fuelwood bypasses the record-keeping of markets or fiscal systems. The underestimation or unawareness of the cost of wood energy also contributes heavily to the idea that forest resources are abundant, if not limitless.
Neither the market prices of fuelwood nor the hidden cost to families of fuelwood collection represent the cost of replacing forests. Nor do they take account of the cost of alternative energy supplies that may have to be faced once a forest is exhausted or permanently eradicated. The price may also be so low that it provides no incentive to economize on fuel consumption.
Movement in market prices provides an immediate indication of changes in supply and demand situations. It may also provide invaluable warning signals of developing scarcities in a manner that is understandable both to the community and to the authorities responsible for energy supply. Galloping inflation of fuelwood prices is in itself a warning about forest destruction and depletion of future fuelwood supplies. It is, of course, a painful way to learn, especially for the poorest members of the community. It is preferable that the economic value of trees and forests as sources of energy be adequately appraised and that action be taken to conserve and extend forestry and tree-growing wherever ecologically feasible and economically sensible.
The graphic displays that follow are an attempt at giving insights into the real costs of a cheap but increasingly valuable source of energy, the oldest and still the most commonly used energy for most of the world.
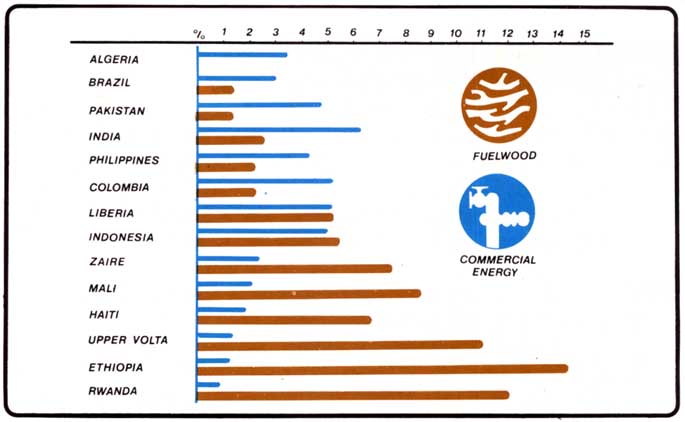
COMMERCIAL ENERGY, FUELWOOD AND GDP
Figure 1. This graph shows a sample of 14 developing countries in which the consumption of commercial energy mainly oil and coal - ranges from 1 to 6 percent of the gross domestic product (GDP). The value of fuelwood and charcoal consumption is calculated at from 1 to 15 percent of GDP. In three low-income countries, Upper Volta, Ethiopia and Rwanda, fuelwood accounts for more than 10 percent of GDP. In these countries, and in Mali and Haiti where fuelwood makes up 7 and 8 percent of GDP, the supply of fuelwood is already very scarce. Although we are comparing fossil fuels and fuelwood, the people who "pay" for this energy are not paying in petrodollars. Indeed, to a great extent they do not pay in cash at all, but with their own labour and time. Still, they pay, and they may have to pay a much higher price for their energy if the fuelwood supply is allowed to become exhausted. At that point they will be forced to resort to costly alternative fuels.
DISTRIBUTION OF COMMODITY PRICES
Figure 2. The price of fuelwood is an important factor to people who do not collect it "free" but have to buy it at the market. This price is also important to producers and growers who must decide on investments in harvesting, transport and replanting of the trees. Governments know that fuelwood prices can be a sensitive matter and are a regular feature of consumer price statistics in several countries where wood is a major urban fuel.
The sample of prices assembled by FAO and plotted in Figure 2 shows that the price of fuelwood is scattered over a very wide range, from a low of US$3.00-4.00 per cubic metre for wood in the forest to a high of $40.00-50.00 for wood delivered in cities. The price of charcoal is also widely scattered, ranging in 1978 from less than $50.00 to $350.00 per ton. Charcoal straight from the kiln has a quite different price from charcoal which has been graded, packed and delivered to the market. The variations in charcoal prices also reflect differences in wage levels between different countries and the existence of subsidies or price control in some countries. In 1975 official prices for fuelwood from government forests in Nepal were equivalent to $1.00 per cubic metre for wood collected by local farmers from the forest and $3.00 per cubic metre for wood collected for local industry. The delivered price to towns near the forest was $8.00, while the delivered price at Kathmandu was $16.00. By comparison, during the same period - 1975 - the wholesale price in Europe was $20.00-30.00 per cubic metre. A recent estimate gave the labour cost of producing charcoal in the Dominican Republic to be equivalent to $50.00 per ton. The producer price was $72.00 per ton, the average market price in rural areas was $128.00 per ton, and the market price in Santo Domingo $200.00 per ton.
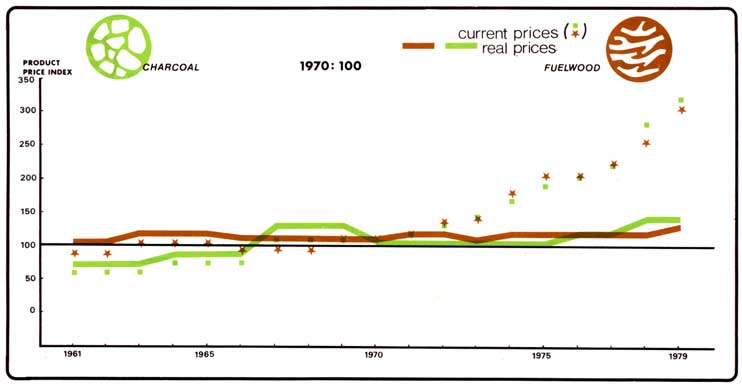
PRICE INDEX: CURRENT PRICES AND REAL PRICES
Figure 3. The 1970s have been a decade of inflation and rapid change in commodity prices. How have fuelwood and charcoal behaved? As for many other forest products, the current dollar price was relatively stable until 1970 but increased rapidly in the 1970s. Figure 3 shows the index with 1970 prices as 100 percent) ranging from 99 to 104 percent in the period 1963-70. This rose to 277 percent by 1978. The United Nations index of the unit value of exports of manufactures - which provides an indication of international inflation - was 225 in 1978. Thus, since 1970 fuelwood and charcoal have increased in price relative to other goods at a rate of about 1.5 to 2 percent per year. In the period 1963-70 their price, relative to other commodities, actually declined at about the same rate. In both periods the change in real price was in the direction of but substantially smaller than the price of fuel oil.
EQUIVALENT ENERGY VALUES OF SOME COMMON FUELS
|
FUEL |
UNIT |
COAL EQUIVALENT |
OIL EQUIVALENT |
ENERGY CONTENT |
|
FUELWOOD |
M3 |
0.33 |
1.6 |
9.4 |
|
CHARCOAL |
MT |
1.0 |
5.0 |
28.9 |
|
CRUDE OIL |
BARREL |
0-2 |
1-0 |
5-8 |
ONE GIGAJOULE IS 109 JOULES
The price of a ton of charcoal is on average six times the price of a cubic metre of fuelwood. This would seem acceptable when one considers that to make a ton of charcoal about six cubic metres of wood are required. One might, however, expect the market price to reflect the lower cost of transporting charcoal, at least for more distant markets. The price per gigajoule of gross energy content averages about twice that of dry fuelwood, which suggests that the market price also reflects the greater convenience and efficiency in utilization and energy recovery of charcoal in normal domestic use. The cost effectiveness of a fuel is an important determinant in the choosing of a particular kind and, therefore, in demand. But also involved are tradition, acceptability, aroma, the way in which the fuel burns, and the requirements of the traditional stove. These factors are not only reflected in the price of fuelwood and charcoal in general but also in the relative pricing of particular species of wood for fuel.
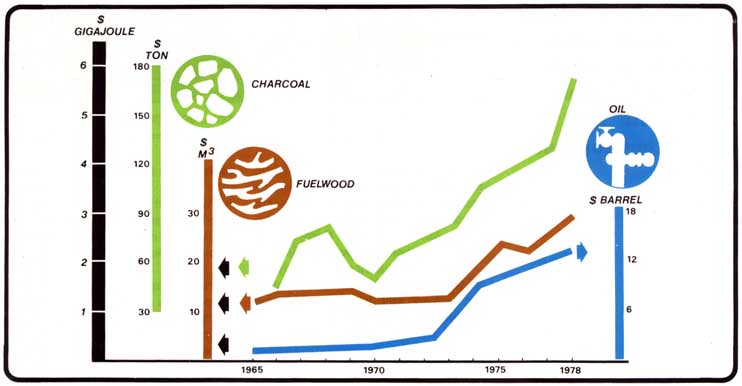
DOLLAR VALUE PER UNIT OF ENERGY CONTENT
Figure 4. Fuelwood and charcoal compete with one another and with other fuels. How do their prices compare?
The relative price of fuelwood and charcoal is shown in Figure 4 against the dollar value per gigajoule of energy content as well as in value per cubic metre or metric ton. The bottom curve on the graph shows the development of the price of crude oil over the period.
Referring once more to the current dollar index: in 1978 the index for fuelwood and charcoal was more than three times its value in 1970, while the index for crude oil was about 10 times the 1970 value. Thus the position changed from one in which the market price per joule of fuelwood energy was on average six times higher than crude oil to one in which it was only 20 to 40 percent higher.
![]()
![]()
![]()